2019 ZiPS Projections – Colorado Rockies

After having typically appeared in the hallowed pages of Baseball Think Factory, Dan Szymborski’s ZiPS projections have now been released at FanGraphs for more than half a decade. The exercise continues this offseason. Below are the projections for the Colorado Rockies.
Batters
Amusingly, Colorado’s lack of ambition this offseason may be counteracting their inability to evaluate their offensive talent. The team signed Daniel Murphy to a contract that is eminently reasonable for a player who is projected to be something like a league-average first baseman over the next two years, but has made no other significant moves. The 1.7 WAR projection for Murphy is only over 118 games, reflecting that there is some risk given that injuries limited him to just 91 games in 2018; he’ll turn 34 in April. Murphy obviously isn’t Paul Goldschmidt, but after the allowing the position to act as an Ian Desmond vanity project, leading to a -0.7 WAR and an 81 wRC+ from their starting first baseman, the Rockies should enjoy a larger improvement than most teams would have from signing him.
Speaking of one of the remaining black holes on offense, it appears that Desmond will primarily play center field in 2019, with Charlie Blackmon shifting to left. With the assumption that one is unaware of what a sunk cost is, ZiPS thinks center field is the least-bad place to play Desmond; he wasn’t really a good center fielder in his year in Texas, but he also didn’t see a relative improvement in his defensive numbers when he moved to the easy end of the defensive spectrum. Without bringing dreams of Bryce Harper, who would be an amazing fit at Coors, to fruition, I’d likely go with an outfield of Blackmon, Raimel Tapia, and David Dahl, with Mike Tauchman and Yonathan Daza as the reserves. Or perhaps Colorado could go after Adam Jones.
Like the Rays, the Rockies have a lot of interesting parts on offense, but unlike the Rays, they show very little inclination to let those players prove themselves or the creativity to find openings for their minor league talent. The team essentially wasted an entire year of the careers of Tapia and Ryan McMahon, giving them occasional playing time, and doing so with all the enthusiasm of a 12-year-old being forced to apologize to a younger sibling. I think Garrett Hampson is more likely to get playing time at second than the depth chart does and that he will be an adequate replacement for DJ LeMahieu there, if a minor downgrade.
Pitchers
I find it amazing that a team that regularly commits what could almost be described as roster construction malpractice on offense can be so brilliant at putting together a pitching rotation. The Rockies may have figured out how to find pitchers who can succeed in Coors Field, though Jon Gray’s struggles vs. his peripherals made for a confusing 2018. Going into last season, ZiPS thought that all five projected starters would be league-average or better and that’s pretty much what happened, though Kyle Freeland crushed his preseason projections to put up a legitimate Cy Young-esque season. ZiPS isn’t sold on Freeland being that good, but it is sold on German Marquez being a legitimate ace pitcher.
Just for reference, Marquez’s 4.1 WAR projection ranks sixth among the starting pitchers who have received their official ZiPS projections for 2019. Not every team has received theirs, of course, but of the top 25 pitchers by WAR last season, only four are on teams that have not had their ZiPS post yet (Luis Severino, Max Scherzer, Freeland, and Jose Berrios).
ZiPS is even optimistic about bounce back seasons from the team’s disappointing, pricey reliever trio of Wade Davis, Jake McGee, and Bryan Shaw. Combined, these three will make $35 million in 2019, but only combined for 0.4 WAR in 2018. The Rockies will take the extra projected win.
Bench and Prospects
A lot of the depth has faded from the system due to graduations and some disappointments, and when all is said and done, ZiPS will likely rank Colorado’s farm system in the 15-20 range. We probably can’t count on Jeff Hoffman at this point, but ZiPS still sorta believes he can be a decent No. 3 or 4 starter, and sees two of the team’s pitching prospects — Peter Lambert and Rico Garcia, the former being far more prized among prospect watchers — as being able to contribute soon. None of the pitchers otherwise really excite ZiPS; Riley Pint was injured and is prized for his stuff rather than his performance, and Ryan Castellani was terrible in Double-A.
ZiPS is still quite confident about Brendan Rodgers, even if the Rockies feel no urgency in getting him into the majors. Personally, I’d be shopping Trevor Story for a real hitter in the outfield and just sticking Rodgers at short, but that’s a little aggressive for a front office that appears to place more value on veteran experience than practically any team in baseball. ZiPS was actually fairly unimpressed with the seasons of Colton Welker and Tyler Nevin. The Hangar (home of the Lancaster JetHawks) has the second-highest overall park factor in the minor leagues over the last three years, with a run multiplier (rather than factor, so the effect’s already halved) of 1.18, behind only Security Service Field of the now-defunct Colorado Springs Sky Sox (1.25). The park’s 1.36 home run multiplier was also second in the minors, behind only Greensboro (1.41).
In other words, ZiPS expects a high-end offensive prospect to absolutely eviscerate opposing pitchers in Lancaster, as Rodgers did (.387/.407/.671). Garrett Hampson had an .849 OPS there and he’s known more for his defense than his offense. A.J. Reed had nearly a 1.100 OPS there!
One pedantic note for 2019: for the WAR graphic, I’m using FanGraphs’ depth chart playing time, not the playing time ZiPS spits out, so there will be occasional differences in WAR totals.
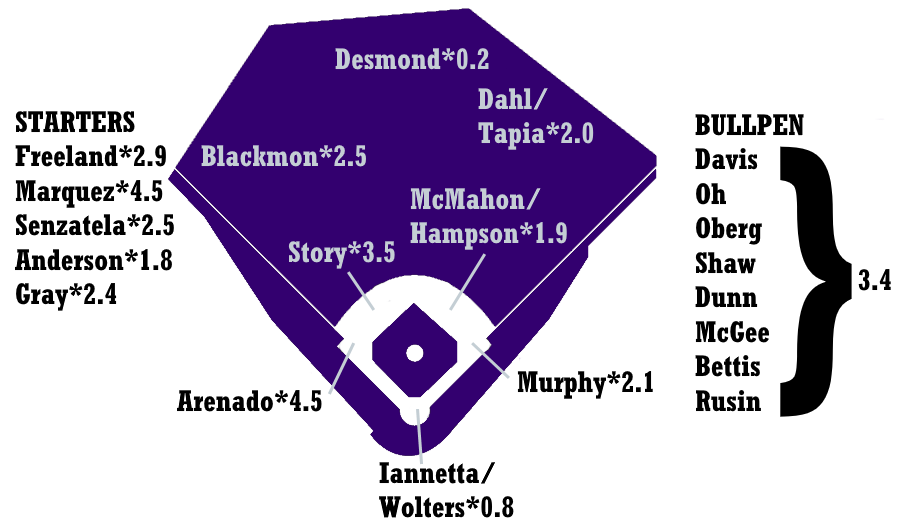
Ballpark graphic courtesy Eephus League. Depth charts constructed by way of those listed here at site.
| Player | B | Age | PO | G | AB | R | H | 2B | 3B | HR | RBI | BB | SO | SB | CS |
|---|---|---|---|---|---|---|---|---|---|---|---|---|---|---|---|
| Nolan Arenado | R | 28 | 3B | 154 | 589 | 100 | 170 | 39 | 4 | 36 | 118 | 63 | 118 | 2 | 3 |
| Trevor Story | R | 26 | SS | 146 | 549 | 81 | 144 | 34 | 5 | 33 | 99 | 48 | 180 | 20 | 4 |
| Charlie Blackmon | L | 32 | LF | 147 | 593 | 112 | 177 | 32 | 7 | 29 | 77 | 52 | 125 | 12 | 7 |
| Brendan Rodgers | R | 22 | SS | 117 | 460 | 60 | 130 | 27 | 3 | 17 | 62 | 25 | 99 | 10 | 4 |
| Garrett Hampson | R | 24 | 2B | 126 | 494 | 66 | 139 | 23 | 8 | 8 | 48 | 47 | 95 | 32 | 7 |
| Mike Tauchman | L | 28 | CF | 132 | 459 | 66 | 129 | 24 | 6 | 12 | 56 | 45 | 94 | 14 | 10 |
| Daniel Murphy | L | 34 | 1B | 118 | 438 | 64 | 138 | 32 | 2 | 17 | 75 | 34 | 54 | 3 | 1 |
| Raimel Tapia | L | 25 | CF | 141 | 516 | 70 | 151 | 31 | 8 | 10 | 58 | 28 | 103 | 19 | 6 |
| David Dahl | L | 25 | LF | 115 | 418 | 57 | 114 | 23 | 4 | 24 | 76 | 29 | 124 | 11 | 5 |
| Ryan McMahon | L | 24 | 3B | 144 | 461 | 58 | 123 | 27 | 4 | 16 | 62 | 39 | 144 | 7 | 3 |
| Josh Fuentes | R | 26 | 3B | 133 | 511 | 62 | 141 | 29 | 7 | 13 | 63 | 20 | 113 | 3 | 5 |
| Brett Nicholas | L | 30 | C | 109 | 404 | 50 | 107 | 24 | 1 | 12 | 57 | 26 | 88 | 1 | 2 |
| Tony Wolters | L | 27 | C | 77 | 222 | 27 | 50 | 9 | 3 | 3 | 27 | 27 | 55 | 2 | 1 |
| Daniel Castro | R | 26 | SS | 109 | 371 | 39 | 101 | 18 | 1 | 4 | 35 | 17 | 45 | 2 | 1 |
| Chris Iannetta | R | 36 | C | 91 | 264 | 30 | 59 | 13 | 0 | 10 | 34 | 40 | 81 | 0 | 0 |
| Peter Mooney | L | 28 | SS | 97 | 330 | 38 | 84 | 15 | 2 | 5 | 33 | 30 | 53 | 2 | 2 |
| Carlos Gonzalez | L | 33 | RF | 128 | 463 | 66 | 119 | 28 | 2 | 19 | 64 | 40 | 118 | 4 | 1 |
| Ian Desmond | R | 33 | CF | 139 | 512 | 73 | 130 | 21 | 4 | 17 | 76 | 42 | 137 | 18 | 5 |
| Patrick Valaika | R | 26 | 2B | 131 | 380 | 44 | 88 | 20 | 2 | 14 | 48 | 21 | 106 | 4 | 3 |
| Yonathan Daza | R | 25 | CF | 107 | 437 | 50 | 127 | 23 | 4 | 3 | 40 | 16 | 81 | 9 | 10 |
| Mark Reynolds | R | 35 | 1B | 113 | 340 | 43 | 82 | 15 | 1 | 17 | 56 | 39 | 112 | 1 | 1 |
| Dom Nunez | L | 24 | C | 98 | 348 | 41 | 74 | 12 | 1 | 8 | 34 | 41 | 94 | 7 | 4 |
| Brian Serven | R | 24 | C | 75 | 271 | 31 | 63 | 14 | 2 | 6 | 26 | 18 | 75 | 1 | 4 |
| Tom Murphy | R | 28 | C | 94 | 325 | 40 | 73 | 20 | 3 | 14 | 50 | 20 | 125 | 3 | 2 |
| Jan Vazquez | B | 28 | C | 61 | 183 | 22 | 42 | 8 | 1 | 4 | 17 | 19 | 57 | 1 | 2 |
| Noel Cuevas | R | 27 | RF | 119 | 389 | 46 | 106 | 17 | 5 | 8 | 41 | 19 | 80 | 8 | 6 |
| Alan Trejo | R | 23 | SS | 113 | 448 | 48 | 107 | 21 | 3 | 8 | 43 | 23 | 128 | 4 | 8 |
| Chris Rabago | R | 26 | C | 77 | 266 | 28 | 60 | 12 | 3 | 3 | 22 | 21 | 72 | 9 | 4 |
| Elliot Soto | R | 29 | SS | 80 | 249 | 27 | 61 | 9 | 2 | 1 | 20 | 25 | 51 | 3 | 2 |
| Roberto Ramos | L | 24 | 1B | 117 | 440 | 56 | 105 | 21 | 2 | 17 | 53 | 39 | 166 | 4 | 2 |
| Shawn O’Malley | R | 31 | 2B | 73 | 215 | 25 | 55 | 8 | 2 | 3 | 21 | 15 | 48 | 5 | 3 |
| Bret Boswell | L | 24 | 3B | 118 | 476 | 60 | 111 | 15 | 5 | 18 | 56 | 26 | 173 | 6 | 5 |
| Vince Fernandez | L | 23 | LF | 115 | 434 | 56 | 92 | 17 | 4 | 15 | 50 | 47 | 200 | 8 | 8 |
| Derrik Gibson | R | 29 | 2B | 86 | 302 | 35 | 73 | 11 | 6 | 4 | 28 | 27 | 74 | 6 | 3 |
| Michael Saunders | L | 32 | RF | 94 | 321 | 42 | 77 | 18 | 3 | 9 | 39 | 34 | 87 | 2 | 2 |
| Drew Butera | R | 35 | C | 62 | 143 | 15 | 33 | 7 | 1 | 3 | 19 | 11 | 35 | 0 | 0 |
| Matt Holliday | R | 39 | LF | 78 | 256 | 31 | 63 | 13 | 0 | 9 | 36 | 34 | 68 | 0 | 0 |
| Colton Welker | R | 21 | 3B | 116 | 465 | 57 | 122 | 23 | 1 | 10 | 50 | 32 | 129 | 4 | 5 |
| Tyler Nevin | R | 22 | 1B | 106 | 418 | 50 | 112 | 19 | 2 | 9 | 42 | 29 | 106 | 6 | 6 |
| Stephen Cardullo | R | 31 | LF | 95 | 291 | 35 | 72 | 16 | 3 | 6 | 32 | 23 | 61 | 3 | 1 |
| Brian Mundell | R | 25 | 1B | 127 | 474 | 58 | 124 | 27 | 1 | 8 | 45 | 44 | 94 | 3 | 4 |
| Drew Weeks | R | 26 | LF | 107 | 403 | 47 | 95 | 15 | 3 | 10 | 42 | 28 | 114 | 9 | 8 |
| Sam Hilliard | L | 25 | RF | 123 | 472 | 54 | 109 | 16 | 4 | 10 | 44 | 38 | 179 | 20 | 14 |
| Player | PA | BA | OBP | SLG | OPS+ | ISO | BABIP | RC/27 | Def | WAR | No. 1 Comp |
|---|---|---|---|---|---|---|---|---|---|---|---|
| Nolan Arenado | 663 | .289 | .356 | .552 | 123 | .263 | .308 | 7.4 | 9 | 4.5 | Ron Cey |
| Trevor Story | 605 | .262 | .326 | .523 | 108 | .260 | .330 | 6.5 | 1 | 3.3 | Frankie Crosetti |
| Charlie Blackmon | 660 | .298 | .363 | .523 | 119 | .224 | .337 | 7.3 | 1 | 3.0 | Larry Herndon |
| Brendan Rodgers | 500 | .283 | .331 | .465 | 97 | .183 | .328 | 5.8 | 2 | 2.0 | Zoilo Versalles |
| Garrett Hampson | 552 | .281 | .343 | .409 | 88 | .128 | .335 | 5.7 | 5 | 1.9 | Willie Harris |
| Mike Tauchman | 513 | .281 | .344 | .438 | 95 | .157 | .331 | 5.5 | 5 | 1.7 | Brian McRae |
| Daniel Murphy | 479 | .315 | .365 | .514 | 117 | .199 | .330 | 7.4 | -1 | 1.7 | Al Oliver |
| Raimel Tapia | 554 | .293 | .330 | .442 | 92 | .149 | .350 | 5.7 | 1 | 1.5 | Steve Finley |
| David Dahl | 450 | .273 | .321 | .519 | 106 | .246 | .333 | 6.2 | 2 | 1.4 | Cody Ross |
| Ryan McMahon | 507 | .267 | .325 | .447 | 91 | .180 | .355 | 5.4 | 3 | 1.3 | Jeff Blauser |
| Josh Fuentes | 546 | .276 | .311 | .436 | 85 | .160 | .332 | 4.9 | 5 | 1.1 | Robb Quinlan |
| Brett Nicholas | 436 | .265 | .313 | .418 | 81 | .153 | .313 | 4.7 | -2 | 0.7 | Ed Ott |
| Tony Wolters | 255 | .225 | .319 | .333 | 64 | .108 | .287 | 3.7 | 6 | 0.5 | Doug Newstrom |
| Daniel Castro | 395 | .272 | .304 | .358 | 66 | .086 | .301 | 4.0 | 7 | 0.5 | David Milstien |
| Chris Iannetta | 311 | .223 | .332 | .386 | 80 | .163 | .283 | 4.5 | -3 | 0.3 | Rick Dempsey |
| Peter Mooney | 368 | .255 | .319 | .358 | 70 | .103 | .290 | 4.1 | 2 | 0.3 | John Tamargo |
| Carlos Gonzalez | 507 | .257 | .316 | .449 | 89 | .192 | .307 | 5.2 | -1 | 0.3 | Troy O’Leary |
| Ian Desmond | 563 | .254 | .315 | .410 | 80 | .156 | .316 | 4.8 | -6 | 0.2 | Doug Clark |
| Patrick Valaika | 410 | .232 | .272 | .405 | 67 | .174 | .285 | 3.8 | 6 | 0.2 | Scott White |
| Yonathan Daza | 462 | .291 | .319 | .382 | 75 | .092 | .351 | 4.3 | 2 | 0.2 | Aaron Mathews |
| Mark Reynolds | 383 | .241 | .321 | .441 | 89 | .200 | .308 | 5.0 | -1 | 0.1 | Larry Parrish |
| Dom Nunez | 397 | .213 | .299 | .322 | 56 | .109 | .268 | 3.3 | 5 | 0.0 | Brian Moon |
| Brian Serven | 302 | .232 | .286 | .365 | 62 | .133 | .300 | 3.4 | 3 | 0.0 | Joe Depastino |
| Tom Murphy | 349 | .225 | .275 | .434 | 74 | .209 | .317 | 4.1 | -3 | 0.0 | Jayhawk Owens |
| Jan Vazquez | 211 | .230 | .317 | .350 | 68 | .120 | .311 | 3.7 | -1 | 0.0 | Dave Parrish |
| Noel Cuevas | 416 | .272 | .312 | .404 | 78 | .131 | .326 | 4.6 | 4 | 0.0 | Chad Mottola |
| Alan Trejo | 484 | .239 | .281 | .353 | 58 | .114 | .317 | 3.2 | 9 | 0.0 | Juan Delgado |
| Chris Rabago | 295 | .226 | .288 | .327 | 54 | .102 | .298 | 3.3 | 3 | -0.1 | Luis Taveras |
| Elliot Soto | 281 | .245 | .314 | .309 | 58 | .064 | .305 | 3.4 | 2 | -0.1 | Frank Kellner |
| Roberto Ramos | 486 | .239 | .305 | .411 | 78 | .173 | .342 | 4.5 | 3 | -0.2 | Rick Sofield |
| Shawn O’Malley | 240 | .256 | .308 | .353 | 66 | .098 | .317 | 3.9 | 0 | -0.2 | Chico Ruiz |
| Bret Boswell | 513 | .233 | .277 | .399 | 67 | .166 | .326 | 3.8 | 2 | -0.3 | Ray Thoma |
| Vince Fernandez | 488 | .212 | .296 | .373 | 67 | .161 | .352 | 3.6 | 8 | -0.3 | Steve Howard |
| Derrik Gibson | 335 | .242 | .306 | .358 | 66 | .116 | .308 | 3.9 | -2 | -0.4 | Zach Sorensen |
| Michael Saunders | 358 | .240 | .316 | .399 | 78 | .159 | .302 | 4.4 | -2 | -0.4 | Dann Howitt |
| Drew Butera | 157 | .231 | .288 | .357 | 61 | .126 | .286 | 3.6 | -4 | -0.5 | Joe Oliver |
| Matt Holliday | 295 | .246 | .336 | .402 | 84 | .156 | .302 | 4.8 | -7 | -0.5 | Eddie Williams |
| Colton Welker | 506 | .262 | .310 | .381 | 72 | .118 | .344 | 4.2 | -4 | -0.5 | Aurelio Rodriguez |
| Tyler Nevin | 453 | .268 | .318 | .388 | 76 | .120 | .340 | 4.4 | 0 | -0.6 | Wes Bankston |
| Stephen Cardullo | 320 | .247 | .304 | .385 | 72 | .137 | .295 | 4.2 | -3 | -0.7 | Mike McCain |
| Brian Mundell | 528 | .262 | .326 | .373 | 75 | .112 | .312 | 4.3 | -4 | -1.0 | Tim McWilliam |
| Drew Weeks | 440 | .236 | .290 | .362 | 63 | .127 | .305 | 3.5 | -6 | -1.7 | Choo Freeman |
| Sam Hilliard | 517 | .231 | .288 | .345 | 58 | .114 | .350 | 3.3 | 0 | -1.7 | Jalal Leach |
| Player | T | Age | W | L | ERA | G | GS | IP | H | ER | HR | BB | SO |
|---|---|---|---|---|---|---|---|---|---|---|---|---|---|
| German Marquez | R | 24 | 15 | 8 | 3.82 | 33 | 33 | 190.7 | 182 | 81 | 26 | 52 | 208 |
| Jon Gray | R | 27 | 12 | 8 | 4.40 | 32 | 32 | 174.0 | 176 | 85 | 23 | 55 | 176 |
| Kyle Freeland | L | 26 | 13 | 10 | 4.54 | 32 | 31 | 180.3 | 191 | 91 | 25 | 63 | 141 |
| Antonio Senzatela | R | 24 | 10 | 7 | 4.47 | 35 | 23 | 137.0 | 141 | 68 | 18 | 47 | 112 |
| Tyler Anderson | L | 29 | 8 | 7 | 4.92 | 28 | 27 | 146.3 | 152 | 80 | 26 | 49 | 129 |
| Chi Chi Gonzalez | R | 27 | 9 | 7 | 4.84 | 21 | 19 | 102.3 | 114 | 55 | 10 | 44 | 57 |
| Jeff Hoffman | R | 26 | 8 | 7 | 5.05 | 29 | 24 | 123.0 | 132 | 69 | 17 | 55 | 103 |
| Rico Garcia | R | 25 | 10 | 9 | 5.30 | 25 | 23 | 130.7 | 151 | 77 | 21 | 50 | 99 |
| Peter Lambert | R | 22 | 9 | 9 | 5.37 | 27 | 27 | 137.3 | 165 | 82 | 25 | 34 | 89 |
| Scott Oberg | R | 29 | 5 | 3 | 3.74 | 67 | 0 | 65.0 | 62 | 27 | 6 | 22 | 60 |
| Wade Davis | R | 33 | 5 | 3 | 3.72 | 61 | 0 | 55.7 | 44 | 23 | 7 | 27 | 70 |
| Chad Bettis | R | 30 | 5 | 5 | 5.36 | 26 | 22 | 122.7 | 138 | 73 | 20 | 46 | 84 |
| Seung-hwan Oh | R | 36 | 5 | 3 | 4.03 | 64 | 0 | 58.0 | 55 | 26 | 10 | 15 | 61 |
| D.J. Johnson | R | 29 | 4 | 3 | 4.03 | 52 | 0 | 60.3 | 57 | 27 | 6 | 28 | 62 |
| Sam Howard | L | 26 | 6 | 7 | 5.77 | 25 | 22 | 107.7 | 126 | 69 | 20 | 45 | 80 |
| Chris Rusin | L | 32 | 3 | 2 | 4.55 | 53 | 0 | 63.3 | 66 | 32 | 8 | 22 | 49 |
| Heath Holder | R | 26 | 5 | 4 | 4.85 | 46 | 2 | 72.3 | 72 | 39 | 9 | 42 | 72 |
| Bryan Shaw | R | 31 | 5 | 4 | 4.60 | 66 | 0 | 60.7 | 62 | 31 | 8 | 26 | 55 |
| Yency Almonte | R | 25 | 6 | 6 | 5.68 | 28 | 17 | 90.3 | 104 | 57 | 16 | 42 | 68 |
| Sean Nolin | L | 29 | 4 | 4 | 5.51 | 24 | 12 | 63.7 | 70 | 39 | 11 | 31 | 51 |
| Jake McGee | L | 32 | 3 | 2 | 4.59 | 57 | 0 | 49.0 | 50 | 25 | 8 | 15 | 46 |
| Carlos Estevez | R | 26 | 4 | 3 | 4.59 | 51 | 0 | 49.0 | 48 | 25 | 7 | 20 | 49 |
| Santiago Casilla | R | 38 | 2 | 2 | 4.83 | 41 | 0 | 41.0 | 40 | 22 | 5 | 22 | 35 |
| Alec Asher | R | 27 | 5 | 6 | 5.90 | 25 | 17 | 100.7 | 123 | 66 | 20 | 35 | 58 |
| Matt Pierpont | R | 28 | 4 | 3 | 4.94 | 47 | 0 | 54.7 | 57 | 30 | 8 | 23 | 51 |
| Reid Humphreys | R | 24 | 2 | 2 | 4.89 | 45 | 0 | 38.7 | 37 | 21 | 6 | 22 | 40 |
| Mitch Horacek | L | 27 | 3 | 3 | 5.07 | 47 | 0 | 55.0 | 56 | 31 | 8 | 33 | 53 |
| Austin House | R | 28 | 3 | 3 | 5.29 | 41 | 0 | 49.3 | 55 | 29 | 6 | 25 | 33 |
| Mike Dunn | L | 34 | 2 | 2 | 5.40 | 45 | 0 | 33.3 | 33 | 20 | 5 | 22 | 32 |
| Brett Oberholtzer | L | 29 | 6 | 8 | 6.26 | 23 | 21 | 113.7 | 145 | 79 | 24 | 45 | 70 |
| Scott McGough | R | 29 | 4 | 5 | 5.54 | 41 | 1 | 65.0 | 72 | 40 | 13 | 27 | 58 |
| Logan Cozart | R | 26 | 5 | 6 | 5.52 | 51 | 0 | 58.7 | 66 | 36 | 9 | 27 | 43 |
| Rayan Gonzalez | R | 28 | 1 | 1 | 6.12 | 27 | 0 | 25.0 | 28 | 17 | 4 | 16 | 18 |
| Jairo Diaz | R | 28 | 2 | 2 | 5.88 | 34 | 0 | 33.7 | 35 | 22 | 4 | 25 | 28 |
| Ryan Castellani | R | 23 | 7 | 10 | 6.34 | 26 | 26 | 126.3 | 155 | 89 | 22 | 70 | 75 |
| Harrison Musgrave | L | 27 | 5 | 6 | 6.26 | 32 | 12 | 83.3 | 97 | 58 | 19 | 37 | 62 |
| Evan Grills | L | 27 | 5 | 6 | 6.44 | 19 | 16 | 88.0 | 113 | 63 | 22 | 24 | 57 |
| Shane Broyles | R | 27 | 2 | 2 | 5.71 | 43 | 0 | 52.0 | 53 | 33 | 10 | 33 | 57 |
| Ben Bowden | L | 24 | 4 | 4 | 5.79 | 48 | 0 | 46.7 | 47 | 30 | 9 | 33 | 51 |
| Jesus Tinoco | R | 24 | 8 | 11 | 6.41 | 25 | 25 | 125.0 | 155 | 89 | 29 | 52 | 89 |
| David Holmberg | L | 27 | 6 | 8 | 6.45 | 26 | 18 | 106.0 | 134 | 76 | 24 | 42 | 59 |
| Keith Hessler | L | 30 | 2 | 3 | 5.92 | 45 | 0 | 51.7 | 56 | 34 | 9 | 33 | 46 |
| Mason Melotakis | L | 28 | 2 | 2 | 6.62 | 29 | 0 | 34.0 | 41 | 25 | 8 | 20 | 24 |
| Jordan Foley | R | 25 | 3 | 4 | 6.34 | 36 | 2 | 55.3 | 60 | 39 | 10 | 45 | 51 |
| David Holman | R | 29 | 4 | 5 | 6.99 | 21 | 7 | 64.3 | 85 | 50 | 15 | 27 | 30 |
| Zach Jemiola | R | 25 | 4 | 6 | 7.33 | 16 | 16 | 84.7 | 115 | 69 | 21 | 39 | 37 |
| Player | TBF | K/9 | BB/9 | HR/9 | BABIP | ERA+ | ERA- | FIP | WAR | No. 1 Comp |
|---|---|---|---|---|---|---|---|---|---|---|
| German Marquez | 802 | 9.82 | 2.45 | 1.23 | .307 | 130 | 77 | 3.68 | 4.5 | Roy Oswalt |
| Jon Gray | 748 | 9.10 | 2.84 | 1.19 | .314 | 109 | 92 | 3.91 | 2.9 | Jeff Weaver |
| Kyle Freeland | 789 | 7.04 | 3.14 | 1.25 | .301 | 106 | 95 | 4.57 | 2.7 | Curt Simmons |
| Antonio Senzatela | 594 | 7.36 | 3.09 | 1.18 | .299 | 107 | 93 | 4.36 | 2.0 | Milt Pappas |
| Tyler Anderson | 633 | 7.93 | 3.01 | 1.60 | .296 | 98 | 103 | 4.78 | 1.7 | Jim Abbott |
| Chi Chi Gonzalez | 462 | 5.01 | 3.87 | 0.88 | .301 | 99 | 101 | 4.74 | 1.3 | Don Welchel |
| Jeff Hoffman | 552 | 7.54 | 4.02 | 1.24 | .309 | 95 | 105 | 4.74 | 1.2 | Steve Arlin |
| Rico Garcia | 592 | 6.82 | 3.44 | 1.45 | .315 | 90 | 111 | 5.08 | 1.0 | Mike LaCoss |
| Peter Lambert | 608 | 5.83 | 2.23 | 1.64 | .310 | 89 | 112 | 5.14 | 1.0 | Carlos Silva |
| Scott Oberg | 277 | 8.31 | 3.05 | 0.83 | .301 | 128 | 78 | 3.66 | 0.9 | Kent Tekulve |
| Wade Davis | 237 | 11.32 | 4.37 | 1.13 | .282 | 129 | 77 | 3.83 | 0.9 | Jason Isringhausen |
| Chad Bettis | 547 | 6.16 | 3.38 | 1.47 | .301 | 90 | 112 | 5.15 | 0.9 | Bennie Daniels |
| Seung-hwan Oh | 243 | 9.47 | 2.33 | 1.55 | .292 | 123 | 81 | 4.22 | 0.8 | Jeff Reardon |
| D.J. Johnson | 265 | 9.25 | 4.18 | 0.90 | .307 | 119 | 84 | 3.93 | 0.6 | Jeff Cornell |
| Sam Howard | 492 | 6.69 | 3.76 | 1.67 | .311 | 83 | 120 | 5.50 | 0.4 | Jake Chapman |
| Chris Rusin | 275 | 6.96 | 3.13 | 1.14 | .299 | 106 | 95 | 4.38 | 0.3 | Billy Hoeft |
| Heath Holder | 331 | 8.96 | 5.23 | 1.12 | .310 | 99 | 101 | 4.73 | 0.3 | Alan Mills |
| Bryan Shaw | 267 | 8.16 | 3.86 | 1.19 | .305 | 104 | 96 | 4.39 | 0.3 | Dwight Bernard |
| Yency Almonte | 415 | 6.77 | 4.18 | 1.59 | .310 | 84 | 118 | 5.51 | 0.3 | Sean White |
| Sean Nolin | 290 | 7.21 | 4.38 | 1.55 | .304 | 87 | 115 | 5.40 | 0.3 | Mike Kekich |
| Jake McGee | 211 | 8.45 | 2.76 | 1.47 | .300 | 105 | 96 | 4.44 | 0.2 | Brian Shouse |
| Carlos Estevez | 215 | 9.00 | 3.67 | 1.29 | .301 | 105 | 96 | 4.42 | 0.2 | Gerry Hannahs |
| Santiago Casilla | 186 | 7.68 | 4.83 | 1.10 | .292 | 103 | 97 | 4.93 | 0.2 | Ted Abernathy |
| Alec Asher | 459 | 5.19 | 3.13 | 1.79 | .304 | 81 | 123 | 5.83 | 0.1 | Pat Ahearne |
| Matt Pierpont | 243 | 8.40 | 3.79 | 1.32 | .310 | 97 | 103 | 4.61 | 0.1 | Mike Gardner |
| Reid Humphreys | 174 | 9.31 | 5.12 | 1.40 | .298 | 98 | 102 | 4.96 | 0.1 | Anthony Chavez |
| Mitch Horacek | 253 | 8.67 | 5.40 | 1.31 | .308 | 95 | 106 | 5.08 | 0.0 | Bobby Sprowl |
| Austin House | 227 | 6.02 | 4.56 | 1.09 | .306 | 91 | 110 | 5.10 | -0.1 | Gary Wagner |
| Mike Dunn | 154 | 8.64 | 5.94 | 1.35 | .298 | 89 | 113 | 5.25 | -0.1 | Marshall Bridges |
| Brett Oberholtzer | 527 | 5.54 | 3.56 | 1.90 | .316 | 77 | 130 | 5.98 | -0.2 | Dave Otto |
| Scott McGough | 292 | 8.03 | 3.74 | 1.80 | .309 | 87 | 115 | 5.35 | -0.2 | Rob Marquez |
| Logan Cozart | 267 | 6.60 | 4.14 | 1.38 | .308 | 87 | 115 | 5.21 | -0.2 | Andy Nezelek |
| Rayan Gonzalez | 118 | 6.48 | 5.76 | 1.44 | .304 | 78 | 128 | 5.83 | -0.3 | Tom Dukes |
| Jairo Diaz | 161 | 7.49 | 6.68 | 1.07 | .304 | 82 | 123 | 5.44 | -0.3 | Newt Kimball |
| Ryan Castellani | 601 | 5.34 | 4.99 | 1.57 | .311 | 76 | 132 | 6.06 | -0.3 | Carlos Paredes |
| Harrison Musgrave | 382 | 6.70 | 4.00 | 2.05 | .300 | 77 | 131 | 6.10 | -0.3 | John Shea |
| Evan Grills | 399 | 5.83 | 2.45 | 2.25 | .313 | 74 | 134 | 6.09 | -0.3 | Randy Marshall |
| Shane Broyles | 242 | 9.87 | 5.71 | 1.73 | .309 | 84 | 119 | 5.53 | -0.3 | Mike MacDougal |
| Ben Bowden | 220 | 9.84 | 6.36 | 1.74 | .306 | 83 | 121 | 5.79 | -0.3 | Justin Lamber |
| Jesus Tinoco | 579 | 6.41 | 3.74 | 2.09 | .313 | 75 | 134 | 6.16 | -0.3 | David Pauley |
| David Holmberg | 491 | 5.01 | 3.57 | 2.04 | .306 | 74 | 134 | 6.34 | -0.4 | Omar Daal |
| Keith Hessler | 243 | 8.01 | 5.75 | 1.57 | .309 | 81 | 123 | 5.72 | -0.4 | Mark Watson |
| Mason Melotakis | 162 | 6.35 | 5.29 | 2.12 | .306 | 73 | 138 | 6.74 | -0.5 | Danny Young |
| Jordan Foley | 271 | 8.30 | 7.32 | 1.63 | .311 | 76 | 132 | 6.31 | -0.5 | Darin Moore |
| David Holman | 303 | 4.20 | 3.78 | 2.10 | .308 | 69 | 146 | 6.69 | -0.7 | Wes Wilkerson |
| Zach Jemiola | 406 | 3.93 | 4.15 | 2.23 | .309 | 65 | 153 | 7.06 | -1.0 | Brian Ahern |
Disclaimer: ZiPS projections are computer-based projections of performance. Performances have not been allocated to predicted playing time in the majors — many of the players listed above are unlikely to play in the majors at all in 2019. ZiPS is projecting equivalent production — a .240 ZiPS projection may end up being .280 in AAA or .300 in AA, for example. Whether or not a player will play is one of many non-statistical factors one has to take into account when predicting the future.
Players are listed with their most recent teams, unless I have made a mistake. This is very possible, as a lot of minor-league signings go generally unreported in the offseason.
ZiPS’ projections are based on the American League having a 4.29 ERA and the National League having a 4.15 ERA.
Players who are expected to be out due to injury are still projected. More information is always better than less information, and a computer isn’t the tool that should project the injury status of, for example, a pitcher who has had Tommy John surgery.
Both hitters and pitchers are ranked by projected zWAR — which is to say, WAR values as calculated by me, Dan Szymborski, whose surname is spelled with a z. WAR values might differ slightly from those which appear in full release of ZiPS. Finally, I will advise anyone against — and might karate chop anyone guilty of — merely adding up WAR totals on a depth chart to produce projected team WAR.
Dan Szymborski is a senior writer for FanGraphs and the developer of the ZiPS projection system. He was a writer for ESPN.com from 2010-2018, a regular guest on a number of radio shows and podcasts, and a voting BBWAA member. He also maintains a terrible Twitter account at @DSzymborski.
Stark differential in playing time for Murphy versus Depth Charts — Is this purely injury / age-related rest or is there any callup or positional changing that would reduce Murphy’s Plate Appearances?
Purely age, history, injury history. ZiPS is intentionally agnostic when it comes to playing time choices.
So are playing time numbers more or less viewed as the ceiling for a player’s playing time?
Like CarGo might get less than 500 PAs due to playing time choices, but if you’re hoping to play him for more you’re gonna be disappointed?