2019 ZiPS Projections – Oakland Athletics

After having typically appeared in the hallowed pages of Baseball Think Factory, Dan Szymborski’s ZiPS projections have now been released at FanGraphs for more than half a decade. The exercise continues this offseason. Below are the projections for the Oakland Athletics.
Batters
From the projections, one can see why the A’s let Jed Lowrie go so easily, despite his legitimate star-level performance in 2017 and ’18. Five Oakland infielders — the starters plus Franklin Barreto — project to be league-average or better. Now, none of them project to reach the level of Lowrie’s 4.9 WAR in 2018, but then again, neither does Lowrie, and mid-30s middle infielders tend to have pretty steep aging curves. And really, if anyone thought Lowrie was going to perform at an All-Star level again in 2019, he likely would have done better than two years and $20 million. Jurickson Profar projects to be a worthy replacement for Lowrie, and his return from literally years of injury and then underperformance is one of my favorite stories in baseball.
Except for catcher and the four-headed chimera in left field — at least, as our depth charts have it figured so far — the A’s project to be average or better, and sometimes significantly so, at every position. Perhaps ZiPS is trying to do penance for missing on the A’s by something like 20 wins in 2018.
Don’t get too excited about the Matt Olson comp; this version is from when Ortiz was still in the “Wait, is that the same guy as David Arias?” portion of his career, before he became Big Papi.
Pitchers
Ok, the highs are not very high. That’s due in large part to the fact that ZiPS is projecting fairly low innings totals for Oakland’s pitchers across the board. The system is aware of the injuries to Sean Manaea and Andrew Triggs in very general terms, so these aren’t theoretical “healthy” projections. As such, Manaea’s projection isn’t unexpected, but Triggs’s was a legitimate surprise to me. But again, I’m going to de-wind your sails a little bit by noting that ZiPS sees the Triggs injury as a generic “shoulder” ailment because I don’t have the data on thoracic outlet syndrome recoveries that I do with those from Tommy John. Regardless, this is an injury that you really don’t want.
The rotation’s highs may not be very high, but ZiPS sees the group as incredibly deep. 18 pitchers project to be worth at least one WAR if playing in the majors, and though a few of them are relievers (Blake Treinen, Lou Trivino, and Joakim Soria) and Brett Anderson is a free agent, that’s still a lot of options.
Bench and Prospects
I hope that someday I can love somebody or something the way ZiPS loves Jesus Luzardo. No, the computer isn’t projecting him to actually have Steve Carlton’s career, but who wouldn’t take that as a top comp? ZiPS already sees Luzardo as the team’s best starting pitcher, a pretty shocking projection for a guy who started the season in A-ball and whose parent club isn’t, say, the Baltimore Orioles.
It also interests me that ZiPS pegs Sean Murphy as the team’s best catching option. I’m definitely interested to see where he falls on the McDongenhagen prospect list; he ranked sixth last year, but after a .285/.361/.489 year and a finish at Triple-A, I would imagine he’s moved up. Conversely, Oakland cooled on Dustin Fowler and now largely sees him as a fourth outfielder. Overall, ZiPS sees a lot more of interest in the minor league pitchers than the hitters.
One pedantic note for 2019: for the WAR graphic, I’m using FanGraphs’ depth chart playing time, not the playing time ZiPS spits out, so there will be occasional differences in WAR totals.
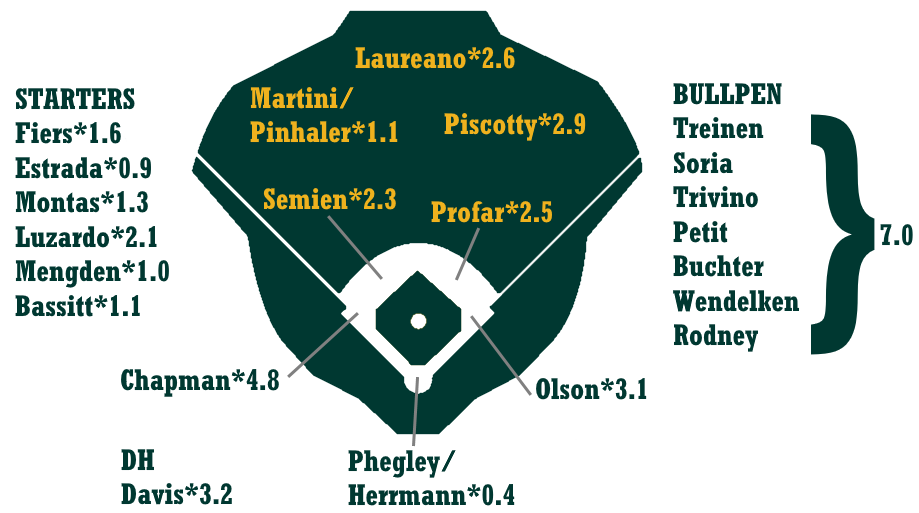
Ballpark graphic courtesy Eephus League. Depth charts constructed by way of those listed here at site.
| Player | B | Age | PO | G | AB | R | H | 2B | 3B | HR | RBI | BB | SO | SB | CS |
|---|---|---|---|---|---|---|---|---|---|---|---|---|---|---|---|
| Matt Chapman | R | 26 | 3B | 140 | 526 | 83 | 126 | 31 | 4 | 28 | 76 | 56 | 170 | 3 | 3 |
| Matt Olson | L | 25 | 1B | 150 | 535 | 81 | 126 | 30 | 1 | 31 | 87 | 70 | 170 | 2 | 1 |
| Khris Davis | R | 31 | DH | 145 | 531 | 82 | 131 | 24 | 1 | 39 | 108 | 57 | 174 | 1 | 1 |
| Stephen Piscotty | R | 28 | RF | 146 | 526 | 72 | 135 | 35 | 2 | 21 | 80 | 51 | 125 | 4 | 3 |
| Ramon Laureano | R | 24 | CF | 120 | 449 | 62 | 108 | 23 | 4 | 15 | 53 | 43 | 143 | 18 | 5 |
| Marcus Semien | R | 28 | SS | 152 | 580 | 78 | 145 | 30 | 3 | 18 | 67 | 54 | 132 | 13 | 4 |
| Franklin Barreto | R | 23 | 2B | 124 | 449 | 63 | 107 | 20 | 3 | 24 | 65 | 32 | 157 | 8 | 4 |
| Jurickson Profar | B | 26 | SS | 137 | 485 | 68 | 119 | 28 | 4 | 13 | 56 | 49 | 88 | 8 | 1 |
| Sean Murphy | R | 24 | C | 84 | 314 | 36 | 69 | 18 | 1 | 8 | 33 | 22 | 74 | 2 | 0 |
| Nick Martini | L | 29 | LF | 124 | 426 | 55 | 104 | 19 | 3 | 6 | 42 | 53 | 103 | 5 | 2 |
| Dustin Fowler | L | 24 | CF | 126 | 474 | 53 | 125 | 25 | 6 | 14 | 62 | 19 | 105 | 16 | 7 |
| Chad Pinder | R | 27 | LF | 116 | 387 | 50 | 93 | 19 | 2 | 16 | 47 | 26 | 120 | 2 | 2 |
| Mark Canha | R | 30 | LF | 119 | 385 | 55 | 91 | 24 | 1 | 16 | 55 | 32 | 99 | 3 | 2 |
| Chris Herrmann | L | 31 | C | 82 | 210 | 28 | 42 | 8 | 2 | 5 | 25 | 29 | 67 | 2 | 0 |
| Corban Joseph | L | 30 | 2B | 122 | 440 | 47 | 109 | 20 | 1 | 9 | 45 | 30 | 57 | 4 | 4 |
| Eric Campbell | R | 32 | 2B | 102 | 325 | 45 | 77 | 15 | 2 | 5 | 39 | 45 | 71 | 5 | 4 |
| Bruce Maxwell | L | 28 | C | 82 | 271 | 26 | 59 | 15 | 0 | 5 | 28 | 25 | 79 | 0 | 0 |
| Beau Taylor | L | 29 | C | 88 | 305 | 32 | 63 | 14 | 1 | 4 | 26 | 35 | 95 | 1 | 1 |
| Josh Phegley | R | 31 | C | 68 | 200 | 22 | 43 | 13 | 1 | 5 | 23 | 15 | 52 | 0 | 0 |
| Luis Barrera | L | 23 | CF | 128 | 472 | 49 | 110 | 20 | 7 | 4 | 38 | 27 | 105 | 16 | 7 |
| Matthew Joyce | L | 34 | LF | 109 | 287 | 41 | 62 | 15 | 0 | 11 | 33 | 44 | 76 | 1 | 2 |
| Mark Payton | L | 27 | LF | 91 | 320 | 37 | 70 | 12 | 4 | 7 | 31 | 32 | 87 | 4 | 5 |
| Slade Heathcott | L | 28 | 1B | 80 | 281 | 31 | 59 | 12 | 2 | 6 | 28 | 23 | 102 | 6 | 3 |
| Jonah Heim | B | 24 | C | 114 | 428 | 40 | 88 | 18 | 1 | 6 | 36 | 27 | 104 | 2 | 1 |
| Skye Bolt | B | 25 | CF | 118 | 444 | 48 | 89 | 21 | 3 | 11 | 44 | 39 | 157 | 10 | 5 |
| B.J. Boyd | L | 25 | LF | 120 | 469 | 46 | 111 | 17 | 3 | 4 | 38 | 25 | 93 | 7 | 4 |
| Brett Vertigan | L | 28 | LF | 101 | 378 | 37 | 77 | 16 | 2 | 1 | 22 | 35 | 108 | 9 | 4 |
| Sheldon Neuse | R | 24 | 3B | 128 | 481 | 45 | 105 | 22 | 3 | 7 | 41 | 28 | 168 | 5 | 3 |
| Nate Mondou | L | 24 | 2B | 129 | 503 | 52 | 113 | 21 | 3 | 3 | 38 | 36 | 109 | 8 | 7 |
| Tyler Ramirez | L | 24 | LF | 129 | 494 | 53 | 103 | 23 | 3 | 9 | 45 | 46 | 185 | 4 | 3 |
| Melvin Mercedes | B | 27 | 2B | 85 | 282 | 29 | 58 | 8 | 2 | 1 | 17 | 31 | 69 | 5 | 5 |
| Jorge Mateo | R | 24 | SS | 127 | 500 | 48 | 103 | 20 | 11 | 7 | 45 | 26 | 163 | 22 | 11 |
| Kevin Merrell | L | 23 | SS | 77 | 326 | 30 | 73 | 9 | 2 | 1 | 19 | 15 | 83 | 7 | 7 |
| Steve Lombardozzi Jr. | B | 30 | 1B | 107 | 388 | 40 | 89 | 15 | 2 | 1 | 25 | 32 | 64 | 5 | 5 |
| J.P. Sportman | R | 27 | 2B | 117 | 472 | 46 | 100 | 20 | 3 | 10 | 46 | 21 | 135 | 12 | 7 |
| Seth Brown | L | 26 | 1B | 128 | 497 | 52 | 101 | 22 | 3 | 11 | 51 | 38 | 182 | 5 | 2 |
| Player | PA | BA | OBP | SLG | OPS+ | ISO | BABIP | RC/27 | Def | WAR | No. 1 Comp |
|---|---|---|---|---|---|---|---|---|---|---|---|
| Matt Chapman | 591 | .240 | .318 | .473 | 115 | .234 | .299 | 5.3 | 14 | 4.3 | Eric Hinske |
| Matt Olson | 614 | .236 | .329 | .469 | 117 | .234 | .284 | 5.5 | 7 | 2.9 | David Ortiz |
| Khris Davis | 602 | .247 | .326 | .516 | 127 | .269 | .289 | 6.0 | 0 | 2.9 | Jay Buhner |
| Stephen Piscotty | 590 | .257 | .331 | .451 | 113 | .194 | .300 | 5.4 | 5 | 2.6 | Jermaine Dye |
| Ramon Laureano | 503 | .241 | .314 | .410 | 98 | .169 | .320 | 4.8 | 7 | 2.4 | Rob Ducey |
| Marcus Semien | 641 | .250 | .313 | .405 | 97 | .155 | .295 | 4.7 | -1 | 2.3 | Travis Fryman |
| Franklin Barreto | 493 | .238 | .299 | .457 | 105 | .218 | .310 | 4.8 | 3 | 2.2 | Tony Batista |
| Jurickson Profar | 548 | .245 | .326 | .400 | 100 | .155 | .276 | 4.8 | -2 | 2.2 | Keith Lockhart |
| Sean Murphy | 343 | .220 | .278 | .360 | 75 | .140 | .263 | 3.5 | 5 | 0.9 | Walt McKeel |
| Nick Martini | 488 | .244 | .332 | .345 | 88 | .101 | .309 | 4.1 | 5 | 0.9 | Steve Braun |
| Dustin Fowler | 498 | .264 | .293 | .430 | 97 | .167 | .313 | 4.7 | -5 | 0.9 | Rick Manning |
| Chad Pinder | 424 | .240 | .299 | .424 | 97 | .183 | .307 | 4.4 | 2 | 0.8 | Ruben Mateo |
| Mark Canha | 430 | .236 | .309 | .429 | 101 | .192 | .278 | 4.7 | -4 | 0.5 | John Valle |
| Chris Herrmann | 242 | .200 | .299 | .329 | 74 | .129 | .268 | 3.4 | 0 | 0.4 | Erik Pappas |
| Corban Joseph | 477 | .248 | .297 | .359 | 80 | .111 | .267 | 3.7 | 0 | 0.3 | Kevin Howard |
| Eric Campbell | 381 | .237 | .336 | .342 | 89 | .105 | .289 | 4.0 | -7 | 0.2 | Bobby Scales |
| Bruce Maxwell | 298 | .218 | .282 | .328 | 68 | .111 | .289 | 3.2 | 0 | 0.1 | Dave Parrish |
| Beau Taylor | 344 | .207 | .291 | .298 | 64 | .092 | .286 | 2.9 | 1 | 0.1 | Jack Fimple |
| Josh Phegley | 220 | .215 | .277 | .365 | 76 | .150 | .266 | 3.5 | -2 | 0.1 | Yorvit Torrealba |
| Luis Barrera | 507 | .233 | .277 | .331 | 67 | .097 | .292 | 3.3 | 3 | 0.0 | Leo Garcia |
| Matthew Joyce | 337 | .216 | .321 | .383 | 94 | .167 | .255 | 4.1 | -5 | -0.1 | Stu Pederson |
| Mark Payton | 359 | .219 | .291 | .347 | 76 | .128 | .279 | 3.3 | 2 | -0.4 | Nathan Panther |
| Slade Heathcott | 311 | .210 | .275 | .331 | 67 | .121 | .306 | 3.1 | 3 | -0.5 | Paul Hertzler |
| Jonah Heim | 461 | .206 | .254 | .294 | 51 | .089 | .258 | 2.5 | 3 | -0.5 | Damon Berryhill |
| Skye Bolt | 492 | .200 | .267 | .336 | 65 | .135 | .283 | 3.0 | 0 | -0.5 | Steve Moss |
| B.J. Boyd | 503 | .237 | .280 | .311 | 64 | .075 | .288 | 3.1 | 7 | -0.6 | Corey Coles |
| Brett Vertigan | 420 | .204 | .272 | .265 | 50 | .061 | .283 | 2.5 | 11 | -0.6 | Jay Sitzman |
| Sheldon Neuse | 514 | .218 | .261 | .320 | 60 | .102 | .320 | 2.9 | 3 | -0.7 | Jeff Moronko |
| Nate Mondou | 554 | .225 | .283 | .296 | 61 | .072 | .281 | 2.8 | 1 | -0.7 | Frank Martinez |
| Tyler Ramirez | 551 | .209 | .282 | .322 | 67 | .113 | .313 | 3.1 | 4 | -0.8 | Troy O’Leary |
| Melvin Mercedes | 319 | .206 | .288 | .259 | 54 | .053 | .269 | 2.4 | -1 | -0.8 | Luis Lorenzana |
| Jorge Mateo | 535 | .206 | .250 | .332 | 59 | .126 | .291 | 2.8 | -1 | -0.9 | Mike Benjamin |
| Kevin Merrell | 346 | .224 | .259 | .273 | 48 | .049 | .298 | 2.2 | -3 | -1.3 | Mike Huyler |
| Steve Lombardozzi Jr. | 429 | .229 | .289 | .286 | 61 | .057 | .272 | 2.8 | -1 | -1.5 | Keith Smith |
| J.P. Sportman | 498 | .212 | .249 | .331 | 58 | .119 | .275 | 2.8 | -5 | -1.5 | Tom Nevers |
| Seth Brown | 540 | .203 | .261 | .326 | 61 | .123 | .296 | 2.9 | -3 | -2.1 | Craig Cooper |
| Player | T | Age | W | L | ERA | G | GS | IP | H | ER | HR | BB | SO |
|---|---|---|---|---|---|---|---|---|---|---|---|---|---|
| Blake Treinen | R | 31 | 6 | 3 | 2.66 | 65 | 0 | 71.0 | 57 | 21 | 4 | 24 | 77 |
| Jesus Luzardo | L | 21 | 9 | 6 | 3.59 | 23 | 23 | 102.7 | 99 | 41 | 10 | 31 | 94 |
| Sean Manaea | L | 27 | 8 | 7 | 4.15 | 22 | 21 | 121.3 | 123 | 56 | 15 | 32 | 87 |
| Daniel Mengden | R | 26 | 9 | 8 | 4.37 | 28 | 24 | 138.0 | 144 | 67 | 18 | 40 | 96 |
| Chris Bassitt | R | 30 | 7 | 6 | 4.12 | 25 | 18 | 107.0 | 108 | 49 | 11 | 42 | 84 |
| Mike Fiers | R | 34 | 9 | 8 | 4.29 | 27 | 26 | 142.7 | 145 | 68 | 23 | 41 | 118 |
| Lou Trivino | R | 27 | 7 | 4 | 3.36 | 66 | 1 | 72.3 | 63 | 27 | 5 | 30 | 70 |
| Frankie Montas | R | 26 | 8 | 8 | 4.41 | 31 | 22 | 118.3 | 127 | 58 | 14 | 45 | 90 |
| Jharel Cotton | R | 27 | 7 | 6 | 4.26 | 20 | 19 | 112.0 | 111 | 53 | 15 | 41 | 97 |
| Andrew Triggs | R | 30 | 5 | 4 | 3.82 | 13 | 13 | 70.7 | 68 | 30 | 7 | 21 | 62 |
| Joakim Soria | R | 35 | 4 | 2 | 3.11 | 60 | 0 | 55.0 | 48 | 19 | 4 | 17 | 60 |
| Brett Anderson | L | 31 | 6 | 6 | 4.22 | 22 | 21 | 102.3 | 116 | 48 | 11 | 26 | 64 |
| Liam Hendriks | R | 30 | 4 | 2 | 3.27 | 56 | 5 | 55.0 | 47 | 20 | 5 | 18 | 63 |
| Brian Howard | R | 24 | 8 | 9 | 4.46 | 23 | 22 | 123.0 | 134 | 61 | 17 | 38 | 91 |
| Jake Buchanan | R | 29 | 8 | 8 | 4.68 | 25 | 22 | 130.7 | 154 | 68 | 12 | 45 | 68 |
| Parker Dunshee | R | 24 | 6 | 7 | 4.64 | 25 | 21 | 120.3 | 128 | 62 | 20 | 38 | 96 |
| Marco Estrada | R | 35 | 9 | 9 | 4.75 | 26 | 26 | 142.0 | 140 | 75 | 22 | 50 | 105 |
| Ben Bracewell | R | 28 | 7 | 7 | 4.68 | 25 | 21 | 119.3 | 132 | 62 | 16 | 38 | 75 |
| A.J. Puk | L | 24 | 6 | 5 | 4.26 | 18 | 16 | 82.3 | 78 | 39 | 8 | 41 | 80 |
| Paul Blackburn | R | 25 | 6 | 6 | 4.47 | 20 | 20 | 104.7 | 115 | 52 | 12 | 29 | 59 |
| Tanner Anderson | R | 26 | 5 | 5 | 4.12 | 40 | 6 | 89.7 | 97 | 41 | 8 | 29 | 54 |
| J.B. Wendelken | R | 26 | 3 | 2 | 3.78 | 58 | 1 | 69.0 | 67 | 29 | 7 | 25 | 67 |
| Matt Milburn | R | 25 | 7 | 8 | 4.87 | 25 | 23 | 138.7 | 163 | 75 | 21 | 26 | 76 |
| Aaron Brooks | R | 29 | 7 | 7 | 4.70 | 27 | 19 | 111.0 | 128 | 58 | 17 | 30 | 79 |
| Daniel Gossett | R | 26 | 7 | 8 | 4.83 | 22 | 22 | 113.7 | 122 | 61 | 16 | 44 | 84 |
| Eric Jokisch | L | 29 | 7 | 7 | 4.72 | 24 | 20 | 124.0 | 141 | 65 | 16 | 43 | 77 |
| Fernando Rodney | R | 42 | 4 | 3 | 3.86 | 57 | 0 | 53.7 | 48 | 23 | 5 | 26 | 54 |
| Yusmeiro Petit | R | 34 | 4 | 3 | 3.94 | 59 | 0 | 75.3 | 74 | 33 | 11 | 16 | 64 |
| Xavier Altamirano | R | 24 | 8 | 9 | 4.95 | 26 | 23 | 127.3 | 148 | 70 | 18 | 42 | 72 |
| Edwin Jackson | R | 35 | 6 | 7 | 4.75 | 26 | 22 | 119.3 | 125 | 63 | 18 | 51 | 85 |
| James Naile | R | 26 | 7 | 9 | 4.98 | 24 | 23 | 128.3 | 151 | 71 | 18 | 41 | 64 |
| Kyle Lobstein | L | 29 | 6 | 7 | 4.87 | 24 | 19 | 101.7 | 107 | 55 | 13 | 44 | 72 |
| Ryan Buchter | L | 32 | 3 | 2 | 3.61 | 59 | 0 | 47.3 | 40 | 19 | 5 | 20 | 47 |
| Kyle Crockett | L | 27 | 2 | 2 | 3.88 | 51 | 0 | 48.7 | 49 | 21 | 6 | 13 | 42 |
| Ryan Dull | R | 29 | 3 | 3 | 4.00 | 54 | 0 | 54.0 | 49 | 24 | 8 | 16 | 54 |
| Grant Holmes | R | 23 | 9 | 11 | 4.92 | 26 | 21 | 124.3 | 127 | 68 | 18 | 61 | 105 |
| Jerry Blevins | L | 35 | 3 | 2 | 3.96 | 61 | 0 | 38.7 | 36 | 17 | 4 | 19 | 39 |
| Brian Schlitter | R | 33 | 4 | 3 | 4.15 | 50 | 0 | 52.0 | 54 | 24 | 2 | 26 | 30 |
| Dean Kiekhefer | L | 30 | 4 | 4 | 4.25 | 48 | 1 | 55.0 | 61 | 26 | 6 | 13 | 34 |
| Wei-Chung Wang | L | 27 | 6 | 8 | 4.97 | 31 | 19 | 114.0 | 127 | 63 | 18 | 43 | 78 |
| Raul Alcantara | R | 26 | 5 | 7 | 5.10 | 30 | 14 | 90.0 | 105 | 51 | 16 | 21 | 48 |
| Carlos Ramirez | R | 28 | 2 | 2 | 4.86 | 38 | 1 | 50.0 | 48 | 27 | 6 | 33 | 44 |
| Jarret Martin | L | 29 | 2 | 2 | 4.66 | 41 | 0 | 46.3 | 41 | 24 | 3 | 41 | 45 |
| Kyle Finnegan | R | 27 | 2 | 3 | 4.93 | 40 | 1 | 49.3 | 50 | 27 | 7 | 27 | 41 |
| Sam Bragg | R | 26 | 4 | 5 | 5.14 | 38 | 4 | 70.0 | 79 | 40 | 10 | 28 | 43 |
| Miguel Romero | R | 25 | 2 | 3 | 4.86 | 41 | 1 | 53.7 | 57 | 29 | 8 | 21 | 43 |
| John Gorman | R | 27 | 3 | 3 | 4.83 | 39 | 0 | 54.0 | 60 | 29 | 8 | 19 | 35 |
| Norge Ruiz | R | 25 | 6 | 9 | 5.31 | 23 | 22 | 118.7 | 144 | 70 | 19 | 42 | 60 |
| Parker Bridwell | R | 27 | 4 | 6 | 5.52 | 22 | 16 | 93.0 | 105 | 57 | 19 | 33 | 61 |
| Player | TBF | K/9 | BB/9 | HR/9 | BABIP | ERA+ | ERA- | FIP | WAR | No. 1 Comp |
|---|---|---|---|---|---|---|---|---|---|---|
| Blake Treinen | 291 | 9.76 | 3.04 | 0.51 | .288 | 154 | 65 | 2.81 | 2.0 | Jason Isringhausen |
| Jesus Luzardo | 437 | 8.24 | 2.72 | 0.88 | .301 | 114 | 88 | 3.67 | 1.9 | Steve Carlton |
| Sean Manaea | 516 | 6.45 | 2.37 | 1.11 | .287 | 102 | 98 | 4.26 | 1.6 | Kirk Rueter |
| Daniel Mengden | 593 | 6.26 | 2.61 | 1.17 | .291 | 97 | 103 | 4.45 | 1.6 | Charlie Corbell |
| Chris Bassitt | 470 | 7.07 | 3.53 | 0.93 | .298 | 103 | 97 | 4.29 | 1.5 | Jim Bagby |
| Mike Fiers | 610 | 7.44 | 2.59 | 1.45 | .290 | 96 | 105 | 4.60 | 1.5 | Bob Walk |
| Lou Trivino | 308 | 8.71 | 3.73 | 0.62 | .290 | 126 | 79 | 3.48 | 1.4 | Hector Carrasco |
| Frankie Montas | 524 | 6.85 | 3.42 | 1.06 | .306 | 96 | 104 | 4.46 | 1.2 | Bill Swift |
| Jharel Cotton | 485 | 7.79 | 3.29 | 1.21 | .294 | 96 | 104 | 4.39 | 1.2 | Zach Day |
| Andrew Triggs | 300 | 7.90 | 2.67 | 0.89 | .296 | 111 | 90 | 3.74 | 1.2 | Scott Erickson |
| Joakim Soria | 228 | 9.82 | 2.78 | 0.65 | .303 | 136 | 73 | 2.95 | 1.2 | Rich Gossage |
| Brett Anderson | 443 | 5.63 | 2.29 | 0.97 | .309 | 97 | 103 | 4.12 | 1.1 | Jerry Reuss |
| Liam Hendriks | 228 | 10.31 | 2.95 | 0.82 | .298 | 129 | 77 | 3.08 | 1.1 | Bert Roberge |
| Brian Howard | 540 | 6.66 | 2.78 | 1.24 | .303 | 92 | 109 | 4.59 | 1.1 | Sergio Mitre |
| Jake Buchanan | 588 | 4.68 | 3.10 | 0.83 | .312 | 90 | 111 | 4.52 | 1.0 | Joe Genewich |
| Parker Dunshee | 526 | 7.18 | 2.84 | 1.50 | .297 | 91 | 110 | 4.86 | 1.0 | Kelly Downs |
| Marco Estrada | 607 | 6.65 | 3.17 | 1.39 | .276 | 89 | 112 | 4.78 | 1.0 | Mike Moore |
| Ben Bracewell | 525 | 5.66 | 2.87 | 1.21 | .298 | 90 | 111 | 4.77 | 1.0 | Pat Ahearne |
| A.J. Puk | 364 | 8.74 | 4.48 | 0.87 | .303 | 96 | 104 | 4.11 | 0.9 | Derek Thompson |
| Paul Blackburn | 454 | 5.07 | 2.49 | 1.03 | .295 | 92 | 109 | 4.49 | 0.9 | Ron Reed |
| Tanner Anderson | 393 | 5.42 | 2.91 | 0.80 | .300 | 100 | 100 | 4.24 | 0.9 | Chad Kimsey |
| J.B. Wendelken | 298 | 8.74 | 3.26 | 0.91 | .308 | 112 | 89 | 3.79 | 0.8 | Blaine Neal |
| Matt Milburn | 601 | 4.93 | 1.69 | 1.36 | .302 | 87 | 115 | 4.76 | 0.8 | Heath Totten |
| Aaron Brooks | 488 | 6.41 | 2.43 | 1.38 | .312 | 90 | 111 | 4.69 | 0.8 | Lary Sorensen |
| Daniel Gossett | 504 | 6.65 | 3.48 | 1.27 | .299 | 88 | 114 | 4.82 | 0.7 | Jake Joseph |
| Eric Jokisch | 552 | 5.59 | 3.12 | 1.16 | .305 | 87 | 115 | 4.77 | 0.7 | Jimmy Anderson |
| Fernando Rodney | 235 | 9.06 | 4.36 | 0.84 | .295 | 110 | 91 | 4.03 | 0.7 | Roberto Hernandez |
| Yusmeiro Petit | 310 | 7.65 | 1.91 | 1.31 | .288 | 104 | 96 | 3.99 | 0.7 | Dick Hall |
| Xavier Altamirano | 569 | 5.09 | 2.97 | 1.27 | .303 | 86 | 117 | 5.03 | 0.6 | Nate Cornejo |
| Edwin Jackson | 528 | 6.41 | 3.85 | 1.36 | .288 | 86 | 116 | 5.04 | 0.6 | Jim Hearn |
| James Naile | 573 | 4.49 | 2.88 | 1.26 | .300 | 85 | 118 | 5.10 | 0.6 | Michael Macdonald |
| Kyle Lobstein | 453 | 6.37 | 3.90 | 1.15 | .295 | 87 | 115 | 4.84 | 0.6 | Jimmy Anderson |
| Ryan Buchter | 201 | 8.94 | 3.80 | 0.95 | .276 | 113 | 88 | 3.93 | 0.6 | J.C. Romero |
| Kyle Crockett | 206 | 7.77 | 2.40 | 1.11 | .301 | 109 | 92 | 3.95 | 0.5 | Mike Jeffcoat |
| Ryan Dull | 225 | 9.00 | 2.67 | 1.33 | .283 | 106 | 95 | 4.08 | 0.5 | Todd Burns |
| Grant Holmes | 559 | 7.60 | 4.42 | 1.30 | .296 | 83 | 120 | 4.98 | 0.4 | Ken Pumphrey |
| Jerry Blevins | 171 | 9.08 | 4.42 | 0.93 | .302 | 104 | 97 | 4.18 | 0.3 | Marshall Bridges |
| Brian Schlitter | 234 | 5.19 | 4.50 | 0.35 | .299 | 99 | 101 | 4.11 | 0.3 | Don McMahon |
| Dean Kiekhefer | 238 | 5.56 | 2.13 | 0.98 | .302 | 96 | 104 | 4.20 | 0.3 | John Boozer |
| Wei-Chung Wang | 507 | 6.16 | 3.39 | 1.42 | .299 | 82 | 121 | 5.07 | 0.3 | Greg Kubes |
| Raul Alcantara | 394 | 4.80 | 2.10 | 1.60 | .294 | 83 | 121 | 5.29 | 0.2 | Tim Kester |
| Carlos Ramirez | 230 | 7.92 | 5.94 | 1.08 | .292 | 87 | 115 | 5.11 | 0.0 | Hal Reniff |
| Jarret Martin | 221 | 8.74 | 7.96 | 0.58 | .295 | 88 | 114 | 4.90 | 0.0 | Arnold Earley |
| Kyle Finnegan | 223 | 7.48 | 4.93 | 1.28 | .295 | 86 | 116 | 5.10 | 0.0 | Mike Zimmerman |
| Sam Bragg | 315 | 5.53 | 3.60 | 1.29 | .300 | 82 | 122 | 5.15 | -0.1 | Chuck Crumpton |
| Miguel Romero | 238 | 7.21 | 3.52 | 1.34 | .301 | 84 | 119 | 4.83 | -0.1 | Andy Nezelek |
| John Gorman | 240 | 5.83 | 3.17 | 1.33 | .297 | 85 | 118 | 5.00 | -0.1 | Reid Santos |
| Norge Ruiz | 538 | 4.55 | 3.19 | 1.44 | .304 | 77 | 130 | 5.43 | -0.1 | Melqui Torres |
| Parker Bridwell | 414 | 5.90 | 3.19 | 1.84 | .290 | 77 | 130 | 5.69 | -0.2 | Dana Kiecker |
Disclaimer: ZiPS projections are computer-based projections of performance. Performances have not been allocated to predicted playing time in the majors — many of the players listed above are unlikely to play in the majors at all in 2019. ZiPS is projecting equivalent production — a .240 ZiPS projection may end up being .280 in AAA or .300 in AA, for example. Whether or not a player will play is one of many non-statistical factors one has to take into account when predicting the future.
Players are listed with their most recent teams, unless I have made a mistake. This is very possible, as a lot of minor-league signings go generally unreported in the offseason.
ZiPS’ projections are based on the American League having a 4.29 ERA and the National League having a 4.15 ERA.
Players who are expected to be out due to injury are still projected. More information is always better than less information, and a computer isn’t the tool that should project the injury status of, for example, a pitcher who has had Tommy John surgery.
Both hitters and pitchers are ranked by projected zWAR — which is to say, WAR values as calculated by me, Dan Szymborski, whose surname is spelled with a z. WAR values might differ slightly from those which appear in full release of ZiPS. Finally, I will advise anyone against — and might karate chop anyone guilty of — merely adding up WAR totals on a depth chart to produce projected team WAR.
Dan Szymborski is a senior writer for FanGraphs and the developer of the ZiPS projection system. He was a writer for ESPN.com from 2010-2018, a regular guest on a number of radio shows and podcasts, and a voting BBWAA member. He also maintains a terrible Twitter account at @DSzymborski.
Don’t lie. You manually adjusted Khris Davis’ hit and at bat total.
I don’t care how you weigh each of the past three years, it still averages to 0.247. Dude will hit .247 (with declining power) until he’s in his mid 40s.
Brace yourself if he ends up hitting .246 at 45, everyone. Even Julio Franco experienced a dip.
I certainly hope ZiPS is more advanced than weighting batting averages to project a batting average. There’s a lot goes into that number.