
2019 ZiPS Projections – San Francisco Giants
After having typically appeared in the hallowed pages of Baseball Think Factory, Dan Szymborski’s ZiPS projections have now been released at FanGraphs for more than half a decade. The exercise continues this offseason. Below are the projections for the San Francisco Giants.
Batters
Be very careful when scrolling down to look at the depth chart. The way these things work, the first thing you’ll see is the outfield, which is likely to remain an absolutely brutal mess, one that couldn’t even be half-solved by a Ronald Acuña/Juan Soto-esque rise to power by Heliot Ramos, one of San Francisco’s few top prospects. Let’s put it this way: ZiPS projects Rule 5 draftee Drew Ferguson to be arguably the best outfielder on the team, with two of the other top outfielders being a minor-league signing and a waiver claim from the Rangers. The good news is that most of the group actually projects above replacement-level, so there’s a weird amount of adequacy in terms of the depth, but the projections give absolutely none of the team’s current group a chance to have much of an upside.
Things get sunnier when you look at the infield, which is the primary reason the Giants are likely to still be projected above the Padres for one last run (though probably just for one, unless the Padres are notably unlucky or incompetent). ZiPS essentially projects improvement for all of the team’s infield starters, kind of a rarity given the generally justifiable grumpy conservativeness to which projections systems are prone. The quality of the infield lends itself well to the argument that the Giants probably ought to have won more games last year. Not enough to be a playoff team, mind you, but at least enough to tone down the bleakness.
The worrisome thing about the offense is that most of the highlight players are at ages where their downsides can still hit like a ton of bricks and fast, and there’s no counterbalancing breakout potential. To the team’s credit, they’ve given every indication they realize that the outfield is bit of a tire fire. The Giants were in on all of the Marlins outfielders last winter, brought in Andrew McCutchen for 2018 (before trading him to the Yankees), and are now courting Bryce Harper. If any team is able to convince Harper to sign a shorter-term contract, San Francisco seems like a possibility; a superstar season from Harper could get the team into plausible contention, given their outfield weakness. And time is of the essence — if the infield starters don’t bounce back, this team is absolute toast.
I am still confused as to the baseball purpose of Pablo Sandoval remaining on the roster. Did someone in the organization finish last in their fantasy baseball league, and this is their punishment?
Pitchers
Johnny Cueto could theoretically return in September, but I think the smart money is still on him not making an appearance until 2020. Which, in addition to being unfortunate for Cueto, is rather bad timing for the Giants, who are less likely to be playing meaningful games in 2020 than this year.
Madison Bumgarner only gets a two-WAR projection, but that’s over just 147 innings, due largely to his attendance over the last two seasons, when he’s missed time due to freak injuries, one caused by something somewhat unusual (a dirt bike), the other by something somewhat mundane (a line drive). Since no elbow or shoulders were involved, I’m more optimistic about Bumgarner getting back to the 200 inning range than the projections are, which would boost his WAR to around three. ZiPS projects Dereck Rodriguez to be roughly league-average, which will be disappointing to Giants fans after a season in which Rodriguez was one of the team’s few highlights, but he has a very short record track record and a low K rate, so ZiPS isn’t putting him on the Kyle Hendricks pile yet. He’s certainly unlikely to repeat the 0.68 HR/9, even playing in Oracle Park.
The bullpen isn’t flashy, but the front-end is solidly above-average, and the team’s depth projects as more than adequate for its needs. San Francisco has shown an ability to turn random pieces into good relievers, and has a solid record with reclamation projects, such as Sam Dyson.
Bench and Prospects
After Joey Bart and Heliot Ramos, both likely to get official projections next year, the cupboard gets bare quickly. ZiPS does project Shaun Anderson to be a decent No. 3 starter for a time in his prime, and it has a long-term fascination with Conner Menez, but there’s just not much there there. Honestly, if the Giants had better prospects after their top two guys, I’d expect them to already have been traded for a starting pitcher. Most teams have a position player or two who ZiPS thinks projects better than the scouting reports indicate, but I’m just not seeing anybody here. Despite playing in the Pacific Coast League, Triple-A Sacramento only had one player who hit 15 homers (Chris Shaw).
One pedantic note for 2019: for the WAR graphic, I’m using FanGraphs’ depth chart playing time, not the playing time ZiPS spits out, so there will be occasional differences in WAR totals.
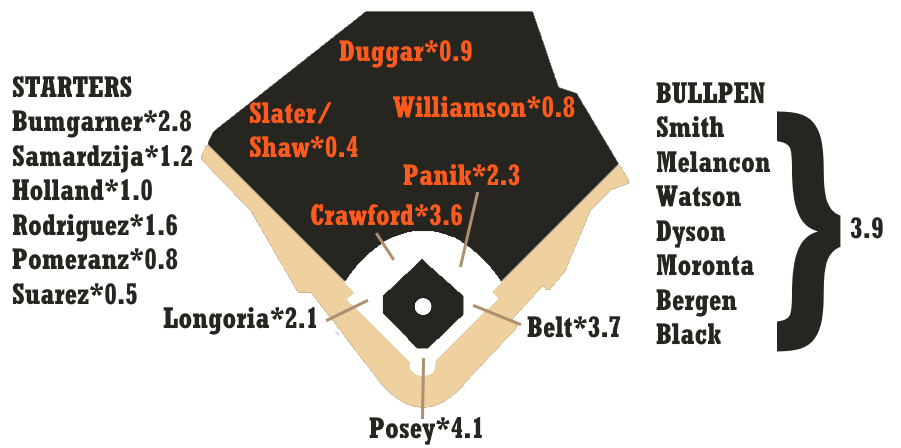
Ballpark graphic courtesy Eephus League. Depth charts constructed by way of those listed here at site.
| Player | B | Age | PO | G | AB | R | H | 2B | 3B | HR | RBI | BB | SO | SB | CS |
|---|---|---|---|---|---|---|---|---|---|---|---|---|---|---|---|
| Buster Posey | R | 32 | C | 115 | 423 | 53 | 122 | 24 | 1 | 8 | 53 | 48 | 56 | 4 | 1 |
| Brandon Crawford | L | 32 | SS | 143 | 507 | 59 | 129 | 29 | 4 | 14 | 67 | 46 | 115 | 4 | 4 |
| Brandon Belt | L | 31 | 1B | 117 | 416 | 57 | 104 | 25 | 3 | 15 | 53 | 62 | 122 | 4 | 1 |
| Joe Panik | L | 28 | 2B | 122 | 444 | 57 | 122 | 24 | 4 | 7 | 44 | 40 | 47 | 4 | 1 |
| Evan Longoria | R | 33 | 3B | 136 | 528 | 58 | 136 | 31 | 3 | 16 | 65 | 34 | 105 | 3 | 1 |
| Alen Hanson | B | 26 | 2B | 132 | 398 | 51 | 99 | 18 | 8 | 9 | 42 | 21 | 88 | 17 | 7 |
| Breyvic Valera | B | 27 | 2B | 126 | 424 | 50 | 113 | 16 | 4 | 5 | 38 | 37 | 48 | 7 | 7 |
| Anthony Garcia | R | 27 | LF | 126 | 449 | 60 | 111 | 25 | 1 | 16 | 56 | 43 | 108 | 3 | 2 |
| Drew Ferguson | R | 26 | CF | 92 | 348 | 45 | 85 | 18 | 2 | 6 | 31 | 39 | 101 | 9 | 6 |
| Austin Slater | R | 26 | RF | 118 | 411 | 48 | 105 | 22 | 2 | 8 | 48 | 34 | 113 | 9 | 4 |
| Stephen Vogt | L | 34 | C | 116 | 373 | 40 | 92 | 20 | 2 | 12 | 47 | 34 | 75 | 0 | 1 |
| John Andreoli | R | 29 | LF | 115 | 420 | 52 | 94 | 19 | 4 | 6 | 35 | 51 | 130 | 20 | 7 |
| Steven Duggar | L | 25 | CF | 117 | 467 | 55 | 116 | 26 | 4 | 6 | 42 | 46 | 139 | 13 | 6 |
| Brock Stassi | L | 29 | 1B | 89 | 286 | 35 | 68 | 16 | 1 | 6 | 30 | 37 | 67 | 0 | 1 |
| Mac Williamson | R | 28 | LF | 101 | 348 | 46 | 81 | 17 | 1 | 14 | 43 | 30 | 103 | 3 | 2 |
| Abiatal Avelino | R | 24 | SS | 132 | 489 | 53 | 119 | 20 | 6 | 9 | 43 | 26 | 108 | 16 | 6 |
| Henry Ramos | B | 27 | CF | 99 | 347 | 39 | 91 | 17 | 3 | 7 | 35 | 24 | 75 | 6 | 4 |
| Donovan Solano | R | 31 | SS | 110 | 397 | 39 | 102 | 22 | 1 | 4 | 33 | 16 | 61 | 2 | 1 |
| Jerry Sands | R | 31 | 1B | 93 | 307 | 36 | 71 | 16 | 1 | 10 | 36 | 33 | 88 | 2 | 1 |
| Ryan Howard | R | 24 | SS | 120 | 465 | 47 | 118 | 23 | 3 | 4 | 41 | 27 | 77 | 6 | 4 |
| Cameron Rupp | R | 30 | C | 90 | 311 | 31 | 67 | 15 | 1 | 10 | 34 | 29 | 110 | 0 | 0 |
| Aramis Garcia | R | 26 | C | 101 | 386 | 40 | 84 | 17 | 1 | 11 | 41 | 22 | 128 | 0 | 1 |
| Cesar Puello | R | 28 | LF | 90 | 315 | 42 | 78 | 14 | 2 | 6 | 30 | 29 | 85 | 8 | 4 |
| Levi Michael | B | 28 | SS | 103 | 375 | 44 | 85 | 16 | 3 | 6 | 30 | 26 | 114 | 9 | 4 |
| Ryder Jones | L | 25 | 3B | 124 | 458 | 50 | 108 | 24 | 3 | 11 | 47 | 25 | 117 | 3 | 2 |
| Mike Gerber | L | 26 | CF | 108 | 411 | 46 | 89 | 19 | 3 | 12 | 44 | 29 | 148 | 5 | 3 |
| Rene Rivera | R | 35 | C | 61 | 173 | 14 | 37 | 7 | 0 | 5 | 21 | 10 | 58 | 0 | 0 |
| Jin-De Jhang | L | 26 | C | 62 | 230 | 22 | 55 | 10 | 1 | 2 | 18 | 13 | 34 | 1 | 1 |
| Ali Castillo | R | 30 | 3B | 107 | 355 | 33 | 86 | 14 | 2 | 2 | 26 | 16 | 47 | 7 | 7 |
| Ronnie Freeman | R | 28 | C | 71 | 231 | 22 | 52 | 9 | 1 | 3 | 17 | 14 | 57 | 0 | 0 |
| Trevor Brown | R | 27 | C | 58 | 179 | 16 | 39 | 8 | 0 | 2 | 13 | 13 | 40 | 2 | 0 |
| Caleb Gindl | L | 30 | LF | 84 | 266 | 27 | 60 | 12 | 2 | 4 | 24 | 22 | 64 | 1 | 2 |
| Miguel Gomez | B | 26 | 2B | 118 | 437 | 43 | 112 | 22 | 4 | 8 | 45 | 10 | 73 | 1 | 0 |
| C.J. Hinojosa | R | 24 | SS | 102 | 395 | 40 | 92 | 18 | 2 | 4 | 31 | 29 | 68 | 6 | 4 |
| Eury Perez | R | 29 | RF | 73 | 219 | 23 | 57 | 9 | 3 | 1 | 19 | 11 | 38 | 13 | 5 |
| Pablo Sandoval | B | 32 | 3B | 92 | 293 | 28 | 70 | 13 | 1 | 8 | 35 | 20 | 60 | 0 | 0 |
| Zach Green | R | 25 | 1B | 106 | 385 | 43 | 80 | 22 | 2 | 12 | 46 | 26 | 155 | 1 | 1 |
| Chris Shaw | L | 25 | LF | 131 | 495 | 55 | 113 | 27 | 2 | 19 | 62 | 30 | 175 | 1 | 0 |
| Peter Maris | L | 25 | 2B | 87 | 317 | 35 | 72 | 12 | 3 | 6 | 28 | 27 | 72 | 5 | 5 |
| Hamlet Marte | R | 25 | C | 72 | 265 | 27 | 56 | 12 | 1 | 6 | 23 | 17 | 95 | 2 | 1 |
| Luigi Rodriguez | B | 26 | RF | 100 | 362 | 39 | 78 | 14 | 3 | 11 | 37 | 23 | 138 | 10 | 8 |
| Myles Schroder | R | 31 | 1B | 93 | 322 | 30 | 67 | 13 | 2 | 6 | 27 | 14 | 97 | 5 | 3 |
| Heath Quinn | R | 24 | LF | 92 | 350 | 37 | 75 | 15 | 0 | 8 | 32 | 28 | 126 | 3 | 1 |
| Matt Winn | R | 26 | C | 93 | 326 | 31 | 54 | 13 | 1 | 8 | 28 | 27 | 163 | 0 | 0 |
| Sandro Fabian | R | 21 | RF | 120 | 455 | 43 | 91 | 20 | 1 | 10 | 41 | 18 | 138 | 2 | 3 |
| Josh Rutledge | R | 30 | 2B | 57 | 170 | 16 | 34 | 6 | 1 | 2 | 11 | 11 | 57 | 1 | 1 |
| Jalen Miller | R | 22 | 2B | 130 | 524 | 53 | 115 | 26 | 2 | 8 | 46 | 25 | 145 | 8 | 5 |
| Player | PA | BA | OBP | SLG | OPS+ | ISO | BABIP | RC/27 | Def | WAR | No. 1 Comp |
|---|---|---|---|---|---|---|---|---|---|---|---|
| Buster Posey | 479 | .288 | .363 | .407 | 109 | .118 | .318 | 5.7 | 7 | 3.8 | Earl Battey |
| Brandon Crawford | 566 | .254 | .320 | .410 | 97 | .156 | .304 | 4.7 | 9 | 3.2 | Jay Bell |
| Brandon Belt | 484 | .250 | .351 | .433 | 112 | .183 | .319 | 5.5 | 8 | 2.8 | Leon Durham |
| Joe Panik | 495 | .275 | .337 | .394 | 98 | .119 | .295 | 5.0 | 0 | 2.0 | Jeff Treadway |
| Evan Longoria | 574 | .258 | .305 | .419 | 94 | .161 | .295 | 4.7 | 1 | 1.9 | Tim Wallach |
| Alen Hanson | 427 | .249 | .286 | .402 | 84 | .153 | .299 | 4.2 | 3 | 1.3 | Luis Rivas |
| Breyvic Valera | 470 | .267 | .324 | .358 | 86 | .092 | .291 | 4.1 | 2 | 1.2 | Wallace Johnson |
| Anthony Garcia | 506 | .247 | .323 | .414 | 99 | .167 | .292 | 4.8 | -2 | 1.1 | Kurt Bierek |
| Drew Ferguson | 396 | .244 | .329 | .359 | 87 | .115 | .328 | 4.1 | -1 | 1.0 | Larry Bigbie |
| Austin Slater | 455 | .255 | .319 | .377 | 89 | .122 | .334 | 4.4 | 1 | 0.9 | Ruben Mateo |
| Stephen Vogt | 413 | .247 | .310 | .408 | 93 | .161 | .280 | 4.5 | -8 | 0.8 | Bill Freehan |
| John Andreoli | 478 | .224 | .311 | .331 | 75 | .107 | .310 | 3.7 | 7 | 0.8 | Reggie Williams |
| Steven Duggar | 517 | .248 | .317 | .360 | 84 | .111 | .342 | 4.1 | -5 | 0.7 | Rich Becker |
| Brock Stassi | 328 | .238 | .326 | .364 | 88 | .126 | .291 | 4.1 | 3 | 0.7 | Ray Giannelli |
| Mac Williamson | 386 | .233 | .303 | .408 | 91 | .175 | .290 | 4.3 | 0 | 0.7 | Scott Bryant |
| Abiatal Avelino | 523 | .243 | .285 | .364 | 75 | .121 | .296 | 3.8 | -3 | 0.6 | Hector Luna |
| Henry Ramos | 378 | .262 | .309 | .389 | 88 | .127 | .317 | 4.3 | -4 | 0.5 | Andrew Locke |
| Donovan Solano | 421 | .257 | .288 | .348 | 72 | .091 | .295 | 3.6 | -1 | 0.4 | Alvaro Espinoza |
| Jerry Sands | 344 | .231 | .308 | .388 | 88 | .156 | .292 | 4.2 | 1 | 0.4 | Jarrod Patterson |
| Ryan Howard | 503 | .254 | .298 | .342 | 74 | .088 | .297 | 3.6 | -4 | 0.4 | Dean DeCillis |
| Cameron Rupp | 344 | .215 | .285 | .367 | 76 | .151 | .298 | 3.6 | -4 | 0.4 | Chad Moeller |
| Aramis Garcia | 413 | .218 | .264 | .352 | 66 | .135 | .296 | 3.2 | 1 | 0.4 | Alvin Colina |
| Cesar Puello | 360 | .248 | .329 | .362 | 88 | .114 | .321 | 4.3 | -2 | 0.3 | Domingo Michel |
| Levi Michael | 416 | .227 | .295 | .333 | 71 | .107 | .310 | 3.5 | -3 | 0.3 | Doug Baker |
| Ryder Jones | 493 | .236 | .282 | .373 | 76 | .138 | .294 | 3.7 | -2 | 0.3 | Brennan King |
| Mike Gerber | 447 | .217 | .271 | .365 | 71 | .148 | .307 | 3.4 | 0 | 0.2 | Justin Bowles |
| Rene Rivera | 188 | .214 | .267 | .341 | 64 | .127 | .291 | 3.1 | 0 | 0.1 | Shawn Wooten |
| Jin-De Jhang | 247 | .239 | .280 | .317 | 62 | .078 | .273 | 3.1 | 0 | 0.1 | Dave Miley |
| Ali Castillo | 379 | .242 | .276 | .310 | 59 | .068 | .275 | 2.8 | 7 | 0.1 | Robert Eenhoorn |
| Ronnie Freeman | 249 | .225 | .270 | .312 | 58 | .087 | .287 | 2.9 | 1 | 0.0 | Kyle Geiger |
| Trevor Brown | 195 | .218 | .278 | .296 | 57 | .078 | .270 | 3.0 | -1 | -0.1 | David Duff |
| Caleb Gindl | 292 | .226 | .285 | .331 | 67 | .105 | .283 | 3.2 | 2 | -0.2 | Jeff Wetherby |
| Miguel Gomez | 451 | .256 | .273 | .380 | 75 | .124 | .292 | 3.8 | -6 | -0.2 | Donnie Hill |
| C.J. Hinojosa | 432 | .233 | .287 | .319 | 65 | .086 | .272 | 3.2 | -4 | -0.2 | Keoni DeRenne |
| Eury Perez | 239 | .260 | .303 | .342 | 75 | .082 | .311 | 3.9 | -2 | -0.3 | Jason Bourgeois |
| Pablo Sandoval | 319 | .239 | .292 | .372 | 79 | .133 | .276 | 3.8 | -7 | -0.3 | Geoff Blum |
| Zach Green | 422 | .208 | .270 | .369 | 72 | .161 | .312 | 3.4 | 1 | -0.4 | Ryan Mulhern |
| Chris Shaw | 533 | .228 | .278 | .406 | 83 | .178 | .312 | 4.0 | -7 | -0.4 | Glenn Davis |
| Peter Maris | 351 | .227 | .287 | .341 | 70 | .114 | .276 | 3.3 | -5 | -0.4 | Chris Lombardozzi |
| Hamlet Marte | 285 | .211 | .257 | .332 | 59 | .121 | .305 | 2.9 | -6 | -0.7 | David Ross |
| Luigi Rodriguez | 391 | .215 | .264 | .362 | 68 | .146 | .315 | 3.1 | 0 | -0.7 | Tony Barron |
| Myles Schroder | 348 | .208 | .255 | .317 | 54 | .109 | .279 | 2.7 | 5 | -0.8 | Marc Sagmoen |
| Heath Quinn | 384 | .214 | .279 | .326 | 64 | .111 | .310 | 3.1 | -2 | -0.8 | Lance Hallberg |
| Matt Winn | 357 | .166 | .233 | .285 | 40 | .120 | .297 | 2.2 | -1 | -0.9 | Steve Lomasney |
| Sandro Fabian | 485 | .200 | .238 | .314 | 49 | .114 | .264 | 2.4 | 10 | -0.9 | John Lindsey |
| Josh Rutledge | 184 | .200 | .255 | .282 | 46 | .082 | .288 | 2.4 | -4 | -0.9 | Paul Hoover |
| Jalen Miller | 559 | .219 | .261 | .323 | 58 | .103 | .288 | 2.9 | -3 | -1.0 | Chris Patten |
| Player | T | Age | W | L | ERA | G | GS | IP | H | ER | HR | BB | SO |
|---|---|---|---|---|---|---|---|---|---|---|---|---|---|
| Madison Bumgarner | L | 29 | 8 | 8 | 3.86 | 24 | 24 | 147.0 | 139 | 63 | 21 | 37 | 135 |
| Johnny Cueto | R | 33 | 7 | 7 | 3.92 | 22 | 22 | 133.0 | 131 | 58 | 17 | 35 | 110 |
| Dereck Rodriguez | R | 27 | 7 | 7 | 4.19 | 27 | 26 | 146.0 | 150 | 68 | 18 | 45 | 114 |
| Drew Pomeranz | L | 30 | 7 | 8 | 4.42 | 28 | 21 | 116.0 | 111 | 57 | 14 | 57 | 107 |
| Derek Holland | L | 32 | 7 | 8 | 4.54 | 29 | 25 | 134.7 | 135 | 68 | 19 | 56 | 118 |
| Jeff Samardzija | R | 34 | 7 | 8 | 4.59 | 22 | 22 | 131.3 | 134 | 67 | 19 | 35 | 109 |
| Will Smith | L | 29 | 3 | 2 | 2.94 | 57 | 0 | 52.0 | 41 | 17 | 5 | 17 | 69 |
| Tony Watson | L | 34 | 5 | 4 | 3.17 | 66 | 0 | 59.7 | 54 | 21 | 6 | 15 | 57 |
| Andrew Suarez | L | 26 | 9 | 11 | 4.60 | 30 | 29 | 162.3 | 176 | 83 | 24 | 47 | 130 |
| Conner Menez | L | 24 | 8 | 10 | 4.52 | 27 | 27 | 125.3 | 123 | 63 | 14 | 74 | 115 |
| Carlos Navas | R | 26 | 4 | 4 | 3.93 | 43 | 1 | 68.7 | 66 | 30 | 7 | 24 | 63 |
| Reyes Moronta | R | 26 | 4 | 3 | 3.39 | 65 | 0 | 58.3 | 44 | 22 | 4 | 36 | 74 |
| Mark Melancon | R | 34 | 2 | 2 | 3.22 | 47 | 0 | 44.7 | 43 | 16 | 3 | 11 | 35 |
| Ty Blach | L | 28 | 7 | 9 | 4.55 | 37 | 18 | 128.7 | 143 | 65 | 14 | 36 | 73 |
| Chris Stratton | R | 28 | 8 | 11 | 4.73 | 28 | 26 | 144.7 | 155 | 76 | 18 | 57 | 111 |
| Keyvius Sampson | R | 28 | 8 | 10 | 4.69 | 26 | 19 | 126.7 | 106 | 66 | 15 | 76 | 129 |
| Derek Law | R | 28 | 3 | 3 | 3.67 | 49 | 0 | 56.3 | 54 | 23 | 4 | 20 | 49 |
| Sam Dyson | R | 31 | 4 | 4 | 3.84 | 64 | 0 | 58.7 | 58 | 25 | 5 | 20 | 44 |
| Shaun Anderson | R | 24 | 6 | 9 | 4.86 | 25 | 24 | 129.7 | 142 | 70 | 20 | 41 | 97 |
| Logan Webb | R | 22 | 3 | 4 | 4.81 | 27 | 24 | 88.0 | 91 | 47 | 11 | 42 | 70 |
| Chase Johnson | R | 27 | 3 | 4 | 4.74 | 19 | 17 | 62.7 | 68 | 33 | 6 | 29 | 40 |
| Dillon McNamara | R | 27 | 3 | 3 | 4.21 | 39 | 1 | 51.3 | 51 | 24 | 5 | 23 | 44 |
| Ray Black | R | 29 | 3 | 3 | 3.94 | 56 | 0 | 48.0 | 33 | 21 | 5 | 34 | 77 |
| Tyler Rogers | R | 28 | 3 | 3 | 4.02 | 52 | 0 | 65.0 | 65 | 29 | 4 | 28 | 47 |
| Sam Coonrod | R | 26 | 5 | 7 | 4.89 | 22 | 18 | 95.7 | 99 | 52 | 12 | 49 | 79 |
| Pat Venditte | R | 34 | 3 | 3 | 4.44 | 38 | 0 | 48.7 | 46 | 24 | 6 | 24 | 45 |
| Jake Barrett | R | 27 | 2 | 3 | 4.03 | 53 | 0 | 58.0 | 52 | 26 | 6 | 31 | 62 |
| Sam Moll | L | 27 | 2 | 2 | 4.02 | 40 | 0 | 47.0 | 48 | 21 | 4 | 18 | 37 |
| Travis Bergen | L | 25 | 3 | 3 | 4.13 | 30 | 0 | 28.3 | 26 | 13 | 3 | 13 | 27 |
| Steven Okert | L | 27 | 2 | 2 | 4.10 | 52 | 0 | 48.3 | 46 | 22 | 7 | 16 | 49 |
| Tyler Herb | R | 27 | 5 | 8 | 5.17 | 21 | 21 | 108.0 | 120 | 62 | 14 | 49 | 73 |
| Manny Parra | L | 36 | 2 | 2 | 4.14 | 39 | 0 | 45.7 | 46 | 21 | 3 | 23 | 35 |
| Jamie Callahan | R | 24 | 3 | 3 | 4.50 | 29 | 1 | 40.0 | 41 | 20 | 4 | 19 | 32 |
| Sam Wolff | R | 28 | 2 | 3 | 4.37 | 29 | 0 | 35.0 | 32 | 17 | 4 | 21 | 39 |
| Pierce Johnson | R | 28 | 3 | 3 | 4.52 | 45 | 3 | 63.7 | 60 | 32 | 7 | 35 | 64 |
| Enderson Franco | R | 26 | 6 | 9 | 5.22 | 26 | 21 | 119.0 | 135 | 69 | 17 | 52 | 86 |
| Jordan Schafer | L | 32 | 1 | 1 | 4.59 | 27 | 1 | 33.3 | 32 | 17 | 4 | 17 | 33 |
| Brandon Beachy | R | 32 | 1 | 1 | 5.79 | 6 | 6 | 23.3 | 26 | 15 | 4 | 14 | 15 |
| Pat Ruotolo | R | 24 | 2 | 3 | 4.89 | 41 | 0 | 42.3 | 40 | 23 | 8 | 22 | 51 |
| Josh Osich | L | 30 | 1 | 1 | 4.71 | 54 | 1 | 57.3 | 59 | 30 | 7 | 28 | 47 |
| Casey Kelly | R | 29 | 7 | 11 | 5.22 | 28 | 23 | 131.0 | 151 | 76 | 21 | 45 | 89 |
| Joan Gregorio | R | 27 | 4 | 6 | 5.35 | 20 | 15 | 79.0 | 83 | 47 | 14 | 39 | 71 |
| Melvin Adon | R | 25 | 4 | 6 | 5.40 | 19 | 16 | 80.0 | 89 | 48 | 9 | 51 | 55 |
| Carlos Diaz | L | 25 | 2 | 3 | 4.80 | 40 | 0 | 50.7 | 50 | 27 | 4 | 34 | 40 |
| Kieran Lovegrove | R | 24 | 2 | 3 | 4.91 | 42 | 0 | 55.0 | 54 | 30 | 5 | 39 | 47 |
| Garrett Williams | L | 24 | 5 | 8 | 5.30 | 31 | 16 | 88.3 | 92 | 52 | 8 | 67 | 66 |
| Jose Valdez | R | 29 | 3 | 4 | 5.27 | 45 | 0 | 54.7 | 54 | 32 | 8 | 36 | 52 |
| Taylor Hill | R | 30 | 5 | 9 | 5.48 | 23 | 19 | 106.7 | 130 | 65 | 18 | 31 | 53 |
| Tyler Beede | R | 26 | 5 | 9 | 5.55 | 30 | 17 | 99.0 | 108 | 61 | 15 | 60 | 83 |
| Jordan Johnson | R | 25 | 6 | 11 | 5.62 | 24 | 23 | 115.3 | 128 | 72 | 19 | 63 | 83 |
| Ryan Halstead | R | 27 | 2 | 4 | 5.64 | 38 | 0 | 52.7 | 60 | 33 | 12 | 16 | 42 |
| Michael Connolly | R | 27 | 4 | 8 | 5.85 | 25 | 14 | 92.3 | 112 | 60 | 17 | 37 | 53 |
| Player | TBF | K/9 | BB/9 | HR/9 | BABIP | ERA+ | ERA- | FIP | WAR | No. 1 Comp |
|---|---|---|---|---|---|---|---|---|---|---|
| Madison Bumgarner | 612 | 8.27 | 2.27 | 1.29 | .285 | 102 | 98 | 4.03 | 2.0 | Bud Black |
| Johnny Cueto | 561 | 7.44 | 2.37 | 1.15 | .290 | 100 | 100 | 4.08 | 1.7 | Bob Forsch |
| Dereck Rodriguez | 630 | 7.03 | 2.77 | 1.11 | .297 | 97 | 103 | 4.28 | 1.7 | Steve Fireovid |
| Drew Pomeranz | 511 | 8.30 | 4.42 | 1.09 | .294 | 92 | 109 | 4.43 | 1.0 | Rich Robertson |
| Derek Holland | 590 | 7.89 | 3.74 | 1.27 | .296 | 90 | 112 | 4.59 | 1.0 | Shawn Estes |
| Jeff Samardzija | 557 | 7.47 | 2.40 | 1.30 | .295 | 89 | 113 | 4.26 | 0.9 | Bill Gullickson |
| Will Smith | 212 | 11.94 | 2.94 | 0.87 | .300 | 134 | 75 | 2.78 | 0.9 | Ken Dayley |
| Tony Watson | 247 | 8.60 | 2.26 | 0.91 | .289 | 124 | 80 | 3.45 | 0.8 | Tony Castillo |
| Andrew Suarez | 705 | 7.21 | 2.61 | 1.33 | .306 | 86 | 117 | 4.47 | 0.8 | Bobby Livingston |
| Conner Menez | 571 | 8.26 | 5.31 | 1.01 | .302 | 87 | 115 | 4.71 | 0.8 | Trevor Wilson |
| Carlos Navas | 295 | 8.26 | 3.15 | 0.92 | .299 | 103 | 97 | 3.86 | 0.6 | Daryl Irvine |
| Reyes Moronta | 253 | 11.42 | 5.55 | 0.62 | .290 | 116 | 86 | 3.41 | 0.6 | Brian Wilson |
| Mark Melancon | 186 | 7.05 | 2.22 | 0.60 | .294 | 122 | 82 | 3.26 | 0.6 | Dick Coffman |
| Ty Blach | 557 | 5.11 | 2.52 | 0.98 | .299 | 87 | 115 | 4.34 | 0.5 | Mike Caldwell |
| Chris Stratton | 640 | 6.91 | 3.55 | 1.12 | .305 | 83 | 120 | 4.52 | 0.5 | Kevin Hodges |
| Keyvius Sampson | 558 | 9.17 | 5.40 | 1.07 | .273 | 84 | 119 | 4.57 | 0.4 | Victor Zambrano |
| Derek Law | 241 | 7.83 | 3.20 | 0.64 | .301 | 107 | 93 | 3.51 | 0.3 | Mark Lee |
| Sam Dyson | 253 | 6.75 | 3.07 | 0.77 | .293 | 103 | 97 | 3.93 | 0.3 | Jack Aker |
| Shaun Anderson | 569 | 6.73 | 2.85 | 1.39 | .302 | 81 | 123 | 4.77 | 0.3 | Mike Lincoln |
| Logan Webb | 396 | 7.16 | 4.30 | 1.13 | .300 | 82 | 122 | 4.82 | 0.2 | Jesus Silva |
| Chase Johnson | 284 | 5.74 | 4.16 | 0.86 | .302 | 83 | 120 | 4.70 | 0.2 | Sean White |
| Dillon McNamara | 227 | 7.71 | 4.03 | 0.88 | .303 | 97 | 103 | 4.22 | 0.1 | Casey Daigle |
| Ray Black | 211 | 14.44 | 6.38 | 0.94 | .301 | 100 | 100 | 3.55 | 0.1 | Dwayne Henry |
| Tyler Rogers | 287 | 6.51 | 3.88 | 0.55 | .299 | 98 | 102 | 3.98 | 0.1 | Bruce Dal Canton |
| Sam Coonrod | 434 | 7.43 | 4.61 | 1.13 | .302 | 81 | 124 | 4.85 | 0.1 | Allen Edwards |
| Pat Venditte | 216 | 8.32 | 4.44 | 1.11 | .290 | 92 | 109 | 4.57 | 0.1 | Jim Czajkowski |
| Jake Barrett | 256 | 9.62 | 4.81 | 0.93 | .299 | 98 | 102 | 4.12 | 0.1 | George Smith |
| Sam Moll | 205 | 7.09 | 3.45 | 0.77 | .306 | 98 | 102 | 3.96 | 0.1 | Jim Crawford |
| Travis Bergen | 124 | 8.58 | 4.13 | 0.95 | .291 | 99 | 101 | 4.21 | 0.1 | Mike Venafro |
| Steven Okert | 207 | 9.12 | 2.98 | 1.30 | .295 | 96 | 104 | 4.18 | 0.1 | Javier Lopez |
| Tyler Herb | 490 | 6.08 | 4.08 | 1.17 | .305 | 79 | 127 | 5.01 | 0.0 | Ben Fritz |
| Manny Parra | 205 | 6.90 | 4.53 | 0.59 | .303 | 95 | 105 | 4.11 | 0.0 | Joe Gibbon |
| Jamie Callahan | 179 | 7.20 | 4.28 | 0.90 | .303 | 90 | 111 | 4.43 | 0.0 | Rick Greene |
| Sam Wolff | 158 | 10.03 | 5.40 | 1.03 | .304 | 93 | 107 | 4.38 | 0.0 | Gabriel Dehoyos |
| Pierce Johnson | 285 | 9.05 | 4.95 | 0.99 | .301 | 87 | 115 | 4.36 | -0.1 | Ryan Henderson |
| Enderson Franco | 542 | 6.50 | 3.93 | 1.29 | .311 | 78 | 128 | 5.05 | -0.1 | Rick Sutcliffe |
| Jordan Schafer | 148 | 8.91 | 4.59 | 1.08 | .301 | 86 | 116 | 4.35 | -0.1 | C.J. Nitkowski |
| Brandon Beachy | 109 | 5.79 | 5.40 | 1.54 | .293 | 68 | 147 | 6.02 | -0.2 | Jim Abbott |
| Pat Ruotolo | 189 | 10.84 | 4.68 | 1.70 | .305 | 83 | 120 | 4.97 | -0.3 | Lariel Gonzalez |
| Josh Osich | 258 | 7.38 | 4.40 | 1.10 | .301 | 84 | 119 | 4.72 | -0.3 | John Curtis |
| Casey Kelly | 586 | 6.11 | 3.09 | 1.44 | .307 | 76 | 132 | 5.07 | -0.3 | Jim Magrane |
| Joan Gregorio | 357 | 8.09 | 4.44 | 1.59 | .301 | 74 | 136 | 5.29 | -0.3 | Carl Dale |
| Melvin Adon | 379 | 6.19 | 5.74 | 1.01 | .309 | 73 | 137 | 5.34 | -0.4 | Rich Dorman |
| Carlos Diaz | 235 | 7.11 | 6.04 | 0.71 | .299 | 82 | 122 | 4.79 | -0.4 | Brian Adams |
| Kieran Lovegrove | 257 | 7.69 | 6.38 | 0.82 | .301 | 83 | 121 | 4.91 | -0.4 | Lloyd Allen |
| Garrett Williams | 423 | 6.72 | 6.83 | 0.82 | .304 | 74 | 134 | 5.31 | -0.4 | Ken Chase |
| Jose Valdez | 253 | 8.56 | 5.93 | 1.32 | .299 | 77 | 129 | 5.29 | -0.6 | Marty McLeary |
| Taylor Hill | 478 | 4.47 | 2.62 | 1.52 | .303 | 72 | 139 | 5.39 | -0.6 | Allen Davis |
| Tyler Beede | 464 | 7.55 | 5.45 | 1.36 | .310 | 71 | 141 | 5.44 | -0.7 | Julien Tucker |
| Jordan Johnson | 535 | 6.48 | 4.92 | 1.48 | .300 | 70 | 143 | 5.67 | -0.8 | Jim Hunter |
| Ryan Halstead | 233 | 7.18 | 2.73 | 2.05 | .300 | 70 | 143 | 5.60 | -0.9 | Dwayne Pollok |
| Michael Connolly | 424 | 5.17 | 3.61 | 1.66 | .305 | 67 | 148 | 5.79 | -1.0 | Scott Shoemaker |
Disclaimer: ZiPS projections are computer-based projections of performance. Performances have not been allocated to predicted playing time in the majors — many of the players listed above are unlikely to play in the majors at all in 2019. ZiPS is projecting equivalent production — a .240 ZiPS projection may end up being .280 in AAA or .300 in AA, for example. Whether or not a player will play is one of many non-statistical factors one has to take into account when predicting the future.
Players are listed with their most recent teams, unless I have made a mistake. This is very possible, as a lot of minor-league signings go generally unreported in the offseason.
ZiPS’ projections are based on the American League having a 4.29 ERA and the National League having a 4.15 ERA.
Players who are expected to be out due to injury are still projected. More information is always better than less information, and a computer isn’t the tool that should project the injury status of, for example, a pitcher who has had Tommy John surgery.
Both hitters and pitchers are ranked by projected zWAR — which is to say, WAR values as calculated by me, Dan Szymborski, whose surname is spelled with a z. WAR values might differ slightly from those which appear in full release of ZiPS. Finally, I will advise anyone against — and might karate chop anyone guilty of — merely adding up WAR totals on a depth chart to produce projected team WAR.
Dan Szymborski is a senior writer for FanGraphs and the developer of the ZiPS projection system. He was a writer for ESPN.com from 2010-2018, a regular guest on a number of radio shows and podcasts, and a voting BBWAA member. He also maintains a terrible Twitter account at @DSzymborski.
The Giants are that desperate ex who tries to cling on way past the restraining order.