2019 ZiPS Projections – Toronto Blue Jays

After having typically appeared in the hallowed pages of Baseball Think Factory, Dan Szymborski’s ZiPS projections have now been released at FanGraphs for more than half a decade. The exercise continues this offseason. Below are the projections for the Toronto Blue Jays.
Batters
This is a bit awkward, as the most interesting Blue Jays batters essentially sit in the Bench and Prospects section. Probably the starkest difference between ZiPS and Steamer comes in the form of Lourdes Gurriel, Jr., who has such an unhappy projection from ZiPS that I went back and ran it a second time to make sure I hadn’t goofed anything. From his minor league hit data, ZiPS doesn’t think Gurriel will be able to maintain his minor-league BABIP. And the poor defensive projection isn’t just ZiPS overreacting to Gurriel’s fairly poor BIS and UZR defensive numbers; as rudimentary as even play-by-play minor league defensive measures are, Gurriel’s estimates come in below-average there as well.
The larger problem with the Blue Jay offense is that ZiPS essentially sees little upside remaining among the established players. Tulowitzki and Donaldson were both gone, and while they weren’t stars in 2018 by any stretch of the imagination (and Tulo didn’t even get in a game), they at least represented the possibility of star-level performance going into 2018. Smoak’s 2017 was probably his high-water mark and he’s now a designated hitter on the wrong side of 30, while Devon Travis is another year further away from when he looked like he could be a borderline star. Toronto was 10th in the AL in runs scored in 2018, but outside of the admittedly super-exciting addition of Vladimir Guerrero Jr., I just don’t see much of a hope for this unit doing much more than last year.
Pitchers
ZiPS isn’t completely down on Marcus Stroman and Aaron Sanchez, again seeing them as the most valuable pitchers on the staff, but you’d be a big dirty liar if you said you felt anywhere near as sunny about the pair as you did in any other preceding winter. Stroman’s command recovered somewhat after a miserable April and a six-week stint on the DL with shoulder fatigue, but his stuff looked as bland as boiled celery and the team shut him down after late-season blister issues. Given the trade rumors buzzing around Stroman, the right-hander may not even be in Toronto come April, and the possible in-house replacements are less than exciting. Sanchez and Stroman are also both groundballers on a team that doesn’t look to have particularly good infield defense.
The projected rotation just gets weaker from there. The Jays have been unable to effectively replace what Marco Estrada gave the team in 2015-2016 and now need to replace J.A. Happ’s performance as well. Realistically, Toronto needs to sign two mid-rotation starters in free agency to be in contention, something it doesn’t look like they’re planning to do. The original plan was for the team to contend while rebuilding, staying relevant until Vladito ‘n’ Friends made the majors, but this team looks more like the 2018 Orioles (coming into the season, that is) than it does even just a serious wild card contender.
To prove that I’m not being facetious, the little depth chart graphic for the O’s pitching going into 2018 gave Baltimore more projected pitching wins than ZiPS is giving the Blue Jays now.
Bench and Prospects
Now we get to the fun part! There was once an episode of Star Trek: The Next Generation that took place on a planet of people who had been made impotent by some magic god-computer-robot that ran the planet. So to continue to develop their future prospects, they kidnapped the children from the Enterprise to replace themselves. The Jays farm system looks a lot like that, with the children of Vladimir Guerrero, Craig Biggio, Dante Bichette, Griffin Conine, and Dwight Smith all prospects. And of the real kind, not the Craig Griffey variety. And that’s just off the top of my head; perhaps I’m forgetting that Logan Warmoth is actually related to Mothra or something. I’m not sure which prospect is Wesley Crusher.
A lot of the farm system’s ranking is due to Guerrero, and while the Blue Jays will get some good players out of this group, I don’t think it’s deep enough to solve most of the team’s long-term roster issues, as in the case of the Padres or Braves, who have high-end prospects but also a quantity of other interesting minor leaguers who Toronto can’t match.
I don’t remember what happened in that episode of Star Trek. I’ll guess the people on the planet blew up their home because they were tired of Wesley. Toronto’s not that bad yet. But I think we’re a few months from the team dropping the pretense of contending-while-rebuilding, and even more aggressively shopping their veterans.
One pedantic note for 2019: for the WAR graphic, I’m using FanGraphs’ depth chart playing time, not the playing time ZiPS spits out, so there will be occasional differences in WAR totals.
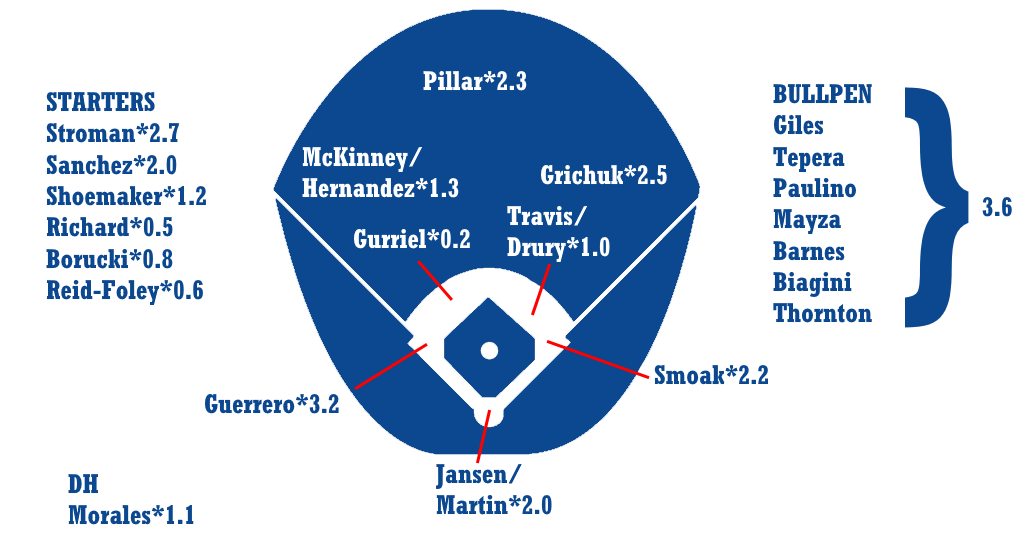
Ballpark graphic courtesy Eephus League. Depth charts constructed by way of those listed here at site.
| Player | B | Age | PO | G | AB | R | H | 2B | 3B | HR | RBI | BB | SO | SB | CS |
|---|---|---|---|---|---|---|---|---|---|---|---|---|---|---|---|
| Vladimir Guerrero Jr. | R | 20 | 3B | 114 | 441 | 67 | 127 | 25 | 2 | 19 | 70 | 42 | 68 | 4 | 3 |
| Randal Grichuk | R | 27 | RF | 141 | 476 | 70 | 116 | 31 | 3 | 29 | 78 | 33 | 157 | 4 | 2 |
| Kevin Pillar | R | 30 | CF | 145 | 539 | 66 | 140 | 35 | 2 | 13 | 54 | 23 | 96 | 14 | 4 |
| Justin Smoak | B | 32 | 1B | 147 | 451 | 60 | 105 | 24 | 1 | 24 | 71 | 64 | 140 | 0 | 1 |
| Danny Jansen | R | 24 | C | 111 | 382 | 51 | 93 | 22 | 1 | 10 | 47 | 40 | 75 | 4 | 1 |
| Bo Bichette | R | 21 | SS | 131 | 549 | 70 | 138 | 35 | 5 | 14 | 66 | 38 | 131 | 20 | 9 |
| Russell Martin | R | 36 | C | 94 | 312 | 44 | 66 | 12 | 0 | 12 | 38 | 49 | 95 | 1 | 3 |
| Yangervis Solarte | B | 31 | 3B | 122 | 452 | 51 | 115 | 25 | 1 | 15 | 64 | 31 | 67 | 1 | 2 |
| Kevin Smith | R | 22 | SS | 121 | 509 | 59 | 115 | 26 | 2 | 17 | 62 | 27 | 157 | 16 | 5 |
| Cavan Biggio | L | 24 | 2B | 123 | 457 | 58 | 91 | 17 | 3 | 15 | 55 | 62 | 179 | 11 | 7 |
| Santiago Espinal | R | 24 | SS | 125 | 490 | 53 | 120 | 19 | 3 | 7 | 39 | 30 | 89 | 9 | 5 |
| Jonathan Davis | R | 27 | CF | 132 | 484 | 58 | 104 | 22 | 4 | 10 | 45 | 40 | 139 | 18 | 6 |
| Kendrys Morales | B | 36 | DH | 125 | 434 | 50 | 108 | 19 | 0 | 20 | 68 | 41 | 103 | 1 | 1 |
| Teoscar Hernandez | R | 26 | LF | 135 | 498 | 70 | 117 | 27 | 4 | 22 | 65 | 42 | 165 | 11 | 7 |
| Billy McKinney | L | 24 | RF | 126 | 450 | 54 | 103 | 23 | 6 | 15 | 51 | 40 | 132 | 2 | 2 |
| Rowdy Tellez | L | 24 | 1B | 137 | 483 | 60 | 120 | 28 | 0 | 19 | 66 | 39 | 117 | 5 | 3 |
| Reese McGuire | L | 24 | C | 102 | 344 | 38 | 78 | 16 | 2 | 8 | 36 | 29 | 87 | 3 | 3 |
| Devon Travis | R | 28 | 2B | 109 | 405 | 50 | 105 | 24 | 2 | 11 | 50 | 20 | 77 | 4 | 2 |
| Dwight Smith Jr. | L | 26 | LF | 120 | 427 | 50 | 102 | 24 | 2 | 10 | 45 | 39 | 95 | 8 | 4 |
| Brandon Drury | R | 26 | 3B | 118 | 414 | 43 | 99 | 25 | 1 | 10 | 44 | 33 | 111 | 2 | 2 |
| Lourdes Gurriel | R | 25 | SS | 121 | 464 | 54 | 115 | 22 | 1 | 14 | 58 | 23 | 101 | 6 | 5 |
| Eric Sogard | L | 33 | 2B | 95 | 261 | 29 | 59 | 12 | 1 | 2 | 18 | 28 | 51 | 5 | 2 |
| Luke Maile | R | 28 | C | 78 | 239 | 24 | 48 | 12 | 1 | 4 | 24 | 20 | 69 | 1 | 0 |
| Anthony Alford | R | 24 | CF | 112 | 394 | 44 | 80 | 17 | 1 | 7 | 33 | 33 | 143 | 14 | 7 |
| Dalton Pompey | B | 26 | RF | 81 | 294 | 36 | 64 | 12 | 1 | 7 | 25 | 27 | 91 | 13 | 3 |
| Jason Leblebijian | R | 28 | 3B | 103 | 378 | 42 | 77 | 14 | 2 | 12 | 41 | 29 | 150 | 5 | 4 |
| Gift Ngoepe | B | 29 | SS | 85 | 259 | 27 | 43 | 11 | 2 | 6 | 23 | 27 | 124 | 2 | 3 |
| Darnell Sweeney | B | 28 | 2B | 108 | 382 | 44 | 81 | 17 | 3 | 11 | 42 | 34 | 143 | 9 | 8 |
| Joshua Palacios | L | 23 | CF | 121 | 505 | 52 | 114 | 21 | 4 | 7 | 46 | 35 | 151 | 10 | 9 |
| Richard Urena | L | 23 | SS | 134 | 483 | 44 | 108 | 24 | 3 | 7 | 44 | 23 | 122 | 4 | 4 |
| Connor Panas | L | 26 | RF | 106 | 380 | 40 | 75 | 13 | 2 | 12 | 39 | 25 | 129 | 3 | 3 |
| Forrest Wall | L | 23 | CF | 124 | 500 | 59 | 114 | 19 | 5 | 10 | 46 | 41 | 150 | 25 | 13 |
| Roemon Fields | L | 28 | CF | 111 | 407 | 39 | 87 | 10 | 3 | 2 | 24 | 26 | 110 | 25 | 12 |
| Max Pentecost | R | 26 | C | 82 | 328 | 32 | 69 | 12 | 1 | 9 | 35 | 13 | 105 | 1 | 1 |
| Juan Kelly | L | 24 | 1B | 115 | 422 | 46 | 86 | 20 | 2 | 12 | 46 | 38 | 150 | 3 | 3 |
| Ian Parmley | L | 29 | RF | 69 | 217 | 19 | 43 | 5 | 2 | 1 | 13 | 11 | 69 | 4 | 2 |
| Andrew Guillotte | R | 26 | LF | 113 | 398 | 41 | 80 | 16 | 1 | 4 | 27 | 31 | 107 | 10 | 7 |
| Player | BA | OBP | SLG | OPS+ | ISO | BABIP | RC/27 | Def | WAR | No. 1 Comp |
|---|---|---|---|---|---|---|---|---|---|---|
| Vladimir Guerrero Jr. | .288 | .352 | .483 | 123 | .195 | .305 | 6.4 | -4 | 2.7 | Bobby Doerr |
| Randal Grichuk | .244 | .300 | .504 | 112 | .261 | .300 | 5.4 | 5 | 2.4 | Keith Williams |
| Kevin Pillar | .260 | .295 | .404 | 87 | .145 | .295 | 4.5 | 9 | 2.1 | Garry Maddox |
| Justin Smoak | .233 | .329 | .450 | 109 | .217 | .282 | 5.2 | 2 | 1.8 | Roy Smalley |
| Danny Jansen | .243 | .332 | .385 | 94 | .141 | .279 | 4.6 | -2 | 1.6 | Gregg Zaun |
| Bo Bichette | .251 | .302 | .410 | 90 | .158 | .307 | 4.5 | -3 | 1.5 | Robin Yount |
| Russell Martin | .212 | .330 | .365 | 89 | .154 | .263 | 4.0 | 1 | 1.4 | Rick Dempsey |
| Yangervis Solarte | .254 | .306 | .414 | 93 | .159 | .270 | 4.5 | -2 | 1.0 | David Bell |
| Kevin Smith | .226 | .270 | .385 | 75 | .159 | .293 | 3.8 | 4 | 1.0 | Tommy Whiteman |
| Cavan Biggio | .199 | .297 | .348 | 74 | .149 | .289 | 3.4 | 7 | 1.0 | Dan Cholowsky |
| Santiago Espinal | .245 | .292 | .339 | 71 | .094 | .287 | 3.5 | 6 | 0.9 | Ramon Martinez |
| Jonathan Davis | .215 | .288 | .339 | 69 | .124 | .281 | 3.5 | 8 | 0.9 | Matt Rundels |
| Kendrys Morales | .249 | .317 | .431 | 100 | .182 | .283 | 4.9 | 0 | 0.9 | Not That Frank Thomas |
| Teoscar Hernandez | .235 | .298 | .438 | 96 | .203 | .305 | 4.5 | 0 | 0.9 | Scott Lydy |
| Billy McKinney | .229 | .295 | .407 | 88 | .178 | .290 | 4.2 | 5 | 0.8 | Matt Bowser |
| Rowdy Tellez | .248 | .306 | .424 | 95 | .176 | .291 | 4.6 | 2 | 0.8 | Daryle Ward |
| Reese McGuire | .227 | .292 | .355 | 74 | .128 | .281 | 3.5 | 2 | 0.7 | Gregg Zaun |
| Devon Travis | .259 | .298 | .410 | 89 | .151 | .297 | 4.4 | -3 | 0.7 | Jerry Adair |
| Dwight Smith Jr. | .239 | .304 | .375 | 83 | .136 | .286 | 4.0 | 4 | 0.5 | Ryan McGuire |
| Brandon Drury | .239 | .301 | .377 | 82 | .138 | .304 | 4.0 | -2 | 0.4 | Jamie D’Antona |
| Lourdes Gurriel | .248 | .288 | .390 | 81 | .142 | .289 | 3.9 | -6 | 0.2 | Rey Quinones |
| Eric Sogard | .226 | .304 | .303 | 66 | .077 | .274 | 3.2 | 3 | 0.2 | Dan Rohn |
| Luke Maile | .201 | .267 | .310 | 56 | .109 | .265 | 2.8 | 3 | 0.1 | Bill Dobrolsky |
| Anthony Alford | .203 | .275 | .305 | 57 | .102 | .299 | 2.8 | 7 | 0.0 | Julian Martinez |
| Dalton Pompey | .218 | .288 | .337 | 69 | .119 | .291 | 3.6 | 3 | 0.0 | Rashad Eldridge |
| Jason Leblebijian | .204 | .266 | .347 | 64 | .143 | .301 | 3.0 | 2 | -0.2 | Seth Bynum |
| Gift Ngoepe | .166 | .249 | .293 | 47 | .127 | .287 | 2.2 | 4 | -0.3 | Paul Hoover |
| Darnell Sweeney | .212 | .278 | .359 | 71 | .147 | .307 | 3.2 | -4 | -0.5 | Dan DeMent |
| Joshua Palacios | .226 | .280 | .325 | 64 | .099 | .308 | 3.0 | 1 | -0.6 | Rod Myers |
| Richard Urena | .224 | .257 | .329 | 57 | .106 | .285 | 2.9 | 1 | -0.6 | Gary Miller-Jones |
| Connor Panas | .197 | .260 | .337 | 60 | .139 | .264 | 2.9 | 5 | -0.7 | Garrick Haltiwanger |
| Forrest Wall | .228 | .292 | .346 | 72 | .118 | .306 | 3.5 | -9 | -0.7 | Ethan Faggett |
| Roemon Fields | .214 | .265 | .268 | 46 | .054 | .288 | 2.5 | 6 | -0.7 | Chad Durham |
| Max Pentecost | .210 | .243 | .335 | 55 | .125 | .280 | 2.8 | -4 | -0.9 | Johnny Cuevas |
| Juan Kelly | .204 | .272 | .346 | 66 | .142 | .285 | 3.1 | 1 | -1.0 | Kevin Burns |
| Ian Parmley | .198 | .239 | .253 | 34 | .055 | .286 | 2.0 | 4 | -1.0 | Jay Sitzman |
| Andrew Guillotte | .201 | .265 | .276 | 48 | .075 | .265 | 2.4 | 7 | -1.3 | Doug Livingston |
| Player | T | Age | W | L | ERA | G | GS | IP | H | ER | HR | BB | SO |
|---|---|---|---|---|---|---|---|---|---|---|---|---|---|
| Marcus Stroman | R | 28 | 9 | 7 | 4.08 | 24 | 24 | 139.0 | 144 | 63 | 13 | 43 | 104 |
| Aaron Sanchez | R | 26 | 6 | 6 | 4.17 | 24 | 24 | 127.3 | 124 | 59 | 11 | 60 | 98 |
| Ryan Borucki | L | 25 | 9 | 10 | 4.81 | 28 | 28 | 151.7 | 166 | 81 | 21 | 53 | 108 |
| Matt Shoemaker | R | 32 | 6 | 6 | 4.48 | 17 | 17 | 90.3 | 94 | 45 | 14 | 26 | 82 |
| Trent Thornton | R | 25 | 8 | 9 | 4.80 | 25 | 22 | 123.7 | 139 | 66 | 21 | 28 | 96 |
| Mike Hauschild | R | 29 | 7 | 8 | 4.73 | 22 | 21 | 110.3 | 120 | 58 | 13 | 47 | 84 |
| Ken Giles | R | 28 | 2 | 2 | 3.49 | 63 | 0 | 59.3 | 55 | 23 | 6 | 16 | 70 |
| Sean Reid-Foley | R | 23 | 10 | 12 | 4.92 | 29 | 29 | 142.7 | 144 | 78 | 22 | 67 | 137 |
| Jacob Waguespack | R | 25 | 6 | 6 | 4.48 | 31 | 16 | 96.3 | 102 | 48 | 9 | 48 | 72 |
| Ryan Tepera | R | 31 | 5 | 4 | 3.92 | 63 | 0 | 62.0 | 56 | 27 | 7 | 24 | 62 |
| Marco Estrada | R | 35 | 8 | 10 | 4.99 | 26 | 26 | 140.7 | 146 | 78 | 23 | 49 | 107 |
| David Paulino | R | 25 | 2 | 2 | 4.27 | 16 | 10 | 52.7 | 53 | 25 | 8 | 15 | 50 |
| Tyler Clippard | R | 34 | 4 | 3 | 4.05 | 66 | 0 | 60.0 | 52 | 27 | 9 | 24 | 69 |
| Clayton Richard | L | 35 | 7 | 8 | 4.89 | 25 | 22 | 130.7 | 152 | 71 | 18 | 42 | 86 |
| T.J. Zeuch | R | 23 | 8 | 10 | 5.13 | 25 | 25 | 133.3 | 153 | 76 | 19 | 43 | 73 |
| Tim Mayza | L | 27 | 4 | 4 | 4.21 | 54 | 0 | 62.0 | 58 | 29 | 7 | 31 | 65 |
| Jake Petricka | R | 31 | 2 | 2 | 4.22 | 52 | 0 | 59.7 | 65 | 28 | 6 | 19 | 43 |
| Patrick Murphy | R | 24 | 6 | 8 | 5.18 | 26 | 25 | 128.7 | 138 | 74 | 16 | 62 | 86 |
| Sam Gaviglio | R | 29 | 6 | 8 | 5.26 | 28 | 26 | 137.0 | 155 | 80 | 26 | 36 | 101 |
| Joe Biagini | R | 29 | 7 | 8 | 4.85 | 51 | 13 | 105.7 | 116 | 57 | 14 | 36 | 75 |
| Danny Barnes | R | 29 | 4 | 4 | 4.42 | 55 | 0 | 57.0 | 56 | 28 | 8 | 20 | 55 |
| Justin Shafer | R | 26 | 5 | 5 | 4.50 | 53 | 0 | 62.0 | 62 | 31 | 5 | 32 | 45 |
| Sam Moll | L | 27 | 2 | 2 | 4.24 | 40 | 0 | 46.7 | 50 | 22 | 5 | 17 | 36 |
| Zach Stewart | R | 32 | 4 | 5 | 5.23 | 19 | 14 | 82.7 | 96 | 48 | 13 | 30 | 51 |
| Travis Bergen | L | 25 | 3 | 3 | 4.41 | 33 | 0 | 32.7 | 32 | 16 | 4 | 14 | 30 |
| Elvis Luciano | R | 19 | 3 | 4 | 5.12 | 11 | 10 | 45.7 | 51 | 26 | 5 | 24 | 24 |
| Conor Fisk | R | 27 | 3 | 4 | 4.61 | 47 | 1 | 70.3 | 75 | 36 | 9 | 25 | 49 |
| Murphy Smith | R | 31 | 3 | 4 | 5.18 | 30 | 7 | 66.0 | 76 | 38 | 9 | 27 | 40 |
| Rhiner Cruz | R | 32 | 2 | 2 | 4.78 | 29 | 0 | 32.0 | 30 | 17 | 3 | 22 | 33 |
| Mark Leiter | R | 28 | 2 | 3 | 4.83 | 47 | 0 | 59.7 | 62 | 32 | 10 | 23 | 55 |
| Hector Perez | R | 23 | 4 | 5 | 5.40 | 27 | 18 | 100.0 | 98 | 60 | 12 | 84 | 96 |
| Thomas Pannone | L | 25 | 4 | 6 | 5.47 | 22 | 18 | 98.7 | 110 | 60 | 20 | 36 | 79 |
| Danny Young | L | 25 | 1 | 2 | 4.79 | 42 | 0 | 56.3 | 60 | 30 | 6 | 26 | 37 |
| Julian Merryweather | R | 27 | 5 | 7 | 5.50 | 18 | 16 | 86.7 | 103 | 53 | 16 | 27 | 62 |
| Zach G. Jackson | R | 24 | 2 | 3 | 4.97 | 45 | 0 | 54.3 | 46 | 30 | 4 | 55 | 60 |
| Corey Copping | R | 25 | 3 | 3 | 4.83 | 47 | 0 | 63.3 | 61 | 34 | 7 | 42 | 62 |
| Shawn Morimando | L | 26 | 6 | 9 | 5.58 | 22 | 21 | 109.7 | 130 | 68 | 18 | 47 | 73 |
| Matt Tracy | L | 30 | 3 | 4 | 5.62 | 18 | 12 | 64.0 | 75 | 40 | 11 | 28 | 42 |
| Taylor Guerrieri | R | 26 | 3 | 4 | 5.56 | 28 | 12 | 79.3 | 92 | 49 | 14 | 31 | 51 |
| Jake Fishman | L | 24 | 2 | 3 | 5.02 | 43 | 0 | 52.0 | 56 | 29 | 9 | 12 | 40 |
| Craig Breslow | L | 38 | 1 | 2 | 5.49 | 39 | 0 | 41.0 | 45 | 25 | 6 | 22 | 31 |
| Brandon Cumpton | R | 30 | 3 | 4 | 5.72 | 14 | 8 | 50.3 | 61 | 32 | 8 | 20 | 29 |
| Yennsy Diaz | R | 22 | 6 | 8 | 5.70 | 25 | 24 | 118.3 | 130 | 75 | 18 | 67 | 85 |
| Jon Harris | R | 25 | 7 | 11 | 5.74 | 26 | 26 | 131.7 | 158 | 84 | 25 | 43 | 80 |
| David Garner | R | 26 | 2 | 3 | 6.19 | 29 | 0 | 36.3 | 40 | 25 | 7 | 25 | 33 |
| Justin Dillon | R | 25 | 4 | 7 | 6.04 | 23 | 13 | 82.0 | 98 | 55 | 16 | 35 | 45 |
| Luis Santos | R | 28 | 4 | 7 | 6.10 | 32 | 12 | 87.0 | 100 | 59 | 20 | 35 | 74 |
| Player | TBF | K/9 | BB/9 | HR/9 | BABIP | ERA+ | ERA- | FIP | WAR | No. 1 Comp |
|---|---|---|---|---|---|---|---|---|---|---|
| Marcus Stroman | 596 | 6.73 | 2.78 | 0.84 | .303 | 105 | 95 | 3.86 | 2.1 | Willard Nixon |
| Aaron Sanchez | 560 | 6.93 | 4.24 | 0.78 | .292 | 103 | 97 | 4.24 | 1.8 | Blue Moon Odom |
| Ryan Borucki | 670 | 6.41 | 3.15 | 1.25 | .302 | 89 | 112 | 4.73 | 1.1 | Thomas Biko |
| Matt Shoemaker | 389 | 8.17 | 2.59 | 1.39 | .304 | 96 | 105 | 4.35 | 1.0 | Brian Lawrence |
| Trent Thornton | 536 | 6.99 | 2.04 | 1.53 | .307 | 89 | 112 | 4.65 | 0.9 | Tim Kester |
| Mike Hauschild | 497 | 6.85 | 3.83 | 1.06 | .309 | 91 | 110 | 4.63 | 0.9 | Don Schwall |
| Ken Giles | 246 | 10.62 | 2.43 | 0.91 | .320 | 119 | 84 | 2.96 | 0.9 | Darren Holmes |
| Sean Reid-Foley | 636 | 8.64 | 4.23 | 1.39 | .303 | 87 | 115 | 4.79 | 0.9 | Darin Blood |
| Jacob Waguespack | 438 | 6.73 | 4.48 | 0.84 | .307 | 93 | 108 | 4.55 | 0.8 | Don Stanhouse |
| Ryan Tepera | 267 | 9.00 | 3.48 | 1.02 | .290 | 109 | 91 | 4.02 | 0.7 | Tom Hume |
| Marco Estrada | 608 | 6.85 | 3.14 | 1.47 | .288 | 86 | 116 | 4.84 | 0.7 | Mike Moore |
| David Paulino | 225 | 8.54 | 2.56 | 1.37 | .302 | 100 | 100 | 4.25 | 0.7 | Hector Fajardo |
| Tyler Clippard | 254 | 10.35 | 3.60 | 1.35 | .287 | 106 | 95 | 4.10 | 0.6 | Steve Bedrosian |
| Clayton Richard | 582 | 5.92 | 2.89 | 1.24 | .312 | 85 | 118 | 4.73 | 0.6 | Mark Redman |
| T.J. Zeuch | 592 | 4.93 | 2.90 | 1.28 | .298 | 84 | 120 | 5.03 | 0.5 | Jason Karnuth |
| Tim Mayza | 274 | 9.44 | 4.50 | 1.02 | .304 | 102 | 98 | 4.17 | 0.5 | Brian Snyder |
| Jake Petricka | 261 | 6.49 | 2.87 | 0.91 | .311 | 101 | 99 | 4.12 | 0.4 | Frank Linzy |
| Patrick Murphy | 584 | 6.02 | 4.34 | 1.12 | .296 | 83 | 121 | 5.06 | 0.4 | Scott Holman |
| Sam Gaviglio | 597 | 6.64 | 2.36 | 1.71 | .301 | 82 | 123 | 5.06 | 0.3 | Clay Condrey |
| Joe Biagini | 465 | 6.39 | 3.07 | 1.19 | .304 | 86 | 117 | 4.59 | 0.3 | Tommie Sisk |
| Danny Barnes | 245 | 8.68 | 3.16 | 1.26 | .300 | 97 | 103 | 4.20 | 0.3 | Guillermo Mota |
| Justin Shafer | 279 | 6.53 | 4.65 | 0.73 | .295 | 95 | 105 | 4.49 | 0.3 | Hal Reniff |
| Sam Moll | 205 | 6.94 | 3.28 | 0.96 | .310 | 98 | 102 | 4.22 | 0.3 | Jim Crawford |
| Zach Stewart | 372 | 5.55 | 3.27 | 1.42 | .304 | 82 | 122 | 5.23 | 0.2 | Dick Fowler |
| Travis Bergen | 144 | 8.27 | 3.86 | 1.10 | .298 | 97 | 103 | 4.37 | 0.2 | Chris Marchok |
| Elvis Luciano | 213 | 4.73 | 4.73 | 0.99 | .297 | 84 | 119 | 5.43 | 0.2 | Chris Zachary |
| Conor Fisk | 309 | 6.27 | 3.20 | 1.15 | .297 | 90 | 111 | 4.66 | 0.2 | Mike Proly |
| Murphy Smith | 300 | 5.45 | 3.68 | 1.23 | .305 | 83 | 121 | 5.12 | 0.1 | Karl Drews |
| Rhiner Cruz | 148 | 9.28 | 6.19 | 0.84 | .307 | 90 | 112 | 4.56 | 0.0 | Moe Burtschy |
| Mark Leiter | 264 | 8.30 | 3.47 | 1.51 | .302 | 89 | 113 | 4.84 | 0.0 | Kirk Bullinger |
| Hector Perez | 481 | 8.64 | 7.56 | 1.08 | .304 | 79 | 126 | 5.49 | 0.0 | John D’Acquisto |
| Thomas Pannone | 441 | 7.21 | 3.28 | 1.82 | .300 | 78 | 128 | 5.46 | 0.0 | Dale Polley |
| Danny Young | 254 | 5.91 | 4.15 | 0.96 | .297 | 87 | 115 | 4.77 | 0.0 | Mike Cosgrove |
| Julian Merryweather | 388 | 6.44 | 2.80 | 1.66 | .313 | 78 | 128 | 5.23 | 0.0 | Mark Johnson |
| Zach G. Jackson | 263 | 9.94 | 9.11 | 0.66 | .298 | 86 | 116 | 5.10 | -0.1 | Joe Hudson |
| Corey Copping | 293 | 8.81 | 5.97 | 0.99 | .303 | 86 | 116 | 4.81 | -0.1 | Marc Pisciotta |
| Shawn Morimando | 503 | 5.99 | 3.86 | 1.48 | .312 | 77 | 130 | 5.40 | -0.1 | Rich Rundles |
| Matt Tracy | 293 | 5.91 | 3.94 | 1.55 | .306 | 76 | 131 | 5.53 | -0.1 | Roger Deago |
| Taylor Guerrieri | 360 | 5.79 | 3.52 | 1.59 | .301 | 77 | 130 | 5.52 | -0.2 | Eric Stone |
| Jake Fishman | 223 | 6.92 | 2.08 | 1.56 | .296 | 83 | 121 | 4.73 | -0.2 | Roberto Rivera |
| Craig Breslow | 189 | 6.80 | 4.83 | 1.32 | .305 | 78 | 128 | 5.30 | -0.3 | Dave Giusti |
| Brandon Cumpton | 231 | 5.19 | 3.58 | 1.43 | .310 | 73 | 138 | 5.43 | -0.3 | Bennie Daniels |
| Yennsy Diaz | 551 | 6.46 | 5.10 | 1.37 | .300 | 75 | 133 | 5.59 | -0.3 | Brett Laxton |
| Jon Harris | 593 | 5.47 | 2.94 | 1.71 | .304 | 75 | 134 | 5.57 | -0.4 | Jon Asahina |
| David Garner | 174 | 8.17 | 6.19 | 1.73 | .311 | 67 | 149 | 6.15 | -0.6 | Rick Greene |
| Justin Dillon | 377 | 4.94 | 3.84 | 1.76 | .297 | 71 | 141 | 6.05 | -0.6 | Julien Tucker |
| Luis Santos | 394 | 7.66 | 3.62 | 2.07 | .307 | 70 | 142 | 5.78 | -0.7 | Wes Wilkerson |
Disclaimer: ZiPS projections are computer-based projections of performance. Performances have not been allocated to predicted playing time in the majors — many of the players listed above are unlikely to play in the majors at all in 2019. ZiPS is projecting equivalent production — a .240 ZiPS projection may end up being .280 in AAA or .300 in AA, for example. Whether or not a player will play is one of many non-statistical factors one has to take into account when predicting the future.
Players are listed with their most recent teams, unless I have made a mistake. This is very possible, as a lot of minor-league signings go generally unreported in the offseason.
ZiPS’ projections are based on the American League having a 4.29 ERA and the National League having a 4.15 ERA.
Players who are expected to be out due to injury are still projected. More information is always better than less information, and a computer isn’t the tool that should project the injury status of, for example, a pitcher who has had Tommy John surgery.
Both hitters and pitchers are ranked by projected zWAR — which is to say, WAR values as calculated by me, Dan Szymborski, whose surname is spelled with a z. WAR values might differ slightly from those which appear in full release of ZiPS. Finally, I will advise anyone against — and might karate chop anyone guilty of — merely adding up WAR totals on a depth chart to produce projected team WAR.
Dan Szymborski is a senior writer for FanGraphs and the developer of the ZiPS projection system. He was a writer for ESPN.com from 2010-2018, a regular guest on a number of radio shows and podcasts, and a voting BBWAA member. He also maintains a terrible Twitter account at @DSzymborski.
Why are all the Jays catchers of the future compared to Gregg Zaun 🙁 ?