
2022 ZiPS Projections: Boston Red Sox
After having typically appeared in the hallowed pages of Baseball Think Factory, Dan Szymborski’s ZiPS projections have now been released at FanGraphs for a decade. The exercise continues this offseason. Below are the projections for the Boston Red Sox.
Batters
By winning 92 games, the Red Sox comfortably exceeded most expectations for the team in 2021. How do they do it again? There’s a path available, though not all the elements are in the organization right now.
The part Boston already has sorted is the offensive players who did the most to push the team to fourth in the American League in runs scored. Rafael Devers, Xander Bogaerts, and Enrique Hernández are back, and there’s no reason to expect any kind of decline from the first two, while Hernández isn’t remotely in the steep decline phase yet. Alex Verdugo, J.D. Martinez, and the catcher tandem are projected to give roughly league-average performances, hardly surprising results. There may be some grumbling about JDM’s projection, but even if ZiPS can mostly overlook his mess of a 2020 — wouldn’t it be nice if we could all forget that year? — it can’t forget that he’s also a 34-year-old designated hitter. Yes, David Ortiz aged incredibly well (and ZiPS was weirdly optimistic he would), but most players of the type do not. Martinez shouldn’t be a problem in 2022, but the day when that will become likely is coming.
The weakest parts of the lineup, at least if you agree with the projections, are apparent: center field, left field, and first base. Yes, Jackie Bradley Jr. had a terrific short 2020 (ZiPS saw that season as a drastic over-performance of his peripheral data from that campaign), but before that season, it looked like he was in steady decline, and he was abysmal for the Brewers last year. Bobby Dalbec has flashed considerable power at first base, but there’s just not much else there. And if you’re going to be competitive as a one-dimensional hitter at first, that dimension better be universe-shaking, not just merely good. If the Red Sox don’t make a short-term move here, I hope Triston Casas is called up very quickly if he’s hitting in Triple-A; ZiPS isn’t projecting him to be amazing, but his upside is much higher than Dalbec’s.
I’m less worried about the hole in left, because while I can imagine the Red Sox just rolling with JBJ and Dalbec, I don’t believe that they’d actually enter the season with Jarren Duran and Christin Stewart getting the at-bats in left. Honestly, I think they’d put Hernández out there and start Christian Arroyo at second before doing that. This is one place I expect them to be active when the offseason resumes, and I’ll be very disappointed if they are not.
There’s not much excitement in the high minors here, and the bench is a little light, though that’s another place I expect the Red Sox to make some low-key additions.
Pitchers
One of the keys to the Red Sox exceeding expectations in 2021 was the rotation’s health. With only Nick Pivetta spared some kind of significant injury history, the ability of the team to use their desired starting pitchers was easily the most significant source of variation in Boston’s preseason projections. In the simulations where they got lucky with the health of pitchers like Nathan Eovaldi, Garrett Richards, and Chris Sale, the Red Sox frequently won around 90 games. When they didn’t, the organization’s lack of impact high-level arms caused the wheels to come off very quickly.
In 2021, the team got the health they needed. Only seven pitchers received multiple starts for Boston, and while not all of them were great, the rotation was stable. And it was enough. But it’s a hard thing to count on for a second straight season; my cats don’t push a glass balanced on the edge of the counter to the kitchen floor every time, but that doesn’t mean I’m going to entrust them with the care of those glasses. James Paxton was a fun pickup, but he’s yet another pitcher with an injury history. The projections are more stable this year because ZiPS is simply more sold on some of the backup plans, but it still would be nice if the Red Sox had another durable pitcher on the roster.
Another element of Boston’s 2021 success was a very solid bullpen, and that’s one thing ZiPS sees persisting into the coming season. A lot of the pitchers on the team improved their long-term projected outlook (Garrett Whitlock, Darwinzon Hernandez, Josh Taylor), and while no one gets the kind of dominating projection to put them in elite territory, there’s a lot of very good performance expected from bow to almost stern. Perhaps an additional arm at the back of the rotation would help, but with the Red Sox accumulating a lot of maybe-healthy starting pitchers, they may have one or two of those names to fatten the relief corps in a swing role.
I’m calling the Red Sox for mid-80s wins as of right now, but I think they’ll likely add two or three wins in left, and either something more creative in center or another workhorse starter before it’s all said and done.
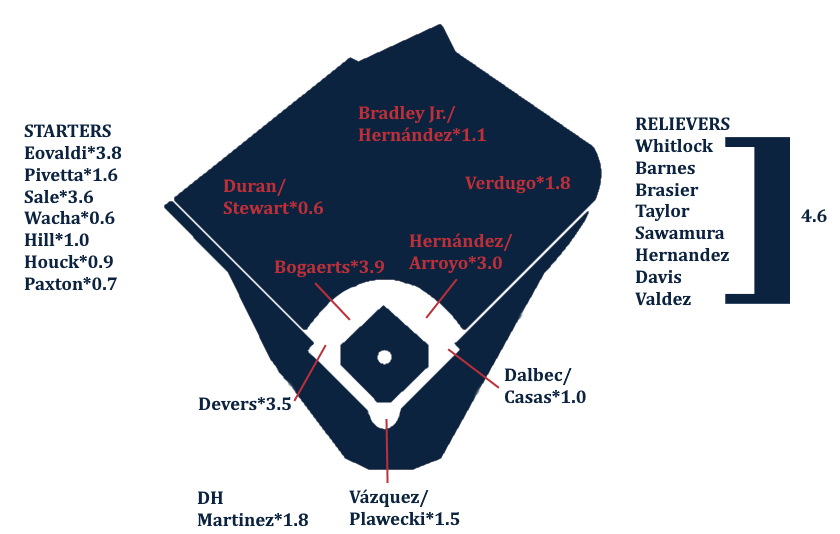
Ballpark graphic courtesy Eephus League. Depth charts constructed by way of those listed here.
| Player | B | Age | PO | PA | AB | R | H | 2B | 3B | HR | RBI | BB | SO | SB | CS |
|---|---|---|---|---|---|---|---|---|---|---|---|---|---|---|---|
| Rafael Devers | L | 25 | 3B | 672 | 607 | 107 | 172 | 41 | 2 | 37 | 116 | 57 | 141 | 6 | 5 |
| Xander Bogaerts | R | 29 | SS | 622 | 550 | 88 | 158 | 38 | 1 | 26 | 89 | 62 | 113 | 7 | 1 |
| Enrique Hernández | R | 30 | 2B | 540 | 477 | 75 | 126 | 28 | 3 | 22 | 67 | 50 | 105 | 2 | 0 |
| Kyle Schwarber | L | 29 | LF | 497 | 424 | 72 | 109 | 23 | 2 | 30 | 81 | 66 | 130 | 2 | 2 |
| Alex Verdugo | L | 26 | LF | 568 | 514 | 76 | 150 | 33 | 2 | 13 | 57 | 46 | 89 | 7 | 2 |
| J.D. Martinez | R | 34 | LF | 591 | 527 | 78 | 143 | 32 | 2 | 25 | 86 | 55 | 136 | 1 | 0 |
| José Iglesias | R | 32 | SS | 510 | 482 | 58 | 138 | 32 | 3 | 7 | 54 | 19 | 67 | 6 | 3 |
| Christian Vazquez | R | 31 | C | 486 | 448 | 52 | 116 | 22 | 1 | 11 | 50 | 31 | 87 | 6 | 4 |
| Yairo Muñoz | R | 27 | 3B | 385 | 359 | 43 | 102 | 20 | 2 | 8 | 36 | 19 | 68 | 12 | 4 |
| David Hamilton | L | 24 | SS | 481 | 445 | 48 | 102 | 21 | 4 | 8 | 35 | 32 | 108 | 33 | 5 |
| Bobby Dalbec | R | 27 | 1B | 489 | 438 | 56 | 100 | 20 | 3 | 25 | 71 | 39 | 172 | 3 | 1 |
| Triston Casas | L | 22 | 1B | 433 | 385 | 58 | 97 | 19 | 2 | 16 | 51 | 39 | 101 | 5 | 2 |
| Christian Arroyo | R | 27 | 2B | 222 | 203 | 26 | 51 | 12 | 1 | 7 | 28 | 12 | 52 | 2 | 0 |
| Jarren Duran | L | 25 | CF | 481 | 443 | 55 | 113 | 19 | 5 | 11 | 41 | 30 | 122 | 22 | 6 |
| Jonathan Araúz | B | 23 | 2B | 401 | 359 | 51 | 84 | 17 | 1 | 10 | 42 | 33 | 81 | 2 | 1 |
| Travis Shaw | L | 32 | 3B | 363 | 316 | 36 | 70 | 16 | 0 | 13 | 48 | 40 | 94 | 1 | 1 |
| Christin Stewart | L | 28 | RF | 439 | 393 | 48 | 96 | 22 | 3 | 20 | 68 | 37 | 116 | 1 | 1 |
| Christian Koss | R | 24 | SS | 457 | 422 | 49 | 102 | 19 | 3 | 10 | 40 | 25 | 100 | 7 | 3 |
| Rob Refsnyder | R | 31 | CF | 274 | 245 | 33 | 62 | 14 | 1 | 6 | 28 | 25 | 69 | 1 | 1 |
| Kevin Plawecki | R | 31 | C | 183 | 164 | 17 | 42 | 10 | 1 | 3 | 19 | 14 | 31 | 0 | 0 |
| Jackie Bradley Jr. | L | 32 | CF | 458 | 410 | 53 | 90 | 24 | 3 | 10 | 44 | 35 | 128 | 8 | 2 |
| Danny Santana | B | 31 | 1B | 391 | 360 | 52 | 89 | 19 | 4 | 16 | 50 | 23 | 110 | 13 | 5 |
| Connor Wong | R | 26 | C | 351 | 328 | 38 | 74 | 16 | 3 | 12 | 41 | 19 | 122 | 7 | 2 |
| Chad De La Guerra | L | 29 | 3B | 231 | 212 | 24 | 48 | 11 | 1 | 7 | 21 | 17 | 68 | 4 | 1 |
| Taylor Motter | R | 32 | 3B | 326 | 289 | 37 | 63 | 14 | 2 | 11 | 35 | 32 | 81 | 2 | 2 |
| Ronaldo Hernández | R | 24 | C | 423 | 397 | 44 | 95 | 21 | 2 | 12 | 47 | 15 | 87 | 2 | 1 |
| Joey Meneses | R | 30 | RF | 416 | 382 | 49 | 97 | 20 | 1 | 12 | 49 | 26 | 92 | 0 | 0 |
| Ryan Fitzgerald | L | 28 | SS | 438 | 402 | 45 | 93 | 20 | 3 | 9 | 41 | 28 | 107 | 4 | 5 |
| Franchy Cordero | L | 27 | LF | 428 | 389 | 57 | 92 | 23 | 3 | 12 | 50 | 35 | 137 | 9 | 2 |
| Jack López | R | 29 | 2B | 338 | 310 | 41 | 75 | 14 | 1 | 7 | 32 | 17 | 80 | 10 | 2 |
| Nick Sogard | B | 24 | 2B | 352 | 317 | 37 | 76 | 12 | 1 | 7 | 29 | 25 | 72 | 8 | 4 |
| Jeter Downs | R | 23 | SS | 454 | 409 | 51 | 87 | 18 | 2 | 14 | 45 | 32 | 130 | 17 | 4 |
| Grant Williams | L | 26 | 2B | 368 | 343 | 33 | 85 | 15 | 2 | 3 | 24 | 18 | 48 | 7 | 6 |
| Ricardo Cubillan | B | 24 | 2B | 101 | 89 | 10 | 19 | 3 | 1 | 1 | 5 | 10 | 24 | 1 | 1 |
| Michael Gettys | R | 26 | CF | 412 | 379 | 46 | 76 | 20 | 3 | 14 | 50 | 24 | 149 | 10 | 4 |
| Chris Herrmann | L | 34 | C | 166 | 147 | 17 | 31 | 6 | 1 | 4 | 16 | 16 | 51 | 0 | 0 |
| Cameron Cannon | R | 24 | 2B | 427 | 402 | 49 | 99 | 24 | 1 | 8 | 39 | 18 | 70 | 5 | 3 |
| Josh Ockimey | L | 26 | 1B | 402 | 343 | 51 | 71 | 15 | 1 | 15 | 44 | 51 | 136 | 0 | 1 |
| Jett Bandy | R | 32 | C | 198 | 180 | 21 | 38 | 7 | 0 | 6 | 19 | 10 | 54 | 0 | 1 |
| Jeremy Rivera | B | 27 | SS | 329 | 305 | 31 | 71 | 11 | 1 | 5 | 21 | 18 | 74 | 6 | 2 |
| Devlin Granberg | R | 26 | RF | 443 | 407 | 52 | 100 | 21 | 2 | 10 | 44 | 24 | 96 | 4 | 2 |
| Hudson Potts | R | 23 | 3B | 381 | 350 | 39 | 77 | 16 | 1 | 10 | 37 | 19 | 118 | 0 | 0 |
| Kole Cottam | R | 25 | C | 302 | 271 | 30 | 57 | 14 | 1 | 7 | 26 | 22 | 98 | 0 | 1 |
| Johan Mieses | R | 26 | RF | 387 | 350 | 42 | 74 | 13 | 1 | 14 | 43 | 27 | 105 | 3 | 1 |
| Pedro Castellanos | R | 24 | LF | 439 | 403 | 49 | 100 | 19 | 1 | 10 | 42 | 23 | 86 | 4 | 5 |
| Tyreque Reed | R | 25 | 1B | 403 | 362 | 47 | 79 | 19 | 0 | 12 | 42 | 31 | 125 | 2 | 2 |
| Tanner Nishioka | R | 27 | 2B | 234 | 213 | 23 | 47 | 11 | 0 | 4 | 20 | 11 | 72 | 2 | 1 |
| Tate Matheny | R | 28 | RF | 316 | 293 | 32 | 61 | 13 | 1 | 7 | 28 | 19 | 109 | 7 | 3 |
| Wil Dalton | R | 24 | RF | 369 | 340 | 39 | 62 | 13 | 1 | 9 | 33 | 24 | 110 | 2 | 2 |
| Jeisson Rosario | L | 22 | CF | 452 | 404 | 59 | 88 | 16 | 2 | 6 | 34 | 41 | 122 | 9 | 5 |
| Player | BA | OBP | SLG | OPS+ | ISO | BABIP | RC/27 | Def | WAR | No. 1 Comp |
|---|---|---|---|---|---|---|---|---|---|---|
| Rafael Devers | .283 | .348 | .540 | 131 | .257 | .315 | 7.0 | -7 | 3.7 | Eric Chavez |
| Xander Bogaerts | .287 | .360 | .502 | 125 | .215 | .321 | 6.9 | -6 | 3.6 | Ken McMullen |
| Enrique Hernández | .264 | .339 | .474 | 113 | .210 | .297 | 5.9 | 4 | 2.8 | Mark Ellis |
| Kyle Schwarber | .257 | .360 | .533 | 133 | .276 | .299 | 6.9 | -1 | 2.5 | Mike Epstein |
| Alex Verdugo | .292 | .350 | .440 | 108 | .148 | .333 | 5.9 | 4 | 1.9 | Ryan Sweeney |
| J.D. Martinez | .271 | .342 | .482 | 115 | .211 | .322 | 6.1 | -2 | 1.7 | Jim Rice |
| José Iglesias | .286 | .320 | .409 | 92 | .122 | .321 | 5.0 | 0 | 1.3 | Freddy Sanchez |
| Christian Vazquez | .259 | .308 | .386 | 83 | .127 | .300 | 4.3 | 5 | 1.3 | Cody Mckay |
| Yairo Muñoz | .284 | .324 | .418 | 95 | .134 | .332 | 5.2 | 1 | 1.0 | Omar Infante |
| David Hamilton | .229 | .283 | .348 | 67 | .119 | .286 | 4.0 | 7 | 0.9 | Zach Sorensen |
| Bobby Dalbec | .228 | .303 | .459 | 98 | .231 | .311 | 4.9 | 2 | 0.7 | Kevin Witt |
| Triston Casas | .252 | .325 | .436 | 100 | .184 | .302 | 5.1 | 1 | 0.7 | Chris Pritchett |
| Christian Arroyo | .251 | .309 | .424 | 92 | .172 | .306 | 4.8 | 2 | 0.7 | Bret Boone |
| Jarren Duran | .255 | .308 | .395 | 85 | .140 | .329 | 4.7 | -2 | 0.6 | Bubba Crosby |
| Jonathan Araúz | .234 | .298 | .370 | 76 | .136 | .276 | 3.9 | 5 | 0.6 | Jason Bates |
| Travis Shaw | .222 | .315 | .396 | 87 | .174 | .273 | 4.3 | 0 | 0.6 | Wayne Gross |
| Christin Stewart | .244 | .317 | .468 | 104 | .224 | .296 | 5.3 | -4 | 0.5 | John-Ford Griffin |
| Christian Koss | .242 | .289 | .372 | 74 | .130 | .295 | 3.8 | 3 | 0.5 | Ron Gardenhire |
| Rob Refsnyder | .253 | .325 | .392 | 89 | .139 | .329 | 4.6 | 0 | 0.4 | Shane Spencer |
| Kevin Plawecki | .256 | .330 | .384 | 89 | .128 | .300 | 4.6 | -2 | 0.4 | Jerry Grote |
| Jackie Bradley Jr. | .220 | .293 | .366 | 74 | .146 | .294 | 3.8 | 3 | 0.3 | Eric Fox |
| Danny Santana | .247 | .297 | .456 | 96 | .208 | .312 | 4.9 | -1 | 0.2 | Chris Jones |
| Connor Wong | .226 | .274 | .402 | 76 | .177 | .320 | 3.9 | -2 | 0.2 | Lee Evans |
| Chad De La Guerra | .226 | .290 | .387 | 78 | .160 | .299 | 4.0 | 1 | 0.2 | Seth Bynum |
| Taylor Motter | .218 | .298 | .394 | 82 | .176 | .264 | 4.0 | 0 | 0.2 | Tom Brookens |
| Ronaldo Hernández | .239 | .275 | .393 | 74 | .154 | .279 | 3.8 | -2 | 0.1 | Scott Ackerman |
| Joey Meneses | .254 | .303 | .406 | 86 | .152 | .306 | 4.4 | 2 | 0.1 | Tim Costo |
| Ryan Fitzgerald | .231 | .286 | .363 | 71 | .132 | .294 | 3.5 | 1 | 0.0 | Tripp Cromer |
| Franchy Cordero | .237 | .304 | .404 | 86 | .167 | .333 | 4.5 | -2 | 0.0 | Marvin Garrison |
| Jack López | .242 | .287 | .361 | 71 | .119 | .305 | 3.9 | 0 | -0.1 | Steve Sisco |
| Nick Sogard | .240 | .298 | .350 | 72 | .110 | .290 | 3.7 | 1 | -0.1 | Erik Laseke |
| Jeter Downs | .213 | .273 | .369 | 68 | .156 | .275 | 3.7 | -2 | -0.1 | Jayson Nix |
| Grant Williams | .248 | .290 | .329 | 64 | .082 | .281 | 3.3 | 4 | -0.2 | Luis Ordaz |
| Ricardo Cubillan | .213 | .297 | .303 | 61 | .090 | .281 | 3.0 | 0 | -0.2 | Manuel Ferrer |
| Michael Gettys | .201 | .254 | .380 | 65 | .179 | .287 | 3.3 | 4 | -0.2 | Barry Wesson |
| Chris Herrmann | .211 | .291 | .347 | 69 | .136 | .293 | 3.5 | -2 | -0.2 | Jerry Goff |
| Cameron Cannon | .246 | .289 | .371 | 73 | .124 | .281 | 3.8 | -2 | -0.2 | Brent Butler |
| Josh Ockimey | .207 | .313 | .388 | 85 | .181 | .292 | 4.1 | -1 | -0.2 | Steve Carver |
| Jett Bandy | .211 | .274 | .350 | 64 | .139 | .267 | 3.2 | -2 | -0.3 | Chad Moeller |
| Jeremy Rivera | .233 | .279 | .325 | 60 | .092 | .292 | 3.3 | 0 | -0.3 | Milko Jaramillo |
| Devlin Granberg | .246 | .301 | .381 | 80 | .135 | .299 | 4.1 | -1 | -0.4 | Dionys Cesar |
| Hudson Potts | .220 | .265 | .357 | 63 | .137 | .302 | 3.3 | 2 | -0.4 | Matthew Moses |
| Kole Cottam | .210 | .280 | .347 | 65 | .137 | .301 | 3.2 | -4 | -0.5 | Yohanny Valera |
| Johan Mieses | .211 | .278 | .374 | 71 | .163 | .260 | 3.6 | 1 | -0.5 | Garrick Haltiwanger |
| Pedro Castellanos | .248 | .297 | .375 | 77 | .127 | .293 | 3.8 | -2 | -0.7 | Sergio Cairo |
| Tyreque Reed | .218 | .287 | .370 | 73 | .152 | .298 | 3.6 | 0 | -0.8 | Dustin Brisson |
| Tanner Nishioka | .221 | .275 | .329 | 59 | .108 | .314 | 3.1 | -6 | -1.0 | Chad Spann |
| Tate Matheny | .208 | .260 | .331 | 56 | .123 | .305 | 3.0 | 0 | -1.1 | Jamar Hill |
| Wil Dalton | .182 | .242 | .306 | 44 | .124 | .240 | 2.4 | 3 | -1.6 | B.J. Garbe |
| Jeisson Rosario | .218 | .293 | .312 | 61 | .094 | .297 | 3.1 | -12 | -1.8 | Jason Denham |
| Player | T | Age | W | L | ERA | G | GS | IP | H | ER | HR | BB | SO | FIP |
|---|---|---|---|---|---|---|---|---|---|---|---|---|---|---|
| Nathan Eovaldi | R | 32 | 11 | 6 | 3.73 | 29 | 27 | 154.3 | 149 | 64 | 18 | 37 | 166 | 3.38 |
| Chris Sale | L | 33 | 7 | 4 | 3.53 | 18 | 18 | 91.7 | 80 | 36 | 11 | 25 | 116 | 3.29 |
| Nick Pivetta | R | 29 | 9 | 8 | 4.89 | 32 | 27 | 143.7 | 137 | 78 | 23 | 58 | 148 | 4.52 |
| James Paxton | L | 33 | 6 | 5 | 4.47 | 17 | 17 | 86.7 | 86 | 43 | 13 | 30 | 95 | 4.01 |
| Garrett Whitlock | R | 26 | 7 | 4 | 3.87 | 37 | 5 | 76.7 | 72 | 33 | 8 | 25 | 77 | 3.66 |
| Tanner Houck | R | 26 | 6 | 5 | 4.62 | 27 | 20 | 97.3 | 92 | 50 | 14 | 38 | 105 | 4.25 |
| Rich Hill | L | 42 | 6 | 6 | 4.93 | 25 | 24 | 118.7 | 119 | 65 | 20 | 40 | 103 | 4.90 |
| Garrett Richards | R | 34 | 6 | 5 | 4.84 | 31 | 18 | 109.7 | 116 | 59 | 17 | 41 | 94 | 4.68 |
| Bryan Mata | R | 23 | 8 | 7 | 4.88 | 22 | 22 | 101.3 | 103 | 55 | 13 | 50 | 86 | 4.81 |
| Josh Winckowski | R | 24 | 7 | 7 | 5.06 | 24 | 23 | 112.0 | 124 | 63 | 15 | 40 | 77 | 4.78 |
| Victor Santos | R | 21 | 6 | 5 | 4.70 | 24 | 13 | 84.3 | 91 | 44 | 12 | 24 | 62 | 4.56 |
| Kutter Crawford | R | 26 | 7 | 7 | 4.98 | 22 | 22 | 97.7 | 101 | 54 | 14 | 43 | 97 | 4.53 |
| Adam Ottavino | R | 36 | 6 | 3 | 3.65 | 63 | 0 | 56.7 | 46 | 23 | 5 | 33 | 70 | 3.82 |
| Matt Barnes | R | 32 | 7 | 4 | 3.79 | 60 | 1 | 54.7 | 42 | 23 | 7 | 28 | 78 | 3.64 |
| Michael Wacha | R | 30 | 5 | 4 | 5.21 | 27 | 22 | 112.3 | 127 | 65 | 20 | 34 | 100 | 4.70 |
| Raynel Espinal | R | 30 | 7 | 7 | 5.20 | 23 | 18 | 98.7 | 104 | 57 | 16 | 37 | 84 | 4.83 |
| Martín Pérez | L | 31 | 8 | 7 | 5.28 | 32 | 22 | 116.0 | 132 | 68 | 18 | 46 | 89 | 4.98 |
| Zack Kelly | R | 27 | 4 | 3 | 4.28 | 32 | 4 | 54.7 | 52 | 26 | 6 | 24 | 54 | 4.11 |
| John Schreiber | R | 28 | 4 | 3 | 4.54 | 43 | 6 | 67.3 | 70 | 34 | 9 | 25 | 62 | 4.32 |
| Brayan Bello | R | 23 | 5 | 5 | 5.43 | 21 | 21 | 111.0 | 123 | 67 | 19 | 43 | 79 | 5.28 |
| Jay Groome | L | 23 | 6 | 6 | 5.30 | 20 | 20 | 88.3 | 94 | 52 | 14 | 38 | 74 | 5.03 |
| Connor Seabold | R | 26 | 4 | 4 | 5.15 | 16 | 16 | 71.7 | 76 | 41 | 11 | 25 | 60 | 4.71 |
| Josh Taylor | L | 29 | 2 | 1 | 3.93 | 61 | 0 | 52.7 | 46 | 23 | 6 | 22 | 64 | 3.65 |
| Darwinzon Hernandez | L | 25 | 3 | 2 | 3.97 | 54 | 0 | 45.3 | 34 | 20 | 5 | 29 | 65 | 3.93 |
| Chris Murphy | L | 24 | 6 | 6 | 5.44 | 21 | 20 | 91.0 | 99 | 55 | 17 | 37 | 77 | 5.33 |
| Hirokazu Sawamura | R | 34 | 3 | 2 | 4.06 | 51 | 0 | 51.0 | 44 | 23 | 6 | 28 | 60 | 4.18 |
| Andrew Politi | R | 26 | 7 | 7 | 5.28 | 24 | 13 | 75.0 | 78 | 44 | 10 | 42 | 66 | 4.99 |
| Ryan Brasier | R | 34 | 3 | 2 | 3.96 | 42 | 0 | 38.7 | 37 | 17 | 5 | 13 | 37 | 4.03 |
| Zac Grotz | R | 29 | 3 | 3 | 4.83 | 23 | 5 | 50.3 | 53 | 27 | 7 | 17 | 41 | 4.61 |
| Hansel Robles | R | 31 | 4 | 3 | 4.50 | 67 | 0 | 64.0 | 60 | 32 | 10 | 27 | 68 | 4.45 |
| Alex Claudio | L | 30 | 2 | 1 | 4.50 | 57 | 1 | 50.0 | 54 | 25 | 5 | 18 | 37 | 4.26 |
| Eduard Bazardo | R | 26 | 3 | 3 | 4.86 | 24 | 3 | 46.3 | 48 | 25 | 8 | 17 | 42 | 4.91 |
| Frank German | R | 24 | 6 | 6 | 5.62 | 24 | 18 | 83.3 | 96 | 52 | 14 | 35 | 54 | 5.51 |
| Austin Davis | L | 29 | 2 | 2 | 4.56 | 47 | 0 | 51.3 | 48 | 26 | 6 | 25 | 54 | 4.23 |
| Rio Gomez | L | 27 | 2 | 1 | 4.59 | 32 | 0 | 49.0 | 50 | 25 | 6 | 20 | 43 | 4.42 |
| Seth Blair | R | 33 | 3 | 2 | 4.71 | 27 | 1 | 36.3 | 36 | 19 | 5 | 17 | 34 | 4.67 |
| Daniel Gossett | R | 29 | 5 | 6 | 5.75 | 18 | 16 | 81.3 | 94 | 52 | 14 | 37 | 58 | 5.50 |
| Brandon Workman | R | 33 | 3 | 3 | 4.63 | 46 | 0 | 44.7 | 40 | 23 | 7 | 27 | 49 | 4.90 |
| Brian Keller | R | 28 | 3 | 4 | 5.64 | 23 | 13 | 67.0 | 73 | 42 | 11 | 35 | 57 | 5.36 |
| Michael Feliz | R | 29 | 3 | 2 | 4.78 | 49 | 1 | 49.0 | 48 | 26 | 7 | 20 | 51 | 4.30 |
| Dominic LoBrutto | L | 26 | 2 | 2 | 4.70 | 34 | 0 | 44.0 | 48 | 23 | 5 | 16 | 33 | 4.45 |
| Brad Peacock | R | 34 | 3 | 4 | 5.63 | 22 | 11 | 54.3 | 57 | 34 | 11 | 22 | 51 | 5.31 |
| Austin Brice | R | 30 | 2 | 2 | 5.01 | 41 | 2 | 46.7 | 46 | 26 | 7 | 21 | 44 | 4.98 |
| Kyle Hart | L | 29 | 7 | 9 | 5.89 | 23 | 20 | 107.0 | 125 | 70 | 20 | 46 | 78 | 5.58 |
| Jose Adames | R | 29 | 1 | 1 | 4.78 | 32 | 0 | 32.0 | 31 | 17 | 5 | 15 | 31 | 4.87 |
| Matt Hall | L | 28 | 4 | 4 | 5.50 | 34 | 6 | 73.7 | 81 | 45 | 11 | 37 | 66 | 5.00 |
| Caleb Simpson | R | 30 | 2 | 2 | 4.91 | 21 | 0 | 22.0 | 20 | 12 | 3 | 14 | 24 | 4.82 |
| Brandon Brennan | R | 30 | 3 | 3 | 5.01 | 38 | 0 | 46.7 | 48 | 26 | 6 | 21 | 38 | 4.70 |
| Geoff Hartlieb | R | 28 | 3 | 3 | 5.11 | 40 | 0 | 49.3 | 50 | 28 | 5 | 29 | 48 | 4.50 |
| Durbin Feltman | R | 25 | 4 | 4 | 5.14 | 42 | 0 | 49.0 | 49 | 28 | 7 | 25 | 46 | 4.87 |
| Kaleb Ort | R | 30 | 2 | 2 | 5.16 | 40 | 0 | 45.3 | 43 | 26 | 6 | 28 | 50 | 4.75 |
| Joan Martinez | R | 25 | 2 | 2 | 5.22 | 34 | 0 | 39.7 | 38 | 23 | 5 | 27 | 40 | 5.00 |
| Phillips Valdez | R | 30 | 3 | 3 | 5.65 | 41 | 6 | 71.7 | 78 | 45 | 12 | 37 | 61 | 5.45 |
| Bobby Poyner | L | 29 | 2 | 2 | 5.48 | 34 | 1 | 42.7 | 46 | 26 | 9 | 16 | 39 | 5.43 |
| Colten Brewer | R | 29 | 2 | 3 | 5.74 | 33 | 1 | 42.3 | 45 | 27 | 8 | 23 | 38 | 5.61 |
| Player | K/9 | BB/9 | HR/9 | BB% | K% | BABIP | ERA+ | ERA- | WAR | No. 1 Comp |
|---|---|---|---|---|---|---|---|---|---|---|
| Nathan Eovaldi | 9.7 | 2.2 | 1.0 | 5.7% | 25.7% | .313 | 126 | 80 | 3.2 | Shane Reynolds |
| Chris Sale | 11.4 | 2.5 | 1.1 | 6.5% | 30.3% | .309 | 133 | 75 | 2.1 | Dutch Leonard |
| Nick Pivetta | 9.3 | 3.6 | 1.4 | 9.3% | 23.8% | .295 | 96 | 104 | 1.4 | Kevin Foster |
| James Paxton | 9.9 | 3.1 | 1.4 | 8.1% | 25.6% | .315 | 105 | 95 | 1.4 | Andy Pettitte |
| Garrett Whitlock | 9.0 | 2.9 | 0.9 | 7.7% | 23.6% | .302 | 121 | 83 | 1.3 | Brad Clontz |
| Tanner Houck | 9.7 | 3.5 | 1.3 | 9.0% | 24.9% | .301 | 101 | 99 | 1.2 | Joe Cowley |
| Rich Hill | 7.8 | 3.0 | 1.5 | 7.8% | 20.0% | .289 | 95 | 105 | 1.2 | Tim Wakefield |
| Garrett Richards | 7.7 | 3.4 | 1.4 | 8.5% | 19.5% | .304 | 97 | 103 | 1.1 | Mike Boddicker |
| Bryan Mata | 7.6 | 4.4 | 1.2 | 11.0% | 18.9% | .299 | 96 | 104 | 1.1 | Mike Payne |
| Josh Winckowski | 6.2 | 3.2 | 1.2 | 8.0% | 15.5% | .304 | 93 | 108 | 1.0 | Cha Seung Baek |
| Victor Santos | 6.6 | 2.6 | 1.3 | 6.6% | 16.9% | .299 | 100 | 100 | 1.0 | John Hope |
| Kutter Crawford | 8.9 | 4.0 | 1.3 | 9.9% | 22.3% | .315 | 94 | 106 | 0.9 | Angel Guzman |
| Adam Ottavino | 11.1 | 5.2 | 0.8 | 13.2% | 28.0% | .297 | 128 | 78 | 0.8 | Jeff Nelson |
| Matt Barnes | 12.8 | 4.6 | 1.2 | 12.0% | 33.5% | .297 | 124 | 81 | 0.8 | Mark Clear |
| Michael Wacha | 8.0 | 2.7 | 1.6 | 6.9% | 20.3% | .318 | 90 | 111 | 0.8 | Brian Sweeney |
| Raynel Espinal | 7.7 | 3.4 | 1.5 | 8.5% | 19.4% | .300 | 90 | 111 | 0.7 | Chris Brock |
| Martín Pérez | 6.9 | 3.6 | 1.4 | 8.8% | 17.0% | .313 | 89 | 112 | 0.7 | Kent Mercker |
| Zack Kelly | 8.9 | 4.0 | 1.0 | 10.0% | 22.6% | .303 | 110 | 91 | 0.6 | Jay Robertson |
| John Schreiber | 8.3 | 3.3 | 1.2 | 8.5% | 21.0% | .311 | 103 | 97 | 0.6 | Hipolito Pichardo |
| Brayan Bello | 6.4 | 3.5 | 1.5 | 8.7% | 16.0% | .298 | 86 | 116 | 0.6 | Nate Minchey |
| Jay Groome | 7.5 | 3.9 | 1.4 | 9.6% | 18.7% | .302 | 89 | 113 | 0.6 | Justin Thompson |
| Connor Seabold | 7.5 | 3.1 | 1.4 | 7.9% | 19.0% | .302 | 91 | 110 | 0.6 | Felix Diaz |
| Josh Taylor | 10.9 | 3.8 | 1.0 | 9.7% | 28.3% | .305 | 119 | 84 | 0.6 | Will Ohman |
| Darwinzon Hernandez | 12.9 | 5.8 | 1.0 | 14.4% | 32.3% | .296 | 118 | 85 | 0.5 | John Rocker |
| Chris Murphy | 7.6 | 3.7 | 1.7 | 9.1% | 18.9% | .303 | 86 | 116 | 0.5 | Scott Lewis |
| Hirokazu Sawamura | 10.6 | 4.9 | 1.1 | 12.4% | 26.7% | .297 | 116 | 87 | 0.5 | Jason Kershner |
| Andrew Politi | 7.9 | 5.0 | 1.2 | 12.2% | 19.2% | .306 | 89 | 113 | 0.4 | Clint Nageotte |
| Ryan Brasier | 8.6 | 3.0 | 1.2 | 7.9% | 22.6% | .296 | 119 | 84 | 0.4 | Donn Pall |
| Zac Grotz | 7.3 | 3.0 | 1.3 | 7.7% | 18.6% | .303 | 97 | 103 | 0.4 | Jack Cressend |
| Hansel Robles | 9.6 | 3.8 | 1.4 | 9.7% | 24.5% | .294 | 104 | 96 | 0.3 | Richie Lewis |
| Alex Claudio | 6.7 | 3.2 | 0.9 | 8.1% | 16.7% | .310 | 104 | 96 | 0.3 | Jason Kershner |
| Eduard Bazardo | 8.2 | 3.3 | 1.6 | 8.3% | 20.6% | .299 | 97 | 104 | 0.3 | Mark Brandenburg |
| Frank German | 5.8 | 3.8 | 1.5 | 9.2% | 14.2% | .303 | 84 | 120 | 0.3 | Dan Smith |
| Austin Davis | 9.5 | 4.4 | 1.1 | 11.0% | 23.8% | .302 | 103 | 97 | 0.2 | Ed Glynn |
| Rio Gomez | 7.9 | 3.7 | 1.1 | 9.3% | 19.9% | .306 | 102 | 98 | 0.2 | Wilson Guzman |
| Seth Blair | 8.4 | 4.2 | 1.2 | 10.6% | 21.1% | .301 | 100 | 100 | 0.2 | Bryce Florie |
| Daniel Gossett | 6.4 | 4.1 | 1.5 | 9.9% | 15.5% | .308 | 82 | 123 | 0.2 | Dennis Tankersley |
| Brandon Workman | 9.9 | 5.4 | 1.4 | 13.6% | 24.6% | .287 | 101 | 99 | 0.2 | John Hudek |
| Brian Keller | 7.7 | 4.7 | 1.5 | 11.4% | 18.5% | .308 | 83 | 120 | 0.2 | Mike York |
| Michael Feliz | 9.4 | 3.7 | 1.3 | 9.3% | 23.8% | .306 | 98 | 102 | 0.1 | Greg Jones |
| Dominic LoBrutto | 6.8 | 3.3 | 1.0 | 8.2% | 16.8% | .309 | 100 | 100 | 0.1 | Dana Allison |
| Brad Peacock | 8.4 | 3.6 | 1.8 | 9.1% | 21.2% | .299 | 83 | 120 | 0.1 | Craig McMurtry |
| Austin Brice | 8.5 | 4.1 | 1.4 | 10.0% | 21.0% | .295 | 94 | 107 | 0.1 | Mike Butcher |
| Kyle Hart | 6.6 | 3.9 | 1.7 | 9.4% | 16.0% | .309 | 80 | 126 | 0.1 | Huck Flener |
| Jose Adames | 8.7 | 4.2 | 1.4 | 10.6% | 21.8% | .292 | 98 | 102 | 0.1 | Chad Harville |
| Matt Hall | 8.1 | 4.5 | 1.3 | 10.9% | 19.5% | .318 | 85 | 117 | 0.0 | Dennis Powell |
| Caleb Simpson | 9.8 | 5.7 | 1.2 | 14.0% | 24.0% | .293 | 96 | 105 | 0.0 | John Briscoe |
| Brandon Brennan | 7.3 | 4.1 | 1.2 | 10.1% | 18.3% | .298 | 94 | 107 | 0.0 | John Kiely |
| Geoff Hartlieb | 8.8 | 5.3 | 0.9 | 12.8% | 21.1% | .317 | 92 | 109 | -0.1 | Mike MacDougal |
| Durbin Feltman | 8.4 | 4.6 | 1.3 | 11.3% | 20.8% | .300 | 91 | 110 | -0.1 | Blaine Neal |
| Kaleb Ort | 9.9 | 5.6 | 1.2 | 13.5% | 24.2% | .308 | 91 | 110 | -0.1 | Reggie Harris |
| Joan Martinez | 9.1 | 6.1 | 1.1 | 14.8% | 21.9% | .303 | 90 | 111 | -0.1 | Josh Banks |
| Phillips Valdez | 7.7 | 4.6 | 1.5 | 11.2% | 18.4% | .307 | 83 | 120 | -0.1 | William Ormond |
| Bobby Poyner | 8.2 | 3.4 | 1.9 | 8.4% | 20.5% | .301 | 86 | 117 | -0.1 | Shawn Barton |
| Colten Brewer | 8.1 | 4.9 | 1.7 | 11.9% | 19.6% | .301 | 82 | 122 | -0.2 | Keith Shepherd |
Players are listed with their most recent teams wherever possible. This includes players who are unsigned, players who will miss 2022 due to injury, and players who were released in 2021. So yes, if you see Joe Schmoe, who quit baseball back in August to form a big band orchestra that only plays nu-metal versions of baroque cantatas, he’s still listed here intentionally. ZiPS is assuming a league with an ERA of 4.36, similar to the post-June substance-enforcement environment.
Both hitters and pitchers are ranked by projected zWAR, which is to say, WAR values as calculated by me, Dan Szymborski, whose surname is spelled with a z. WAR values might differ slightly from those that appear in the full release of ZiPS. Finally, I will advise anyone against — and might karate chop anyone guilty of — merely adding up WAR totals on a depth chart to produce projected team WAR. ZiPS is assuming that the designated hitter will continue in force in 2022.
ZiPS is agnostic about future playing time by design. For more information about ZiPS, please refer to this article, or get angry at Dan on Twitter.
Dan Szymborski is a senior writer for FanGraphs and the developer of the ZiPS projection system. He was a writer for ESPN.com from 2010-2018, a regular guest on a number of radio shows and podcasts, and a voting BBWAA member. He also maintains a terrible Twitter account at @DSzymborski.
I don’t know what Tanner Houck has to do to convince everyone that he should get a rotation slot, but ZiPs is down on him, Eric thought his splitter wasn’t good enough for him to start and the Red Sox signed the Rays’ leftovers from last year (Hill, Wacha) which means there’s a decent chance he won’t start in the rotation. Normally you would think that this means he hasn’t shown results but he has fairly regularly gone 4-5 innings and done well. So I guess we’ll have to wait to find out how he would hold up over a full season.
I also suspect that Whitlock might be capable of starting long-term. I would guess they’re probably not going to experiment with that this year because they went ahead and signed a bunch of depth options but he has three functional pitches.
Didn’t they say they were going to prepare them both to start through at least part of ST? It’s not like Wacha is much of an impediment
I’m still a little surprised that Wacha got a raise from last year. Dude had a 5.51 xERA. So you’d think he wouldn’t be an impediment but $7M is standard money for a 5th starter.
I have a feeling Wacha was surprised too…
Wacha dropped his cutter, changing his pitch mix, at the end of the season. His peripherals after the change improved greatly.
I too was surprised by the large raise, but I’m sure the late season change of results was the reason.
Eventually, if we keep predicting breakouts based on small samples, we’ll be right. But it’s also true that if we want to slice up someone’s season into roughly 5-week chunks, we can find a lot of small samples to bolster whatever theory we want.
True, but pitchers can and have made dramatic improvements in their results by figuring out how to mix their pitches properly or by picking up a new pitch that works well, The trick is to identify those pitchers getting results because they figured out how to better use their stuff as opposed to those who just had a good run for a bit.
I have a feeling the Sox might try and leverage a lot of their high variability or high injury risk potential starters in shorter bursts in tandem with each other. It seems like a natural progression in the pretty consistent decreasing workload of starters.
Have Eovaldi, Sale and Pivetta getting 5-7 innings (Pivetta likely on the lower end) and then have Houck and Whitlock who the team seems to plan on starting throw 3-5 innings with guys like Wacha, Hill and Paxton once healthy coming in relief with 2-4 innings of their own. It could let guys stuff play up and help manage workloads for injury risks or guys like Houck and Whitlock who aren’t used to running super high pitch counts.
This can be done without putting too much strain on the bullpen since when healthy you’d have 3 guys functioning as extended relievers to account for the starters eating fewer innings.
How many roster spots would this plan need?
This is something I have often wondered about. The Rays keep pushing the limits on it and I assume it’s going to blow up on them but it hasn’t yet. This year there is going to be a 13-pitcher limit, too.
It’s interesting because I actually feel like this seems more intuitive than what the Rays are doing. That potentially comes at the cost of several roster spots while this in theory can take up fewer while boosting flexibility because 3 spots typically filled by single inning relievers are instead filled by multi inning guys. If you pick the right players whose stuff will play up that could be extremely useful.
Even on nights with a normal start this could be extremely useful since the Sox can be much more conservative knowing they’ve got several guys who keep themselves prepared for multi inning stints mid game.
It also provides a convenient path for high level prospects to be more easily integrated into the major league team, they still get multiple innings but aren’t actually expected to give a full start.
The big potential negatives I see are performance and injuries since more innings are tied up by guys who fill multiple. I think there is some legitimacy to the performance question since not every mediocre starter will actually be able to be solid in relief. This isn’t a plan for a team with a great rotation though, it’s one for a team with solid pitching depth that either has a high ceiling with high variability that can be brought down in lower inning stints or is relatively mediocre in talent but also capable of playing up in those low inning stints. On injuries I think it’s unlikely to blow up enough to be a significant problem, but if it did I actually think that might be more easily handled for the same reason it is a convenient path to start getting prospects chances against major league talent. It also pretty much guarantees good starting depth since you’d have 3 active players capable of spot starts.
I think it comes down to how many innings you get out of each guy. I see 5 guys in the low pitch count multi inning group and ordinarily those spots would be filled by 2 starters and 3 relievers. For your 4 and 5 starters I’d say 5 innings is a fair standard estimate and for the 3 relievers you get an inning each, so in total you could expect about 13 innings from those spots. If everyone averaged their low end innings expectation I listed this would fill 12 innings, so even conservatively (with health) it only requires 1 extra single inning reliever while in practice I’d expect you’d realistically save roster spots since guys are likely to at least be in the middle of those estimates (again, with health).
There would be an added issue that the team would have more players who cost them a chunk of innings if they get hurt or underperformed which could either require greater strain on the bullpen. If we assume guys average the middle of the innings estimates I gave but remove one of the 2-4 innings pitchers that actually covers 14 innings, so assuming guys throw more than a very conservative estimate you’d actually need multiple players hurt before this plan started making roster building more challenging.
What that leaves out is I also think this plan would make multi inning guys/starters much more easily replaceable than they are currently. Now when a starter gets hurt if you don’t have the active depth you need to call someone up, with this plan if a top end starter gets hurt you’ve got several legit major league pitchers to stretch out for spot starts. To replace them you would then call someone up, but instead of expecting a start from them all you really need is something in that 2-4 inning range which will likely be easier for an inexperienced player.
The greatest waste of arms is the up and down in bullpens. The Sox largly avoided that with Whitlock and Houck, all credit to the plan but it spoke for their success also. To extend them out to more innings they could schedule them to pitch, even start, three or four innings. Thee every fourth game, adding in scheduled days off, is 8 plus appearances a month, 25 innings, 48 appearances 150 controlled innings for the season, providing regularity plus only one time plus through the lineup. Four innings every fifth game gives similar innings. The three top starters are unlikely to get well beyond 150 innings, and the next lesser three will go well below that, so 300 innings from the two would take pressure off the bullpen by itself and give Houck and Whitlock opportunity to develop.
That Casas and Dalbec are projected roughly the same season doesn’t sound great. I think Casas could be notably better than this if he gets 450 at bats though. I’m actually a little surprised ZiPS doesn’t like him more for this year.
I was fairly positive on the Red Sox heading into last year, even though the consensus among fans and media was they’d struggle to play .500 and finish above 4th. I had them targeted for third, a winning record and challenging for a playoff spot, but falling short. They exceeded even my expectations.
My concern this year is health. I don’t see their starters taking the mound as consistently. It’s an underrated aspect of team evaluation by many. Health is a skill and the 2021 Red Sox had it. Yes, I know they were hit by a Covid outbreak, but so was the team they tied with, the Yankees, who seemingly were dealing with outbreak cases all season. Let’s hope 2022 brings us a season that is mostly Covid free. I like Whitlock, but I’m not expecting a repeat. A good but not great Whitlock weakens them slightly. Their pen should still be good, but probably a tick worse. They will miss E-Rod. None of this sounds like a big issue, unless you realize they tied with a team that greatly underperformed at the plate. Will that happen again?
Overall, I’m with Dan’s projection. A mid-80s win team, but that probably doesn’t get them out of 4th. To state the obvious, they’ll need to make a few moves post lockout. I suspect they will, but so will the Yankees, and the Blue Jays are a rising force.
If the Blue Jays wind up with another reliever to complement Romano / Mayza then I think they’re the obvious favorites in the AL East. With Manoah establishing himself and Gausman and Berrios on board the rotation is no longer as dependent on Ryu’s health. They could also get another infield bat to bump Espinal back into a utility role although I’m not sure they’d be in the market for Bryant or Story unless their market collapses.
I’m waiting to do my own evaluation on the Jays, figuring they still have a couple moves in them. My biggest question revolves around the losses of Semien and Ray, who contributed 14 rWAR. Will a full season of Berrios and Manoah , along with Gausman compensate? I’ve got to believe they’ll have more luck with their bullpen.
The division will be brutal. Two of the better teams in MLB may not even make the postseason, although we’ll probably have expanded postseason teams with the next CBA.
By BaseRuns the Jays got pretty unlucky last year and the Red Sox and Yankees overperformed. That could be bullpen-related but with McHugh, Tepera, and Chafin still available there are actually some solid options still left. Losing Semien definitely hurts, but they’ll probably have Springer for another couple hundred PAs. They could use another left handed bat and another infielder but I’d be surprised if they were going to hand out another $100M+ contract. Maybe they take a guy with a big contract off someone’s hands.
I thought the Jays should’ve been all over Escobar but alas…
I’ve given up betting against the Rays. They had no meaningful losses and are gaining a full season of Franco. They’re the favorites until proven otherwise
I would think that the Rays are the other main contender. The reason I don’t think they will be the favorites is that I think the Blue Jays are ridiculously talented, they probably not done adding, and the Rays are probably going to subtract. I expect that Kiermaier is gone after the lockout, and probably one or both of Margot / Meadows. But they should be able to contend for the division with an outfield of Arozarena, Lowe, Phillips, and whoever they get to platoon with Phillips (which may be Margot, but could be Brujan), plus they’ll potentially get Glasnow back.
I’d like to point out that this is a really weird looking baseball team that is somehow a perfect encapsulation of New England. Physically speaking. Devers and Dalbec look like 15 year olds, their ace is Lefty Slender Man, they’re playing Rittz in right field and Christian Vazquez has more freckles than 3 counties of Ireland. #notgraphs
lol cant upvote this enough.
My biggest shock of this article though, was that Ryan Sweeney put up a nearly 4 WAR season while hitting only 6 HR and swiping 6 bags. Betting Alex Verdugo wouldn’t be thrilled at that season, but it’d be by far his best
Sweeney got rave reviews for defense that year. Verdugo can’t count on that. Sweeney never came close again
There are a few issued in Dan’s/ZIPs assessment:
– The Red Sox still view Whitlock as a starter long term. He was forced to be a reliever due to rule 5 draft rules and the inability to stretch him out. He may remain a reliever this year due to the 7 other starters, but he should be viewed as starter depth and remove the need for additional depth.
– The bullpen’s lack of back-end talent is greatly undersold in the article. It’s a definite need and Chaim Bloom has admitted as much. While possible the Red Sox convert a starter to fill this need, expect them to pickup another high-ish-end reliever this off-season.
– Although he mentioned it, Dan didn’t elaborate on how night-and-day the high minors pitching depth was from last year to this year. There are loads of arms now with the upside to step in and contribute, but they all have question marks.
– Verdugo was in LF last year and the general assumption is that he continues there this year. But that requires another signing capable of playing/starting in RF. This seems to be Red Sox plan A, with a move of Verdugo to RF as a secondary plan.
– To elaborate on the additional bench needs. The Red Sox should be expected to sign a LH 1st baseman as they don’t have one available until Casas is promoted. There’s also a strong chance of a middle-infielder being signed (likely after injured 40-man guys go on the 60-day IL) as Arrauz may not be ready for that role.
I do have two questions regarding negative ZIPs rankings.
– Houck has greatly, and consistently, outperformed his ZIPs projections. Is the regression an over reliance on his pre-2020 numbers? That seems rather short sighted imo. That being said, Houck can’t go 3 times through a lineup at this point.
– Casas was at his best in the Arizona fall league and the Olympics. These were smaller samples, but were against high-ish levels of competition and the two breaks from the Olympics caused slumps in the minors. Does ZIPs account for the Olympics and AFL?
ZiPS is neutral on usage until it’s more of a sure thing.
I use the FG depth charts at this point in the season. The eventual OF alignment requires knowing who will be there!
Houck has 86 innings in the majors, so I’m not sure how he could consistently outperform his projections. Though I guess you could argue his translation in 2019 was better than his projection.
But either way, outperforming/underperforming in ZiPS has historically had zero predictive value. And it’s too bad that’s not the case because this would be an easy way to improve projections if it were the case.
AFL yes, Olympics no. The cause-and-effect is extremely speculative, however.
Gang, please don’t vote down Matt for disagreeing with things.
Thanks for the response Dan – appreciate the added insights.
Do you find that this year is more frustrating than usual due to the delay in signings? I don’t have the data to support this, but I assume there are more position openings and unsigned free agents (who will be signed) than usual at this time.
The main gripe I have regarding the ZIPs Houck expectations is the low K rate. He has 3 small samples (2 MLB; 1 AAA) over the last two years and they have each shown a k/9 above 11. Does ZIPs add weight to multiple small samples, or does it view the innings equally whether it be one sample or multiple?
Agreed on Casas – there’s no definitive reason to believe the slumps should have a lesser weight, but as a fan, it gives reason for optimism!
One last question – what level of weight does ZIPs give an AFL PA as opposed to a AAA PA in the same season? (Apologies if that’s getting too deep in the methodology)
It seems like more people comp to Pettitte and Mike Epstein than I thought
Love that David Hamilton projection. 67 OPS+ but 33 SB/5 CS with +7 defense is giving me eighties shortstop flashbacks.
Just curious how the defensive component is arrived at for minor league guys? Hamilton’s +7 projection is just below Andrelton (+9), even with Ahmed (+7) and higher than Story (+4) who are all established DRS darlings.
Seeing the name John-Ford Griffin makes me want to see a player named Martin-Scorsese Hernandez. Also Chris Hermann’s son should be an NFL quarterback.
The Rich Hill-Wakefield comp is golden
lol almost as perfect as the jdm-jim rice comps.
last year in the comments i said something like ‘the red sox have the highest variance of all the teams. they could 2013 this season or 2020 this season or anywhere in between and i wouldn’t be surprised.’ lol so, yeah, im gonna run that back for this year too. i know: deep, analytical stuff.
To be fair: Wakefield was the best pitcher in MVP 2005.
Also in the original rbi baseball just kidding he wasn’t around that long ago.
I say this because I’m selfish, but, Dan, is there any way you can release Zips better coordinated with the top prospects release. That way we can look at holes in teams and then see who, if anyone, on the farm could potentially fill them. Without waiting. I know this would be tough logistically. Like I said I’m selfish!
Zips projects prospects though? Any prospect that can reasonably be expected to fill a hole on a team will show up in the Zips projections.
Not quite sure what you are actually asking for here. As Vinnie said, any prospects on the Sox farm that are likely to contribute to the major league team in any capacity are already listed in the projections (Casas, Krawford, Seabold, Duran). If you’re asking for it to be coordinated with Eric’s Top Prospect reports, I don’t think you want that as Dan is far ahead of Eric’s schedule and those don’t typically wrap up till mid summer.
I don’t get the hate for Duran (unless he’s still recovering from covid?). I don’t get the love for Darwinzon, either. 4.80 FIP and he still has no idea where his pitches are going.
The Dutch Leonard comp for Sale is bizarre.
Here is the pitcher with one of the highest K% of all time….let’s comp him to a pitcher from 1930
Bosoxforlife checking in after watching nearly every inning of 173 games in 2021. I recall asking Ben Clemens last spring if I was hallucinating when I thought the Red Sox were much better than than the projections and he agreed. As I look back there is not much that surprised me. Only fools couldn’t see that Devers and Bogaerts were going to mash, 2020 was no reason to give up on J.D.Martinez, Verdugo is just fine, Vasquez is better than most catchers and the role players, especially Arroyo and Plawecki, did enough. The surprises were Hernandez, 4.9 bWAR doesn’t even begin to tell the story, and Whitlock, 3.0 bWAR in just 46 appearances was simply consistently excellent, and were the reason the Sox made the playoffs. In today’s game pitching has become a different animal than anything I have seen before. Starters no longer dominate staffs and while Eovaldi, Rodriquez and Pivetta were all solid, and losing ERod is going to hurt, nowhere near enough credit is given to the bullpen. Whitlock has already been mentioned but throw out two early appearances and Josh Taylor was superb, Ottavino never made me nervous, Sawamura did!, but Brasier and Robles were money down the stretch. The forgotten man for 2022 is Barnes. He was terrific until he was used 3 times in 2 days in early August then collapsed. His return to becoming a valuable member of the bullpen is more likely than not. Renfroe will be missed. It was said he only hit poor pitching but since that encompasses about 80% of what passes for pitching nowadays it doesn’t mean much, and ohhh that arm. It won a few games outright and please don’t try and tell me that defensive metrics can tell me how many runners he prevented from advancing. What does 2022 look like at this moment? From this fans viewpoint the team is a little weaker now than last year. The offense still looks good. The core is there and Casas is screaming “I can play” to anyone with one eye. The loss of Rodriquez, his FIP is a truer measure of 2021 than his ERA, and Renfroe hurts as they were key pieces. Sale has not convinced anybody that he is still a stud. Wacha, Hill and Paxton look a lot like Richards and Perez. The key is whether the team can maximize what Houck has to offer. He 2.51 FIP says a lot and he has absolutely never been hit hard consistently while racking up huge strikeout totals and eliciting some of the worst looking swings by many players such as Ronald Acuna, Jr. Is he just a 5 inning pitcher, maybe, but in today’s game even aces, see Blake Snell, are often only 5 inning pitchers. From the first game I saw at Fenway in 1948 through 2022 will be 75 years of cheers and tears and I can’t wait for the season to start.
This is not a criticism, just a note. ZiPS has Bogaerts projected for 3.6 wins. Steamer has him projected for 4.3. Since 2015, Bogaerts has been worth less than 4.6 wins in a full season once, back in 2017. If you pro-rate 2020 he would have been worth over 5. I am generally a strong believer in good projection systems, but I’d take the over.
For whatever reason, while his projections are never bad, ZiPS seems to undershoot the WAR forecast on Bogaerts pretty consistently. My guess is it has something to do with the positional adjustment or defense in general. There might be a difference there between how Fangraphs calculates WAR and how Dan does. Here are Xander’s ZiPS projected WAR vs. actual WAR for the last 3 full seasons:
2021: Projected: 4.1 Actual 5.2
2019: Projected: 3.8 Actual: 6.8
2018: Projected: 3.2 Actual: 4.9
Seems like something is up.
Nothing is up except Bogaerts was consistently better than ZiPS thought he would be.
In 2018, ZiPS projected wrc+ 105 and Bogaerts got wrc+ 133.
In 2019, ZiPS projected OPS+ 114 and Bogaerts got wrc+ 141.
In 2020, ZiPS projected OPS+ 123 and Bogaerts got wrc+ 130.
In 2021, ZiPS projected OPS+ 125 and Bogaerts got wrc+ 130.
First of all, OPS+ and wRC+ are not the same thing, so you are exaggerating the difference here. In 2021 for example his OPS+ was 127 – not materially different from the 125 he was projected to have. ZiPS has actually done a fine job forecasting Bogaerts offense throughout his career. Even this year’s forecast, a .287/.360/.502 line with 26 home runs, is a perfectly fine forecast and about what you should expect.
It’s just the WAR total where something is off, and I think it has something to do with how defense is incorporated. The difference in offensive performance is not nearly enough to justify how Xander has put up nearly 6 more WAR over the 3 season I posted than ZiPS forecasted.
A real conundrum with the left side of the infield. Your two best players are entrenched at positions that they’re not good at. One seemingly easy way to improve the team would be to shift both off of those positions, but doing so could create other problems. Plus, both are very good players who the fans would like to lock up, but those projections say that long term deals would probably be a bad idea.