A League-Wide Update on Pitch Mix

You know what’s important? Pitches. Almost all of the big stuff that happens on a baseball diamond starts with the pitcher pitching. Even Babe Ruth never once hit a home run without somebody throwing a pitch first.
Now that we’re more than a quarter of the way through the 2023 season, let’s take a look at the pitches. Specifically, we’re going to take a look at long-term trends, and talk about the ways in which this year has (or hasn’t) followed them. As such, I need you to prepare yourself for a whole lot of line graphs. In fact, just to drive home how many line graphs are in this article, here’s a bar graph:

Last week we ran 26 regular articles, in addition to chats, podcasts, prospect lists, and power rankings. We’re pretty busy. There were fewer line graphs in those 26 articles than there are in the next couple thousand words.
You know what? Seeing as the only bar graph in the past week is the one you just saw, maybe we should also give a quick update to our little guy.
Much better.
With that out of the way, let’s take a look at our first line graph. This is the overall percentage of pitches thrown this season by pitch type. Once you’ve had a chance to take it in, we’ll break things down by individual pitch type. All of the numbers in this article come courtesy of Baseball Savant.

Fastballs
Pitchers are throwing fewer fastballs this year. That’s nothing new. They’ve been throwing fewer fastballs pretty much every year for the last 15 years. Fastball usage continues to fall, and as of yet, there’s no sign that it’s beginning to find its level. At 48.6%, 2022 was the first time league-wide fastball usage had ever dipped below 50%. This year, it’s at 47.6%.
Over the course of the pitch tracking era, both four-seamers and sinkers have been thrown less often, but sinker usage has fallen faster. As the chart below indicates, their respective share of the fastball pie started leveling out in 2019. Four-seamers still make up roughly 69% of all fastballs, and sinkers 31%:

The changes aren’t limited to how often fastballs are thrown. Their locations have changed as well. For four-seamers, the graph below shows the percentage of pitches that cross the plate at or above 36 inches high. For sinkers, it shows the percentage of pitches below 30 inches. I picked these cutoffs somewhat arbitrarily, but I think the point the graph makes is pretty clear:

In the pitch tracking era, it has become more and more obvious that four-seamers are most effective at the top of the zone. This year, nearly 90% of them crossed the plate at at least 36 inches high. At this point, we can assume that just about any four-seamer in the bottom of the zone is a mistake.
Sinkers have taken a different journey. After peaking in 2019, the share of sinkers that cross the plate above 30 inches has been dropping. The average height of sinkers has followed the same trend. This is purely speculation, but I suspect two things have been going on. The first is that over the entire course of the pitch tracking era, pitchers have been hitting the zone more often with fastballs, and less often with breaking and offspeed stuff. As you can seem from the graph, that trend stopped around 2020:
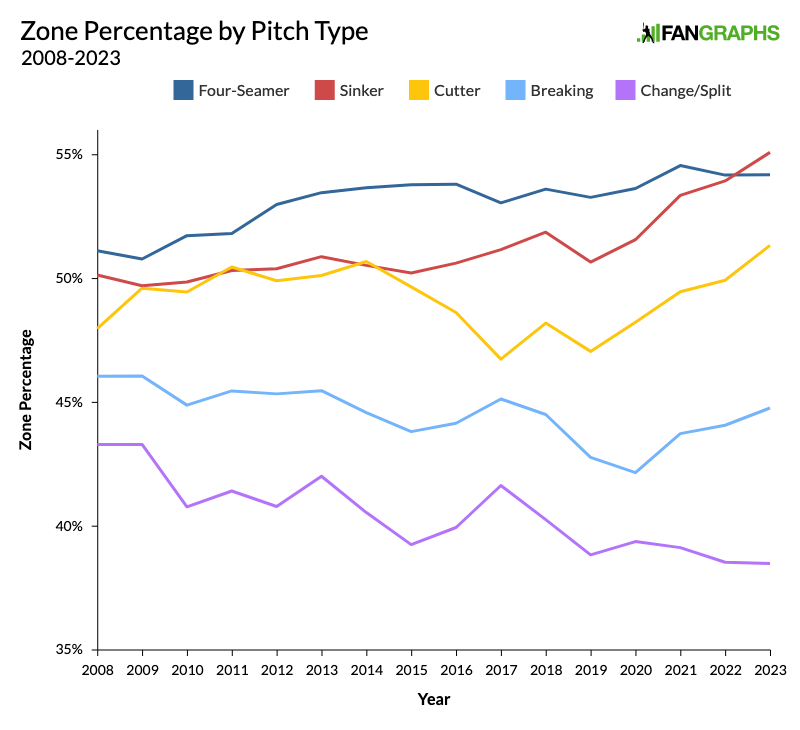
Since then, every pitch has been thrown in the zone more often, except for changeups and splitters, which continued their downward journey, and sinkers, which have more or less leveled off. Coincidence or not, that’s right around the time the public was introduced to the concept of vertical approach angle, which re-emphasized the value of throwing sinkers (especially steep ones) lower and throwing four-seamers (especially flat ones) at the top of the zone.
One last note before we move on to the wide world of non-fastballs. The chart below shows overall performance broken down by pitch type. For each year, each pitch type is charted based on its wOBA (compared to that year’s league average wOBA). It shows pretty clearly why pitchers have been trying to find out just how few fastballs they can get away with. Fastballs are right at the top, where no pitch wants to be:

Cutters
If you noticed during spring training that everyone and their mother seemed to be adding a cutter to their repertoire, you weren’t wrong. Cutter use, which has been rising since 2016, jumped 0.8 percentage points from last year. That’s the biggest leap we’ve seen yet. However, as the graph above demonstrates, cutters have never been less effective. wOBA against cutters is up to .335, a 10-point jump from last year. Run value per 100 pitches is currently at -.004. If these trends continue, in 2024, cutters will have a positive run value for the first time ever (reminder that this is a Run-DMC situation; positive is negative):

Why are pitchers throwing more cutters if they’re not providing results?
First of all, that question is, to some degree, backwards. More pitchers than ever trying out a cutter means more pitchers than ever whose cutter experiment will fail. I would guess that cutter performance will improve slightly over the course of the season, as the pitchers with the worst new cutters decide to scrap them.
The second answer is that pitchers are throwing cutters to set up other pitches. Cutters can tunnel with both fastballs and sliders. Ethan Rendon, Elijah Emery, Will Sugar, and Tieran Alexander put it a little more poetically last year. “Cutters are the living miracle that make sweepers usable and tailing two-seamers effective as well. The purpose of a cutter is to split the plate and bridge extreme gaps in both vertical and horizontal movement between a fastball and slider.”
If your fastball and slider have a big separation in terms of movement, release point, or velocity, they’ll be easy to recognize out of your hand. If the cutter can split that gap, the batter can’t be so sure of what they’re seeing. Every time the batter sees either a fastball or a slider, they have to entertain the possibility that it’s actually a cutter. If it will boost the performance of the fastball-slider combo that you throw 70% of the time, throwing a middle-of-the-road cutter 5% of the time is a no-brainer.
Before, pitchers were more likely to stick with a cutter only if it could succeed on its own. Now it just has to improve other pitches, which means the bar for cutter performance is lower.
Breaking Balls
The sweeper is still the big story in the pitching world. Separating regular sliders from sweepers is a messy business, so I’ll just tell you that so far this year, the average slider breaks 7.6 inches to the pitcher’s glove side, up from seven inches last year and 6.2 inches in 2021. Pitchers are throwing sliders more often, and more of those sliders are sweepers. In case you’re wondering why the sweeper is popular, Ben Clemens did that work for us back in September: “The pitch misses just as many bats as a “regular” slider, and gives up just as many home runs per ball in play. But it gets more soft fly balls and popups, which results in a much lower BABIP and thus much better outcomes for the pitcher.”
However, Ben was quick to note that the sweeper is less effective against opposite-hand hitters. This might be part of the reason for the uptick in cutters. If you choose to make your slider less valuable against opposite-hand hitters, it helps to be able to rely on a cutter, which is less dependent on the platoon advantage.
Thus far, this year’s increase in slider percentage is right in line with the increase from the last few years. There’s no indication that it’s slowing down. However, it’s worth noting that so far, while the effectiveness of the slider has stayed relatively constant, it has taken a different shape over the last couple years. Whiff rates on sliders have fallen in each of the last two seasons, from 17% to 16.5% to 15.9%. No other pitch has seen its whiff rate change half as much. Over that same time period, the slider’s wOBA on balls in play has fallen by 12 points, more than any other pitch.
If you remember the line graph that showed each pitch type’s wOBA compared to league average, you’ll know that up until 2018, the curveball was the most effective pitch in baseball. Since then, the slider, curve, and changeup have all converged in terms of their effectiveness. This year, all three have a wOBA between .281 and .285. However, curves have been used slightly less often, while changeups have held steady and sliders have increased. I suspect this has to do with the fact that pitchers are chasing whiffs more than ever:

Changeups
As you likely noticed from some of the earlier charts, changeups are more effective than they’ve ever been. They have allowed a wOBA of .281 this year, tied with sliders for the lowest among all pitch types. So far, changeup use is holding steady right around 12.9%, as it has for the past four seasons. However, the makeup of those changeups is different this year. I have been grouping changeups and splitters together, but splitters make up 16.5% of all changeups, up from 12.2% last year. I have a hunch that this year’s increase isn’t a fluke (and in case you’re wondering, Kodai Senga’s ghost fork is not responsible for it).
As biomechanics has become a bigger part of pitch design, you’ve likely been hearing more people talking about pitchers as either pronators or supinators. There’s a wide spectrum, but some pitchers tend to be better at supinating when they throw — turning their palm inward as they would when doing a karate chop. Some tend to be better at pronating — turning their palm outward as they would when telling someone to talk to the hand. Pronators tend to have higher release points and greater spin efficiency on their pitches. To put it in the simplest possible terms, supination helps you throw a sweeper, and pronation helps you throw a changeup.
Last year, Chris Langin, Driveline’s Director of Pitching, had a great Twitter thread that goes into much more depth than the description I’m about to give you. If you’re a pitcher who has trouble pronating, you likely don’t throw a changeup (or at least not a good one). More teams are setting up pitching labs and emphasizing biomechanics. As such, they’re more likely than ever to identify supinators and have them try an alternative to a traditional changeup, throwing a splitter or utilizing a slip grip that will work better for the way their body moves. It’s worth noting that there are multiple changeup grips, and some pitches that are classified as changeups by Statcast are certainly the result of these modified grips. However, the increase in splitters is still an indicator that pitchers are finding new ways to throw a changeup, and I suspect that this increase will prove to not be a one-year blip. And that brings us to our last pitch type.
Rasputin’s Cradle
No one has thrown a Rasputin’s Cradle this season. Or ever. That’s because it’s a pitch type invented by a guy I played with in high school. He was a third baseman, and while we were warming up, he would make up the funniest pitch names he could think of, then throw the ball and say, “See if you can handle The Stinky Englishman.” The Stinky Englishman is just an example that I made up. Rasputin’s Cradle is the only fake pitch name I can actually remember. Sadly, it hasn’t yet caught on at the big-league level. One day.
Davy Andrews is a Brooklyn-based musician and a writer at FanGraphs. He can be found on Bluesky @davyandrewsdavy.bsky.social.
Come for the analysis, stay for the graph-ic jokes