A Long-Needed Update on Reliability
It’s been over a year now since Sean Dolinar and I published our article(s) on reliability and uncertainty in baseball stats. When we wrote that, we had the intention of running reliability numbers for even more statistics, including pitching statistics, of which we had included none.
That didn’t happen. So a little while ago, when I was practicing honing my Python skills by rewriting our code in, well, Python (it was originally in R), I figured, “Hey, why not go back and do this for a bunch more stats?” That did happen. Sean was/is swamped making the site infinitely better, though, so I was on my own rewriting the code.
In case you need a refresher, never read our original article, and/or don’t want to now, here’s a quick description of reliability and uncertainty: reliability is a coefficient between 0 and 1 that gives a sense of the consistency of a statistic. A higher reliability means that there’s less uncertainty in the measurement. Reliability will go up with a larger sample size, so the reliability for strikeout rate after 100 plate appearances is going to be much lower than the reliability for strikeout rate at 600. Reliability also changes depending on which stat is being measured. Since strikeout rate is obviously a more talent-based stat than hit-by-pitch rate (well, maybe not for everybody), the reliability is going to be higher for strikeouts given two identical samples. You can think of it like strikeouts “stabilize” quicker than hit-by-pitches.
Reliability can be used to regress a player’s stats to the mean and then to create error bars around that, giving a confidence interval of the player’s true talent. To continue with the strikeout example, I’ll add another point — namely that, the more plate appearances a player has recorded, the closer the estimate of his true talent will be to the strikeout rate he’s running at the time. In fact, strikeout rate is so reliable that, after a full season’s worth of plate appearances, a player’s strikeout rate will probably be almost exactly reflective of his true talent. The same cannot be said for many other stats, like line drive rate, which is mostly random; the reliability for LD% never gets very high, even after a full season’s worth of batted balls.
For information on how to calculate reliability, and more specific details on how it is used, read our original article which was referenced in the first paragraph. I’m not going to go over any of the methodology in great detail, since it’s all in that original post and I didn’t change much. The only real difference is the input data used; instead of using data from 2009-2014, I went with 2013-2015. The few years lost, I found, didn’t make much of a difference, since the samples were plenty adequate. I also wanted to keep the run environment stable, so I avoided stretching the sample over too many years. And, lastly, using fewer years made the code run much quicker.
For Statcast-based stats, I was compelled to use only 2016 data, so I have incomplete seasons. It doesn’t seem to matter too much, and it’s easy to extrapolate what the reliability would be over larger sample sizes. Additionally, for pickoff data, I used 2009-2015.
This update contains a lot of different stats, but some finagling had to be done to include some of them. Any counting stat had to be turned into a rate stat, usually just by dividing by plate appearances. You can’t find the reliability of home runs, but you can find the reliability of home runs per plate appearances, which is really the same thing.
Some stats — specifically ERA, FIP, and xFIP — were particularly difficult, and I’m not really married to how I calculated the reliability. Those three stats would be easier if not for the fact that pitchers don’t always pitch full innings. My first thought was to look only at innings that the pitcher both started and completed, as that would be simplest, but that would be a biased sample of innings: if the pitcher didn’t complete the inning, he likely allowed more runs than if he did complete it. Another idea was to define innings as the time between three outs; so, if a pitcher was pulled after two outs, then got four in his next appearance, the first inning would encapsulate everything that happened from when he was put in in his first appearance until he got the first batter out of his second. The second inning would be everything that happened after he retired the first batter in his second appearance. But this also raised an issue: what if a double play happened when a pitcher was one out away from finishing his “inning”?
An alternative option would be to do it on a game-by-game basis: a pitcher’s ERA in game one was 4.50; in game two, it was 3.00; in game three it was 6.00, etc. How quickly does that stabilize? That method would give the reliability by game — so, after 10 games, a pitcher’s ERA has a reliability of x. I didn’t like that way as much; you’d have to worry about games where the pitcher didn’t record an out — his ERA for the game is undefined, so how does that get incorporated? Additionally, there will always be a much smaller sample of games than just about any other denominator.
In the end, I decided the simplest solution would be not to find the reliability of ERA, but of runs and earned runs allowed per batter. This isn’t necessarily a worse metric than ERA by any means, and it’s much simpler to find its reliability. I did the same for FIP and xFIP, creating a new formula by simple regression that used total batters faced as the denominator instead of innings. These new formulas have nearly perfect correlations with the traditional ones (r=0.97 for FIP and 0.93 for ERA). While there is a little skew because better pitchers face fewer batters per inning, it’s not that big. While this may not be a perfect solution, it’s certainly an adequate one.
There were several stats, unfortunately, that could not be calculated. For example, OPS is composed of multiple denominators; for BsR and UZR, I don’t have the granular play-by-play or game-by-game data. But for most of the commonly used stats that we have here on FanGraphs it’s easy enough to calculate the reliability, though I omitted some of the more obscure PITCHf/x ones metrics because the code takes quite a while to run for pitch-by-pitch data.
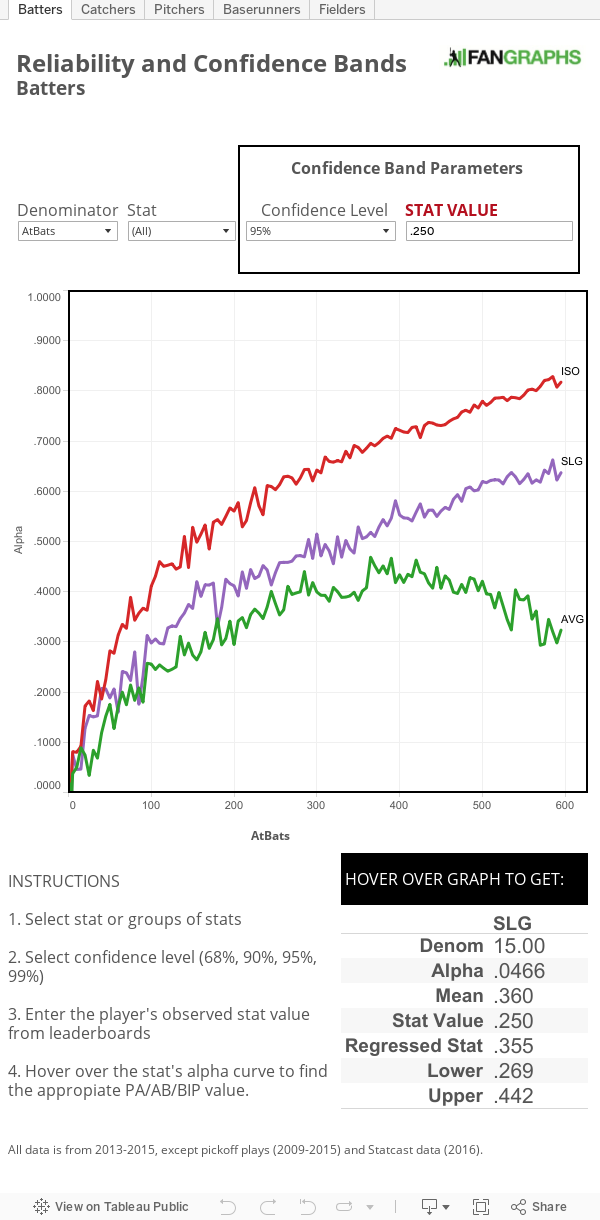
The deliverables, how the results can actually be presented, are a little tricky. I can’t exactly put up a table of all the reliability values for all the different stats, because there are hundreds of values for nearly 150 different stats, and the table would be massive and largely unnecessary. What I’ll present is an interactive tool similar to the one in our last post, made by Sean, that lets you input a player’s numbers and the sample size and calculates a confidence interval — followed by a discussion of some of the more interesting results. And as an added bonus, thanks to Neil Weinberg, the reliability graphs will soon be included in the FanGraphs library under the entries for each stat as a handy reference.
First, the tool. It works in the same way as the last one did, so a full description can be found in our previous article. To briefly reiterate, you select a stat (and now a player type, such as pitcher or batter) and a confidence level, then hover your mouse over the graph corresponding to how big the sample size is. A tooltip will pop up and give you the regressed stat and the confidence interval.
There were some results that particularly interested me. One was LOB%. To find the reliability of LOB%, I had to calculate it a tad differently from how it’s done here on FanGraphs — our leaderboards use a formula, and I needed discrete data. Either method gives you pretty much the same results; it’s just a lot easier to use the formula, which is why that’s what’s used.
But despite the conventional wisdom that strand rate is entirely luck, there seems to be some skill involved. After just 50 or so base-runners, the reliability is 0.45, which isn’t all that low. It never does get much higher, but that’s still a significantly higher number than we’d expect from an almost purely luck-based stat. And we know it is heavily luck-based, because there’s almost no year-to-year correlation. (Click to embiggen any picture.)


It’s possible, I suppose, that LOB% is a skill but the true-talent level of individual players changes very quickly. But that seems unlikely. Truthfully, I’m not really sure what the explanation is.
Another interesting stat is wOBA on fly balls as compared to wOBA on ground balls:


Whereas the reliability coefficient for wOBA on fly balls is around 0.75 after 150 fly balls, it hovers at around 0.35 for ground balls. Other than a spike at 250 grounders which is probably due to a small sample and random variation, the reliability for wOBA on grounders is pretty low. This falls in line with what I found a few months ago about how fly-ball production is much more important than ground-ball production for batters. Unfortunately, the reliability is small for both grounders and fly balls when it comes to pitchers.
Speaking of balls in play for pitchers, I was surprised by how high the reliabilities for the Soft/Medium/Hard-hit% stats were. The aren’t quite as high as for batters, but it does provide some evidence to counter DIPS theory:


And, in the same vein, Statcast stats such as exit velocity are also fairly reliable for pitchers:


There are many more graphs, and all of them, the full output data, and the code can be found on my GitHub. Because the raw data comes directly from the FanGraphs database, I can’t share it with you, which means that the code might not be the easiest to reproduce. The raw data is simply a play-by-play list (or pitch-by-pitch, etc.); here’s a sample of the plate-appearance data:
| batter | pitcher | Year | K | BB | HBP | OBP | wOBA | R | ER | FIP | xFIP |
| 457803 | 474699 | 2014 | 0 | 0 | 0 | 0 | 0 | 0 | 0 | 2.93 | 8.6661 |
| 425509 | 407793 | 2013 | 0 | 0 | 0 | 0 | 0 | 0 | 0 | 2.93 | 2.93 |
| 453568 | 421685 | 2015 | 0 | 0 | 0 | 0 | 0 | 0 | 0 | 2.93 | 2.93 |
| 461235 | 502272 | 2014 | 1 | 0 | 0 | 0 | 0 | 0 | 0 | -7.19 | -7.19 |
| 543829 | 523989 | 2015 | 0 | 0 | 0 | 0 | 0 | 0 | 0 | 2.93 | 9.81332 |
| 518960 | 502171 | 2014 | 1 | 0 | 0 | 0 | 0 | 0 | 0 | -7.19 | -7.19 |
| 519317 | 594835 | 2014 | 0 | 0 | 0 | 1 | 0.9 | 0 | 0 | 2.93 | 2.93 |
| 424325 | 502190 | 2015 | 0 | 0 | 0 | 0 | 0 | 0 | 0 | 2.93 | 2.93 |
| 425557 | 543779 | 2014 | 0 | 0 | 0 | 1 | 2 | 2 | 2 | 63.31 | 8.6661 |
| 460055 | 456501 | 2014 | 0 | 0 | 0 | 0 | 0 | 0 | 0 | 2.93 | 2.93 |
A few final notes:
- For shutdowns and meltdowns, SD% and MD% are the percentage of relief appearances that end in a shutdown or meltdown, respectively. I’d imagine that MD% is much less reliable because no pitchers are put primarily in positions where they can record a meltdown, whereas many pitchers (specifically closers) are usually put in positions where they can record a shutdown.
- In the tool, ER and R correspond to ERA and RA9, but they are once again per batter faced, not per inning, so inputting 3.50 as the ERA will make the tool think that the pitcher allowed 3.5 earned runs per batter faced. An ERA of 2.00 is typically 0.055 ER/TBF; 3.00, 0.082; 4.00, 0.11.
- You need to input percentages as decimals. Don’t input 25 to find a player’s regressed K%; input 0.25.
- When you see SB% and Pickoff%, that’s stolen base/pickoff success rate.
- “RV” in the pitch-by-pitch data is pitch type run value
Jonah is a baseball analyst and Red Sox fan. He would like it if you followed him on Twitter @japemstein, but can't really do anything about it if you don't.
Why do many of the stats alpha values have sharp declines towards the end of the data sets?
Small sample size. At a certain point there are only a few players with enough PA/Pitches/etc. so the alpha gets kinda screwy.
Another interesting question is at what point does the variance start to increase again? This would be related to the time when the underlying skill changes for the player.
Thank you for being truthful about things you didn’t know instead of trying to come up with some off the wall reason why things are that way.
Thanks. My hope whenever I do that is that a commenter will provide a good explanation, which actually happens a lot. Invariably it’s an obvious answer that makes me look dumb, but that’s better than pretending I know and being wrong.
Are your year-to-year LOB% thrown-off by all of those zeroes and hundreds? It’s pretty hard to get a sense of the plot with all the border noise and huge mass in the middle.
Also, weak year-to-year correlations doesn’t necessarily mean it’s not a skill. Pitcher BABIP and LOB% both had very weak year-to-year correlations from 2002-2012: http://www.fangraphs.com/blogs/basic-pitching-metric-correlation-1955-2012-2002-2012/
Yet we know that pitcher LOB% and pitcher BABIP reflect skills in their own right: whether it’s high-K% that suppresses the exponential nature of offense and hard contact, a fly ball tendancy that suppresses BABIP, good fielding that suppresses BABIP (and indirectly LOB%), good runner control that suppresses LOB%, double-play tendencies that suppress LOB%, etc.
http://www.fangraphs.com/library/pitching/lob/
http://www.fangraphs.com/library/pitching/babip/
The trick with calculating reliability like this is it is based on the assumption that each measure (game event) measures the same underlying construct (player talent). Seems to me the challenge here is that the number of observations needed to achieve acceptable reliability is very often so large that by the time you have enough observations, the underlying construct (true talent) has moved beneath your feet.
And that’s why it’s so hard to predict baseball; we have noisy measures on a constantly-changing object. But this should further clarify the need for establishing which measures can be considered reliably measured with the fewest number of observations, which can help us track changes in true talent in real time.
I realize this is on Fangraphs and not Rotographs, but there’s a valuable fantasy perspective to this as well. Whether by fantasy stat or in some composite form across a player’s line, you could conceivably estimate a player’s “reliability score” based on the sample size of the inputs to his projection. Everyone would have their own way of using this and incorporating it into their valuations, but it would go a long way towards contextualizing say lower-floor/higher-ceiling players as against higher-floor/lower-ceiling players who might otherwise have the same “most likely” projected stats.
Steamer included a version of a reliability stat in their projections for a while; I’d love to see Fangraphs adopt and publish an approach based on this article.