A Quick Comparison of Historical KBO and MLB Trends
As I’ve found in my recent attempts to write about the Korea Baseball Organization, gathering statistics often requires a cross-site scramble, and historical information and context isn’t easy to come by. With that in mind, and particularly with the wide year-to-year fluctuation in that league’s home run rate occurring at the same time that balls have been soaring out of the park at record rates here in the States, I thought it would be worthwhile to pull together some quick comparisons to the trends we’ve seen in MLB.
First, let’s take a look at the two leagues’ run scoring since the KBO’s inception in 1982:
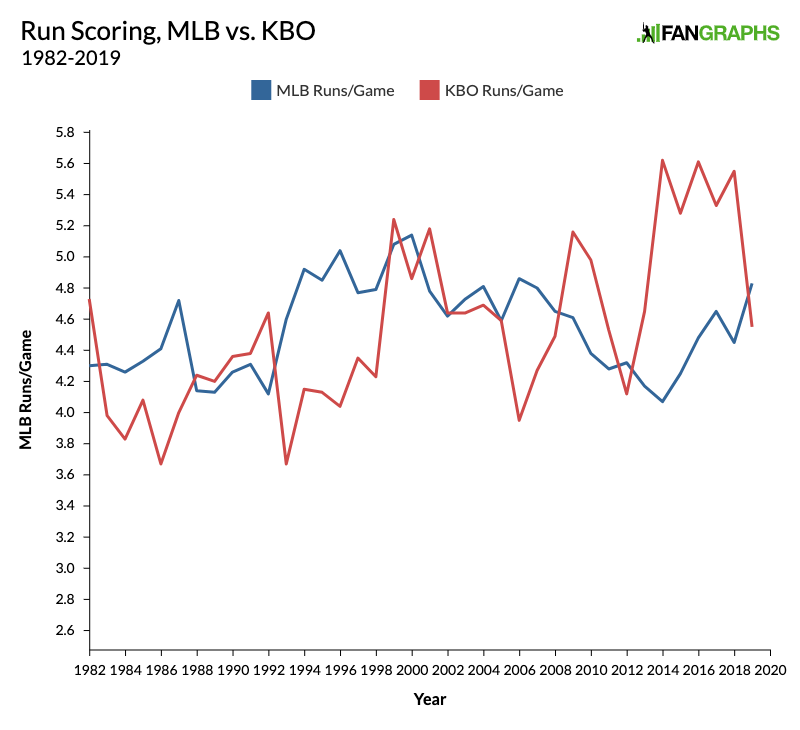
Perhaps understandably given its comparatively recent arrival, the KBO has been the more volatile of the two leagues in terms of scoring rates, with the higher peak (5.62 runs per game in 2014, to MLB’s max of 5.14 in 2000), the lower valley (3.67 runs per game in 1986, to MLB’s low of 4.07 runs per game in 2014), and the wider standard deviation (0.53 to 0.29). Note that the KBO’s peak and MLB’s nadir coincide with that aforementioned 2014 season, and that the two leagues are usually significantly far apart; the annual average, in terms of absolute value, is 0.49 runs.
On to the home runs:
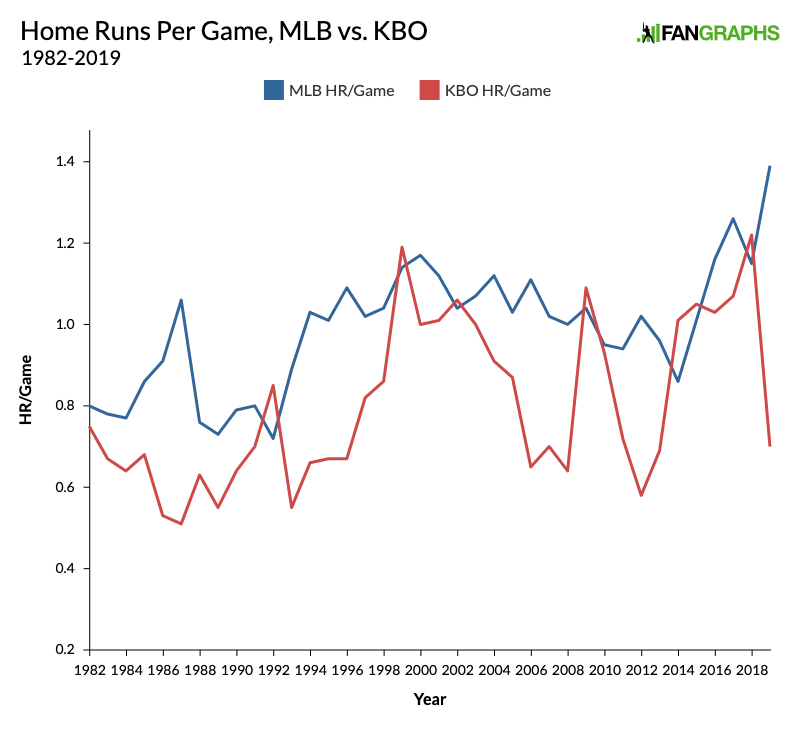
Home run-wise, this period has seen MLB’s per game record broken no fewer than six times, starting in 1987, the first season in which the league topped one homer per game. With the exception of a modest spike in 1992, the KBO’s home run rates were nowhere near 1.0 until the late 1990s, and didn’t surpass that threshold until 1999. Since then, the KBO’s highest year (1.22 in 2018) featured more than twice as many home runs per game as in its 21st century low (0.58 in 2012, the lowest mark since 1993).
For both leagues, the changing baseballs have been a significant part of the story. Changes in Rawlings’ manufacturing process have resulted in a more aerodynamic ball for MLB, with lower seams, greater carry, and a lot of controversy. For the KBO, the story is different. From 1982-2015, amazingly enough, there was no single league ball; rather, teams could choose from among a handful of approved brands, and until 2014, the balls were restricted to Korean manufacturers in an effort to help the local industry. This MyKBO blog entry from September 2014 contains a table showing three teams apiece using balls made by Skyline Sports and Big Line, two teams using balls made by ILB, and one using balls made by a company called Hard. What’s more, at that point, KBO found that Skyline’s balls for two of the teams — from among the Doosan Bears, Nexen Heroes, and KIA Tigers — were overweight, which led to the company being fined. The 2014 season was also notable in that the league opted for a more lively baseball; home run rates rose to 1.01 that year, up from 0.69 the year before.
By dint of its receiving the highest evaluation in 2015 tests, Skyline became the sole manufacturer for the KBO as of 2016, a status it stills holds, though the contract is up at the end of this season. Though the league tried to restore some power to the pitchers with a more generous strike zone as of 2017, the ’18 season brought record home run rates. At that point, the KBO opted to de-juice the ball, with its size increased by one millimeter and one gram, and the permissible range for the coefficient of restitution reduced as well. Sung Min Kim wrote about this for FanGraphs in 2019, a year that saw home run rates plunge to 0.70 per game.
As I noted on Wednesday, home run rates are back up (0.97 per game at this writing). Observers may believe that the ball’s properties have changed again, but it’s also true that the season has begun in warmer weather than usual due to the pandemic, meaning that balls will carry further. Additionally, batted ball data reported by Yonhap News’ Jeeho Yoo (an essential follow on Twitter if you’re interested in the KBO) shows that batters are hitting the ball harder than last year, with exit velocities on line drives returning to their 2016-18 range. Lower velocities by pitchers could be a contributing factor as well.
Anyway, here’s the two leagues’ trends regarding slugging percentage:
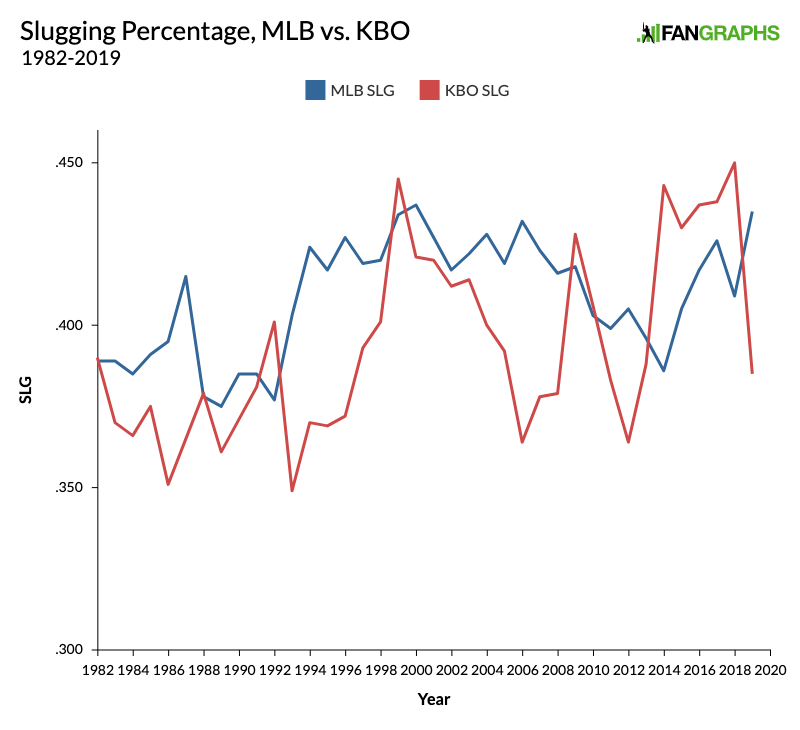
While that graph has some similar peaks and valleys to the one above it because home run rates play such a large role in slugging percentage, note that the KBO had higher slugging percentages in the 2014-18 period than anything MLB produced at that time, despite the fact that its home run rates, while relatively high, weren’t pushing the envelope in the same way.
The batting average trends of the two leagues form quite a contrast:
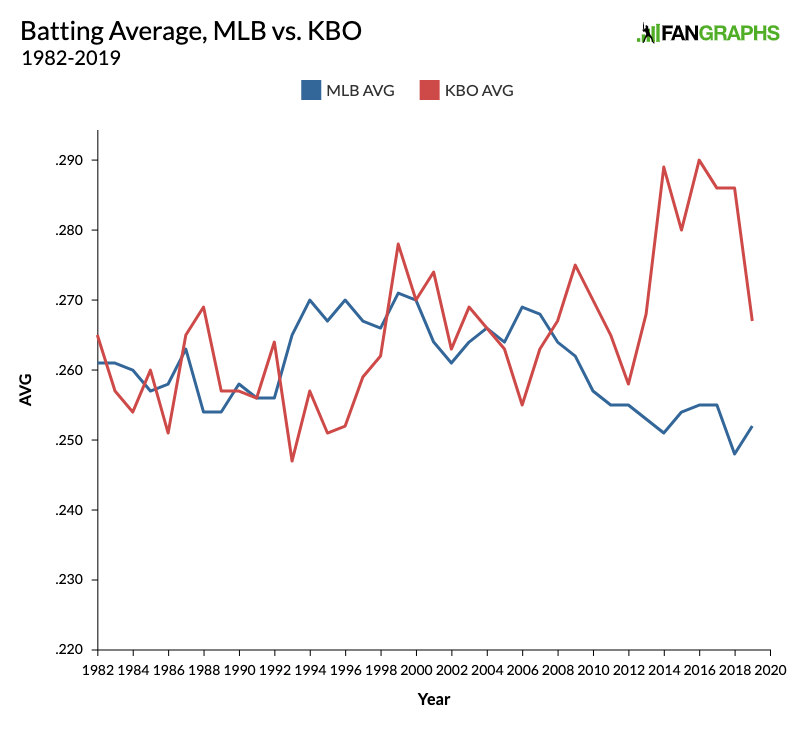
MLB batting averages were in the .265-.270 range from 1993-2000 as scoring and home run rates rose, and in the .262-.270 range for a decade after that, but the average fell to .257 in 2010, and hasn’t been above .255 since. Meanwhile, aside from 2012, the KBO has been above .265 every year since 2007, and from 2014-18, it was at least 28 points higher than MLB annually. While things came back to earth with last year’s de-juiced ball, the KBO’s .267 mark hasn’t been seen in MLB since 2007. Overall, the standard deviation for the KBO over the course of its history is nearly twice as high as MLB during that same time frame (11 points versus six), and the average annual gap between the two leagues is 11 points.
Now, here’s a look at strikeout rates, which have generally trended upwards in both leagues, albeit at a much faster and more consistent pace in MLB:
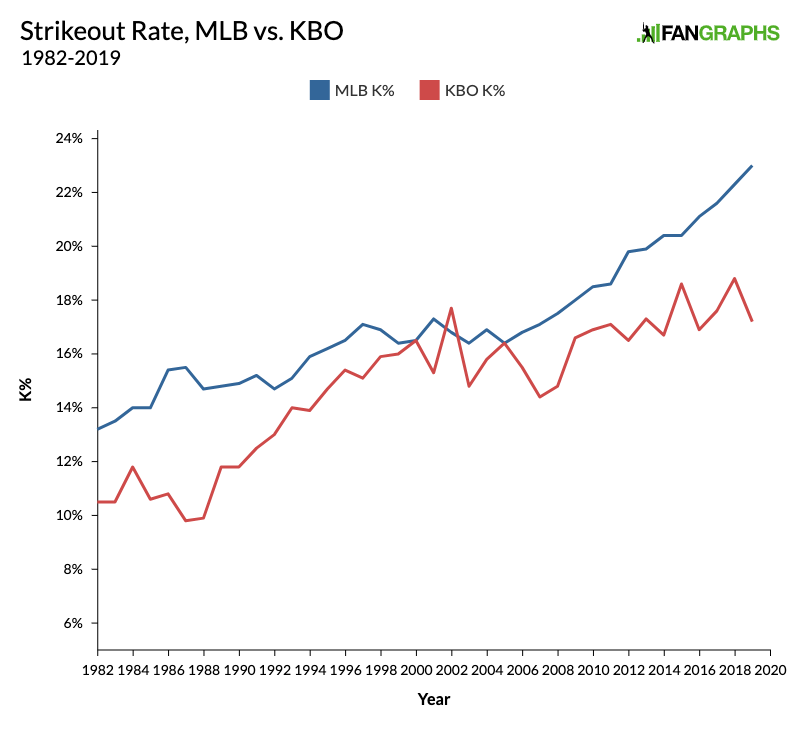
MLB hasn’t seen a year-to-year decline in strikeout rate since 2002-03, while the KBO’s rate has gone up and down almost annually for the past decade. The gap between the two leagues has become pronounced; from 1991 to 2013, the two leagues only once differed by more than 2.7% (3.3% in 2012), but it’s been 3.5% or higher in five of the past six seasons, and at least 4.0% in three of the past four.
Here’s a look at batting average on balls in play, which in the KBO has taken off considerably in recent years:
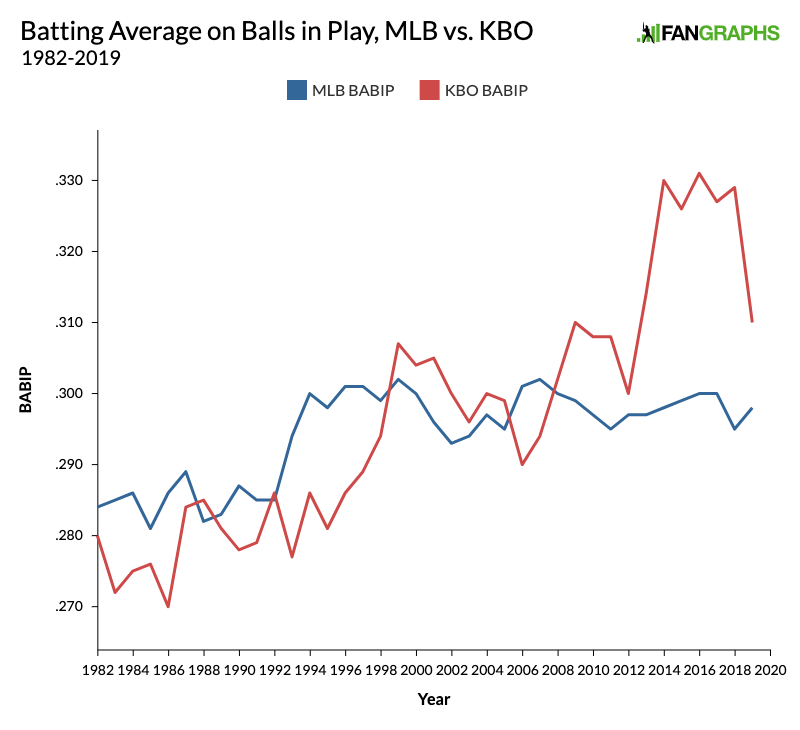
MLB’s BABIP hasn’t been higher than .310 since 1906 — the year of the “Hitless Wonder” White Sox upsetting the powerhouse Tinker-Evers-Chance Cubs in the World Series, if you need some ancient history to wrap your brain around — but the KBO has been at .310 or above in each of the past seven seasons, with a high of .331 (!) in 2016, five points ahead of the major league high set in 1907.
Finally, here’s the two leagues’ percentages of plate appearances ending in a strikeout, walk or home run, the so-called “Three True Outcomes”:
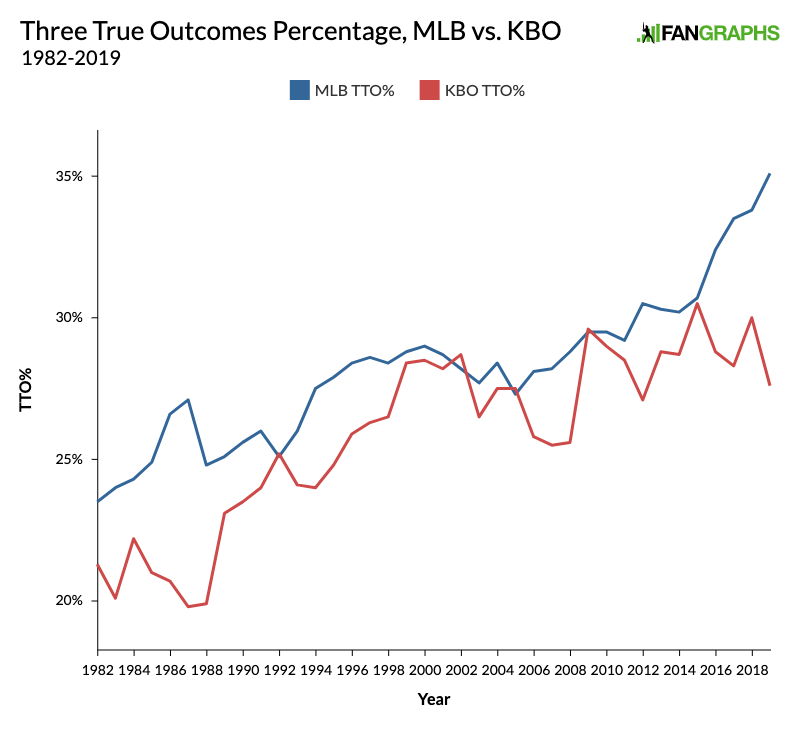
As you can see, the rates have shown some separation from time to time, but they were just 0.2% apart as recently as 2015, though the distance grew to 7.5% last year after three years where it was about half of that — still a sizable gap.
When you combine the differing BABIPs with the gaps in strikeout and home run rates, you wind up with two rather distinct flavors of baseball, though based upon the early indications of the KBO’s rebound in home run rate, I suspect that the differences in 2020 won’t be so stark. Of course, we need some actual Major League Baseball to complete the comparison, and right now, that’s just something we can only hope transpires.
Brooklyn-based Jay Jaffe is a senior writer for FanGraphs, the author of The Cooperstown Casebook (Thomas Dunne Books, 2017) and the creator of the JAWS (Jaffe WAR Score) metric for Hall of Fame analysis. He founded the Futility Infielder website (2001), was a columnist for Baseball Prospectus (2005-2012) and a contributing writer for Sports Illustrated (2012-2018). He has been a recurring guest on MLB Network and a member of the BBWAA since 2011, and a Hall of Fame voter since 2021. Follow him on BlueSky @jayjaffe.bsky.social.
This is great. Is the increased variance from year to year attributable to the smaller overall size of the KBO?