A Quick Look at Our Playoff Odds
With the release of full ZiPS projections, our playoff odds are up and running. For the most part that means putting a number to things that we already know. The Dodgers are 97.7% likely to make the playoffs, which sounds about right. The NL Central is a four-way tossup with the Cubs out in the lead. The NL East has three teams each with around a one-in-three chance at it. That all tracks with intuition.
Indeed, for the most part, the standings are self-explanatory. That doesn’t mean that everything is obvious and intuitive, however. Let’s take a quick look at a few of the cases where a deeper dive is necessary.
It’s tempting to think of a team’s expected win total as just a sum of their WAR. After all, the W is right there in the acronym! As Dan notes every year, however, adding up WAR totals on a depth chart isn’t a great way to go about things. Rather than just do that blindly, however, we can look at teams whose projected wins diverge the most from their WAR.
To do that, we’ll need each team’s projected WAR totals. Thankfully, there’s a handy page that shows all that data. The Dodgers have the most projected WAR and the Orioles have the least.
With that data in hand, we can work out what win totals every team would have if you could perfectly project WAR onto wins. First, let’s figure out replacement level. There are 1120 projected wins across all the teams and 2,430 total wins available in a season. This leaves 1,310 wins as the amount that replacement level is worth. Spread that across the 30 teams, and that’s 43.66 wins per team.
By simply adding a team’s WAR and 43.66, we can get WAR-approximated wins. That looks like this:
| Team | WAR | Proj Wins – WAR |
|---|---|---|
| Dodgers | 55.2 | 98.86 |
| Astros | 54.8 | 98.46 |
| Yankees | 54.7 | 98.36 |
| Twins | 47.8 | 91.46 |
| Athletics | 45.3 | 88.96 |
| Rays | 44.7 | 88.36 |
| Nationals | 44.6 | 88.26 |
| Mets | 44.6 | 88.26 |
| Braves | 43.5 | 87.16 |
| Angels | 42.5 | 86.16 |
| Red Sox | 41.6 | 85.26 |
| Indians | 41.3 | 84.96 |
| Cubs | 40.8 | 84.46 |
| White Sox | 39.9 | 83.56 |
| Padres | 39.6 | 83.26 |
| Phillies | 38.4 | 82.06 |
| Brewers | 38.0 | 81.66 |
| Cardinals | 36.5 | 80.16 |
| Diamondbacks | 36.2 | 79.86 |
| Reds | 35.3 | 78.96 |
| Rangers | 31.7 | 75.36 |
| Blue Jays | 31.6 | 75.26 |
| Rockies | 28.6 | 72.26 |
| Pirates | 28.0 | 71.66 |
| Royals | 24.6 | 68.26 |
| Giants | 24.3 | 67.96 |
| Marlins | 24.3 | 67.96 |
| Tigers | 22.0 | 65.66 |
| Mariners | 21.9 | 65.56 |
| Orioles | 17.9 | 61.56 |
Again, don’t take these as gospel. They’re just a starting point so that we can see where WAR and projected wins disagree. Next, let’s graph these WAR-approximated wins against the wins our playoff odds page projects:
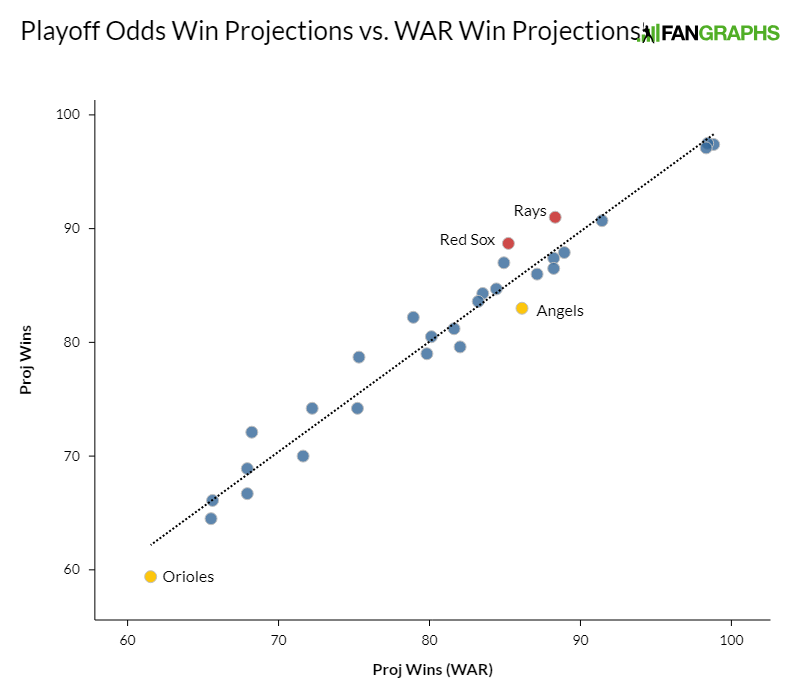
For the most part, they track pretty well. That makes sense — WAR is a great context-neutral way of looking at how good people are, and for the most part, good players means more wins. If there were no correlation between projected WAR and team wins, or even a noisier correlation, WAR would be a worse statistic.
But they’re not perfectly correlated. Let’s look at the teams on the extremes to find out why. First, the five teams who project to outperform the sum of their WAR by the most:
| Team | Proj Wins – WAR | Proj Wins | Gap |
|---|---|---|---|
| Royals | 68.3 | 72.1 | 3.8 |
| Red Sox | 85.3 | 88.7 | 3.4 |
| Rangers | 75.4 | 78.7 | 3.3 |
| Reds | 79.0 | 82.2 | 3.2 |
| Rays | 88.4 | 91.0 | 2.6 |
It’s a mixed bag of teams. The Royals don’t have a notable bullpen or any obvious reason they should outperform, but they do have a pretty easy schedule. Even though they don’t get to play the Royals (bad luck!), the AL Central is pretty soft. And their lineup benefits from stacking up contact-centric players with speed; WAR might treat events as context-neutral, but in the context of having fast guys who get on base, putting the ball in play and limiting strikeouts is good. BaseRuns, which drives our projected win totals, knows that. Between the schedule and the lineup effects, I can see why the Royals do well.
The Red Sox and Rays are similar to each other. They have easy-ish schedules and OBP-centered lineups that work well together. The Red Sox, in particular, show the value of lineup construction; with more runners on base, it’s more valuable to reach base for each subsequent hitter. Having great lineups, like the Red Sox still mostly do even without Betts, is good in a way that WAR alone doesn’t capture.
The Rangers and Reds mainly stand out for their stalwart starting rotations. I’m not exactly sure on the logic here, but my guess is that considering the way we allocate playing time to starters, having an above-average fifth and sixth starter impacts win percentage in a way that WAR can’t quite capture. Our WAR numbers take into account run environments that pitchers create, but BaseRuns doesn’t. That difference could account for the gap. This is, to be clear, extremely off-the-cuff and speculative.
Looking at the teams that underperform the WAR-counting method most is also instructive:
| Team | Proj Wins – WAR | Proj Wins | Gap |
|---|---|---|---|
| Angels | 86.2 | 83.0 | -3.2 |
| Phillies | 82.1 | 79.6 | -2.5 |
| Orioles | 61.6 | 59.4 | -2.2 |
| Mets | 88.3 | 86.5 | -1.8 |
| Pirates | 71.7 | 70.0 | -1.7 |
The Angels have a few problems. First, their schedule is sneakily difficult. They get the Dodgers as a “bonus” interleague team, which stings. Their extra games (not every team in a given division plays an equal out-of-division schedule) relative to the Rangers are against the Rays, Yankees, and Twins. Overall, they just got unlucky on the schedule.
Additionally, there seems to be some of the same starter game going on. They project to give an uncomfortable amount of playing time to Julio Teheran and Patrick Sandoval. It’s a reverse Rangers situation; their lack of depth and balance in pitching seems to hurt them.
Moving on, the Phillies have a combination of a tough schedule (being the fourth-best team in your division hurts), an awkward lineup that’s half on-base guys and half power guys, and the same soft back of the rotation that hurts the Angels. The Pirates are in the same boat — fifth-best in the Central, and their fifth and sixth starters sting a little.
The Orioles play the hardest schedule in baseball, which is rough. A team with a .500 true talent level would project to win only 78.4 games against their schedule. That’s 2.6 wins right there, and we have the Orioles underperforming their WAR-tabulated wins by just more than 2 wins. That explains that.
That leaves only the Mets, and I have a theory about that one. The Mets have a really valuable bullpen. They get most of that value from two players, though: Edwin Diaz and Seth Lugo project for 3 WAR out of the team’s overall 5.1 from the bullpen. There’s significant extra value as well from Justin Wilson and Dellin Betances.
That sounds great, but there’s something feeding those projections: leverage. All four of those relievers, the bullpen’s top four on a rate basis, had average leverage indices higher than 1 in their appearances last year, and all project to do so again this year. In other words, all of them came into games in situations that were more important than average, and WAR for relief pitchers accounts for that.
When we switch to BaseRuns, however, that goes away. We divvy up playing time across the bullpen and then use the aggregate result as an input to the BaseRuns formula. There’s no concept of leverage — every pitcher’s input is weighed proportionally to their playing time. Thus the Mets are losing a lot of the bonuses we gave them when assessing their bullpen with WAR. That’s worth slightly over 1 WAR, which explains a lot of the difference.
So yes, counting up the WAR doesn’t work exactly perfectly. It works pretty well though — there’s a 96% r-squared between WAR-based win estimates and our Depth Charts estimates. And the biggest differences are small in the grand scheme of things. Three or four wins tops, accounting for strength of schedule and sequencing and everything? It doesn’t sound so bad.
So enjoy our playoff odds and projected win totals, or enjoy carping about them if they disrespect your favorite team. In a pinch, you could use WAR as a replacement for the win totals and you’d get most of the story. But that’s why we’re here — for the rest of the story. WAR can do a lot, but our playoff odds go the extra mile.
Ben is a writer at FanGraphs. He can be found on Bluesky @benclemens.
“the AL Central is pretty soft.”
The AL Central has 3 teams rated in the top 14 in baseball in projected WAR. Is that really a “soft” division? Especially when the Royals have to play all three teams, and only get to play 1 bad team (Tigers)?
Because we would expect about half the teams in a division to be in the top half of the league, they don’t share a division with the Astros, Yankees, or Dodgers (whose ordinal rank is much less relevant than the fact that they’re superteams), and the other bad team is the Tigers, who are really stinking bad (right now).
But more than likely, the bigger reason here–and maybe the only reason–is the fact that the lineup works well together for the Royals. Because otherwise, the White Sox, Twins, and Cleveland would also get a big bump as well. And frankly, the division, while a little weaker than the other divisions, is far stronger than last year and about the same as the NL Central (who don’t have a team as good as the Twins, nor a team as bad as the Tigers).
Makes sense; I guess the top of the division isn’t dominant so even if they have 3 85-90 win teams, it doesn’t make up for the lack of a 100+ win team.
Simply summing up WAR, the AL Central has the worst total of all 6 divisions. As far as removing the individual teams, the Royals have the 19th lowest divisional opponent WAR, despite being the 25th best team overall. The two western divisions and the AL East each have a team 6.5 wins better than the top team in the AL Central, so there’s a dominant team in each of those divisions. The NL East has three teams within 1.1 wins of each other, so there’s three very competitive teams there. The remaining other division, the NL Central, has a 5th best team better than both the Royals and the Tigers.
Summary: no dominant team + two middling 2nd/3rd teams + one very bad team = soft division.
Competitive division doesnt necessarily mean good or hard division.. competitive soft division would be prefered way of describing it
3 of the top-14 includes #12 and #14
Kind of like looking at the 300HR / 300SB club and declaring all of the players about equal; why not, all in the same club?
Barry Bonds, A-Rod, Mays
Beltran, Dawson, Bobby Bonds
Reggie Sanders, Steve Finley
While they are all “members” the first line (guys with 660+ HR) are clearly in a different class.
Nice dynasty Cubs LOL
now do it without Paxton and Severino
Based on last year, they’ll sign Bartolo Colon and he’ll win 30 by his lonesome.
Plus hit 5 home runs in interleague play!
How do the 94-win Rockies only have a 4% shot at the playoffs?!
We interpolated.
Best comment I’ve seen in a while.
I miss the crazy days a decade ago when you could find real value betting preseason Over/Under win totals. Now everyone knows everything. Much tighter numbers at the book!
I’m pretty sure on an Effectively Wild podcast Mitchel Lichtman said he used to make a living doing that, but he had quit for exactly that reason.
The Brewers and Phillies in 4th place and under .500! The White Sox only one win above .500! The Blue Jays with only 74 wins! Gonna be pissed some pissed off commenters here any second now, if they haven’t already done it in the time I was writing this comment.
Add Cleveland to the list: the (updated!) depth charts have Reyes as the primary DH and Santana as the primary LF, with Bauers #2, and Luplow third.
No attention to what’s coming out of spring training about Reyes going to RF, Santana (of the dreadful defense) going mostly DH, and Luplow getting a serious chance to play against righties.
Of maybe they know something Francona doesn’t?
Splitting ad-bats is bound to be tough for teams with fluid rosters like Cleveland and Mikwaukee or young rebuilding teams like the Jays and ChiSox but I’m not sure about the Phils. I thought the bulk of their lineup is hardwired…
Yeah, i know it’s hard to get everything right for 30 teams but it’s not like Cleveland has been shy about announcing their plans for Reyes.
Meanwhile, over on the RosterResource Depth Charts, they have Christian Arroyo getting 112 PAs as the primary utility infielder and only 21 PAs for Mike Freeman. When the opposite is much more likely to be true. Also 203 PAs for Greg Allen who is quite likely to get 0.
https://www.fangraphs.com/roster-resource/depth-charts/indians
30 teams and 1200 players are a lot to track but even a cursory inspection would raise brows at giving the most LF ABs to the worst fielder in the position list and trigger at least some further consideration.
Not all teams telegraph their positional plans this early but when Cleveland keeps getting castigated for not spending on the OF it would seem prudent to wonder about their thinking.
Which seems to be about betting on the in-house options to save money.
(Apparently because they’re looking at freeing enough to extend Lindor, according to the local online media.)
As for Arroyo, unless the one-time prospect wows in spring training, his likely fate is the AAA shuttle since he has options and Freeman was effective at utility last year.
Bottom line is that these exercises are too be taken with a handful of salt.
Yep. Francona is nothing if not loyal so he’s going to give Freeman every opportunity to be the utility infielder. Meanwhile, Arroyo has yet to play a single game in the Indians organization. So he has a steep hill to climb.
Brewers are in 3rd place and above .500 and the White Sox are at 84 wins and have a pretty solid 27% chance to make the playoffs. The Phillies at 80 wins and 6 behind 3rd place is troubling for them and the Blue Jays, well I don’t know what Blue Jays fans expected.
https://www.fangraphs.com/standings/playoff-odds
https://www.fangraphs.com/depthcharts.aspx?position=Standings
Oh shoot, I forgot that the playoffs odds page and the project standings page don’t line up all the time! I’ll stick the links below, since it triggers automatic moderation.
Still, I’d bet you anything the Brewers and White Sox fans are still annoyed at these projections. And the Cards!
https://www.fangraphs.com/standings/playoff-odds
https://www.fangraphs.com/depthcharts.aspx?position=Standings
I suspect the White Sox likelihood of win totals is much more bimodal than most. They have enough raw talent to greatly overperform their estimate, but not enough depth for a big margin for error should a few things go very wrong. Especially in the rotation, but they are even just a couple hitter injuries away from giving too many plate appearances to Leury Garcia, Adam Engel, and all the below replacement level players that played to much last year.
They won’t be as bad as the Royals or Tigers, but they could win anywhere from 65 to 90 games and still finish third in that division.
https://www.fangraphs.com/standings/playoff-odds?displayOption=distribution
That shows the distribution of wins, though I imagine the raw data would be needed for any real analysis.
There are a handful that show a small second peak, but possible it is more noise than anything else.
What is the logic on using leverage in WAR calculations, but not for BaseRuns? Isn’t the whole idea of using leverage in reliever WAR that without it reliever impact is underrated relative to reality. That relievers are more valuable (i.e. impact winning more) than they would look if you look at context neutral stats? By removing it in BaseRuns, or not figuring out a way to add leverage appropriately, aren’t you kind of admitting that the BaseRuns number isn’t as good as it should be?
So if your team name starts with an R, you have an 83.3% chance of outperforming your WAR [sadface Rockies].
The poor Orioles, they somehow have the worst world series odds even in Coin Flip mode
Ouch. 0.0% chance to make the playoffs for both the Tigers, Orioles, and Mariners. This is… not going to be a fun seasons for those teams (or their fans). Even the Marlins have a 0.3% chance!
The obvious correlation is teams that start with “R” are expected to outperform their WAR total.
By definition, there are exactly 1000 WAR allocated for each season (which also happens to peg “replacement level” at 1000/15 games below .500, between 47 and 48 real wins). If the projections have the entire league combining for 1120 WAR, some of those projections are going to have to fall short.
Some will definitely fall short because guys will get injured, forcing teams to move down their depth charts. Known injuries, injury history, and age are reflected in playing time projections, but there are always unexpected injuries every year. So maybe that explains part of the discrepancy.
Yup, also curious to know the rationale for the extra 120 projected WAR.
I too am curious about it, but given that there are a closed number of wins in the system, it’s not a huge deal. Just makes a replacement level team lower and every team higher. There’s some calibration to be done about it for sure (Dan mentioned maybe we are giving stars too much playing time), but as long as you’re careful not to violate the one win per game rule, you can work around it.
I don’t think it really matters for the purposes of the exercise, it’s just one of those niggly things that has to do with projection systems not really worrying about playing time, and then the Depth Charts being educated guesses.
Ideally the Depth Charts would auto-adjust everyone’s collective WAR to 1,000 but that takes extra effort and it doesn’t really matter because actual seasonal WAR will sum to 1,000 anyway.
T
Just a quick look at the win line at The Lines shows that several of the bottom feeders are projected at approximately 4-8 fewer wins than these numbers above. I find the incorrect allocation of WAR to be disconcerting and therefore throws the entire exercise into the dumpster.
You need to put outside and unexcpeted things in to the considerations and most of these things are injuries
The WAR-Wins Outperformers are the five “R” teams. Coincidence? I don’t think so!
Good – thanks!
This can’t be right, the Astros were only any good because of sign stealing
I don’t think the Astros will win 100 games, but anyone expecting them to be bad is going to be sorely disappointed
woooosh.
also fail @ all the downvoters. why are you all so bad at sarcasm and hyperbole???
i thought a team composed of all replacement level players was supposed to win about 48 games, not 43.66. Total WAR allotted, last i heard, was about 1000, or 33 per team. Then 48 + 33 = 81, the average number of wins per team.
Has something changed?
Obviously the key to outperforming WAR is to have a team name start with R
Looks like ZiPS and PECOTA both believe the Cardinals are looking at a below-.500 team. Normally, it would be too late in the offseason to improve much, but there’s a miracle pill sitting on their kitchen counter: Arenado. He’d drastically improve their playoff odds. I’m estimating their odds would increase by 20-25% points (depending on who goes to Colorado from their 40-man roster), which is a crazy huge possible increase for the beginning of Spring Training. The Cards say they are near the top of their payroll, so they’d need COL to cover most of Arenado’s contract in 2020 (STL can easily afford future Arenado seasons, though). That means STL would have to kick in a few more prospects. STL has a mediocre farm system, but there’s enough there to make a trade work.
I understand that COL is notoriously difficult to work with, and I understand that STL isn’t going to make this trade. However, that means STL is running one of their highest payrolls in team history and might be looking at a win total that starts with a 7. It’s not a good look, especially when the team’s heart and soul might be in their final seasons (Molina and Wainwright). And their number 2 starter, Mikolas, now has a flexor issue…
Padres surprised me at the end with WAR and projected wins.. most of their trades included “WAR heavy” players and I excpeted them to have much larger projected wins according to different models but maybe that just shows how bad they were before and playing in the division with Dodgers certainly doesnt help out
So before the Mookie/Price trade, the Sox were projected to win the Wild Card…by a lot?
Is there a way to create a graph on fangraphs to show the delta in actual wins vs. the preseason projected wins, per season? For the example, 2019 Red Sox likely had high preseason win projection but must have a notable negative difference vs. projection.
It would be of value to see the +\- of actual wins vs. projections per season.
Thanks and forgive me if this is already available someplace and I stupidly missed it.
1) https://www.fangraphs.com/standings/playoff-odds?date=2019-03-19&dateDelta=
2) https://www.fangraphs.com/standings/playoff-odds?date=2019-10-29&dateDelta=
3) Excel
4) …?
5) Profit!
Don’t worry, us M’s fans are not going to be upset about something we already know. And have known for a very long time.