A Sampling of Dubious Superlatives
Today, I’m doing my part to fight back. This article isn’t about analyzing which of those stats are real and which aren’t; it isn’t even about analysis at all. It’s just some dumb statistics of my own that I made up to counter that trope that annoys me more than anything else: “When (basically any event in baseball) happens, the team has an incredible record!” I’ll also give you a baseline, so that when you hear one of these cherry-picked statistics in the future, you can put it into context. Let’s start with home runs.
Worst Record in Games with a Homer
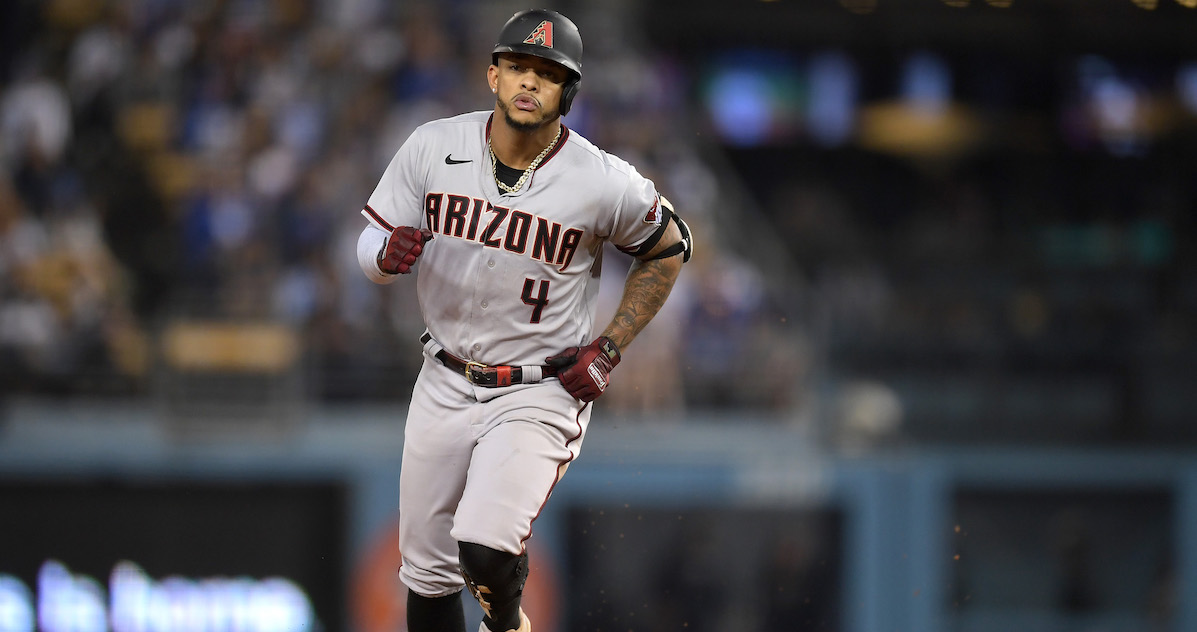
When a player — any player — pops a home run, there’s a decent chance you’ll hear their team’s record in games where they hit a home run. It’s always impressive. That’s mostly an artifact of selection bias; “games where a player hits a home run” mean that your team hit at least one home run, and that’s not a representative sample of the offense. But just because the record is likely to be good doesn’t mean it has to be. You won’t see Ketel Marte getting that treatment, because in the 14 games where he hit a home run last year, the Diamondbacks went 4–10.
Hey, boo! That hardly feels fair. The Diamondbacks were terrible last year! Sure, but what about when they were playing the Pirates?
Marte can’t control the fact that the team was down four runs when he got into one, but that’s kind of the point. Batters don’t have much control over whether their team wins when they hit a homer; all they do is hit the home run (which is a lot more than I do to help their team win). But I dare you, announcers covering a Diamondbacks game: bring up the team’s record in games where Marte hits a home run.
Let’s give out some honorable mentions, too, because this is one of my least favorite announcer tropes. It’s not only hopeless teams that can end up on the wrong side of variance here; the Twins went 9–15 in the 24 games where Josh Donaldson homered. Maybe it’s a Marte thing: Starling Marte’s teams went 4–8 when he left the yard. And even Shohei Ohtani, the human fun fact, wasn’t immune: in the 43 (!) games where he homered, the Angels went 21–22.
I hope I never have to hear this trope again, but if I do, I hope it’s at least these silly out-of-context versions of it. In aggregate, if a player hit a homer, their team had a .653 winning percentage in 2021. That’s the number to beat when you hear one of these silly statistics, which means that when an announcer brings up Nick Castellanos and the 21–11 mark his team managed when he hit a homer last year, you’ll know that’s solidly average.
Worst Record in Games Scoring Four Runs
This might be an even more frustrating statistic to hear on a broadcast. Of course teams that score at least four runs do better. Cut out a huge chunk of your bad outcomes, keep all of your opponents’ bad outcomes, and see how you did in those games; you’ll obviously do quite well. It’s like asking how often you make your flight when you arrive at the airport two hours early, or how often you get a three in Wordle when you get three letters on your first guess.
That is, unless you’re those poor Diamondbacks. They went an uninspiring 47–46 when they scored at least four runs. For comparison, the Nationals went 48–43. None of those are that surprising, which might make you think this is a boring section of this article, but I’ve prepared a few fun ones to make up for how boring it is that bad teams are bad at both pitching and hitting.
The Padres went 61–25 when scoring four or more runs, good for a .709 winning percentage. Sounds great! It’s also below the league-wide level of .725. The Pirates were awful this year, and they had a better record when scoring four runs than the Padres, checking in at 52–21, or .712. Perhaps the strangest, however, comes on the other side. The Guardians had the ninth-best record when scoring four or more runs, at a robust 68–19. They went 12–63 (!) in the rest of their games and finished with a record below .500. Winning the ones you’re supposed to is a given, but it doesn’t guarantee you overall success.
Worst Record When a Pitcher Goes Five
Poor Kolby Allard. He made 17 starts last year and delivered five or more innings in 14 of them. That means he didn’t get blown out of the game early or leave with injury, giving the bullpen an untenable workload. He had a 4.46 ERA in those starts — and the Rangers went 3–11, a .214 winning percentage. That’s some bad offense, because the average team won 58.7% of the time when the starter went five.
The Rangers lost 102 games last year, so they’re maybe not a great example. But what about poor Mike Minor? He went five or more innings in 25 starts last year, giving the Royals much-needed length to complement their young rotation. They rewarded him by going 8–17 in those games, and they weren’t even that bad on the year. In the three starts where Minor didn’t go five, he put up a grotesque 8.03 ERA — and the Royals went 2–1.
Spare a thought, too, for Luis Castillo. The Reds finished above .500 last year. Castillo had a four-WAR season and went five or more innings 28 times. The team went 11–17 in those starts. When Castillo threw, the team had a huge tailwind — one that went squandered, even when he got his normal workload in. A pitcher going five or more innings exerts a lot of control over the outcome of the game, but not enough to overcome the whims of fate.
Worst Record When Leading After Seven
This one might be my single least favorite statistic to hear, because it’s never presented in proper context and almost always overstates how good a team is. To calculate this split, I removed all doubleheaders from my sample set, because those don’t really get at what I’m looking for. I also removed games that were tied after seven, naturally. From there, I took every game and looked for who was winning after seven and who pulled it out in the end.
As you might expect, everyone is good when leading after seven innings. Across the entire majors — Pirates, Orioles, Diamondbacks, and all — teams had a .900 winning percentage when they led after seven innings of play. With only two innings for the trailing team to catch up, that almost sounds light. And yet, teams with good bullpens frequently get the star treatment using this statistic. You can name almost any setup man and closer; when those two players come in consecutively to protect a lead, their team has done well.
Naturally, the worst team here is those poor Diamondbacks: they had a bad overall record and the worst bullpen in baseball, and they also play in a high-scoring environment. Even then, they went 42–11 when leading after seven innings, a sterling .792 winning percentage. Every team, and I do mean every, did well when in these enviable conditions.
If anyone has a claim to feeling scared about leads after seven innings, it’s Mets fans. The Mets went 41–10 when leading after seven innings, the second-worst mark in the league. That’s not nearly enough leads after seven innings; it’s fewer than the Diamondbacks, for example, despite the Mets winning 25 more games overall. It’s also a strikingly bad mark for a team that sniffed .500; among teams that won even 70 games, the next-worst record when leading after seven belongs to the Red Sox. The Sox went 66–10 — that’s 25 games better than the Mets did when leading after seven with the same number of losses.
If you’re not as annoyed by these throwaway statistics as I am, I’m sorry that I made you sit through this. But if you’re right there with me, I hope this works as an antidote. Next time you hear one of these annoying, not-particularly-informative statistics, you’ll have the proper context. More importantly, you’ll be able to think of Ketel Marte, or Mike Minor, or the entire Mets franchise, as proof that those statistics don’t have to be true, even if they usually are.
Ben is a writer at FanGraphs. He can be found on Bluesky @benclemens.
I have a similar complaint about the playoffs: “the team that wins Game 1 wins the series x % of the time!” I mean, who would’ve thought winning a game in a playoff series would be helpful for winning a playoff series?
I always counter that with “the team that wins game 7 wins the series even more often.”