A Sweet Spot by Any Other Definition
I’d like to show you a graph. It’s not a surprising graph, nor a shocking one. Here’s the production on batted balls across all hitters in 2019, grouped by launch angle:
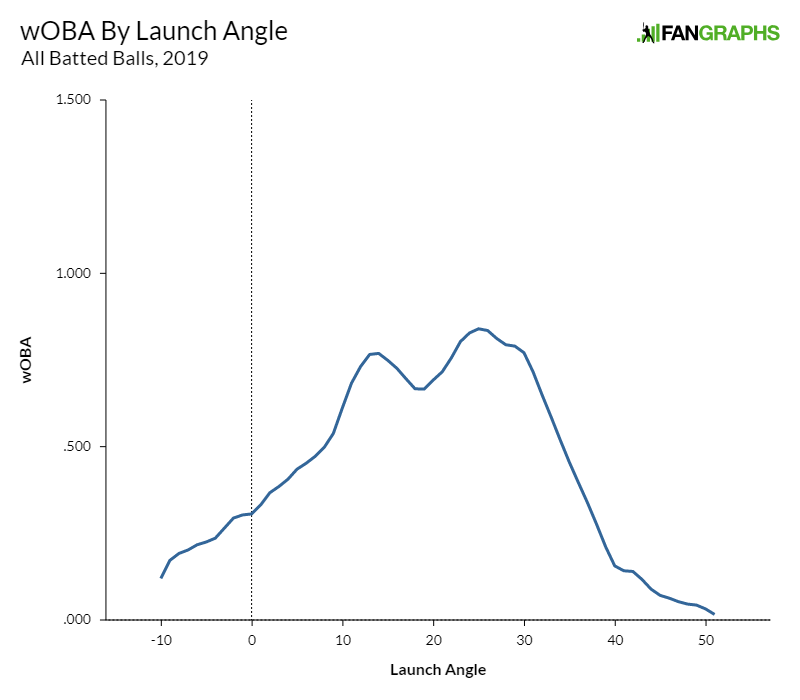
It’s not exactly rocket science. Hitting the ball straight down is death, hitting the ball straight up is just as bad, and most of the juice comes in line drives and fly balls that don’t approach popup status. There’s even a cute little dimple right around 15 degrees, where the ball has too much loft to be a flare but not enough that you’re all that likely to hit a home run. That all seems to make sense.
Next, let’s complicate it slightly. Here’s the same graph, only with batted balls hit less than 95 mph excluded:
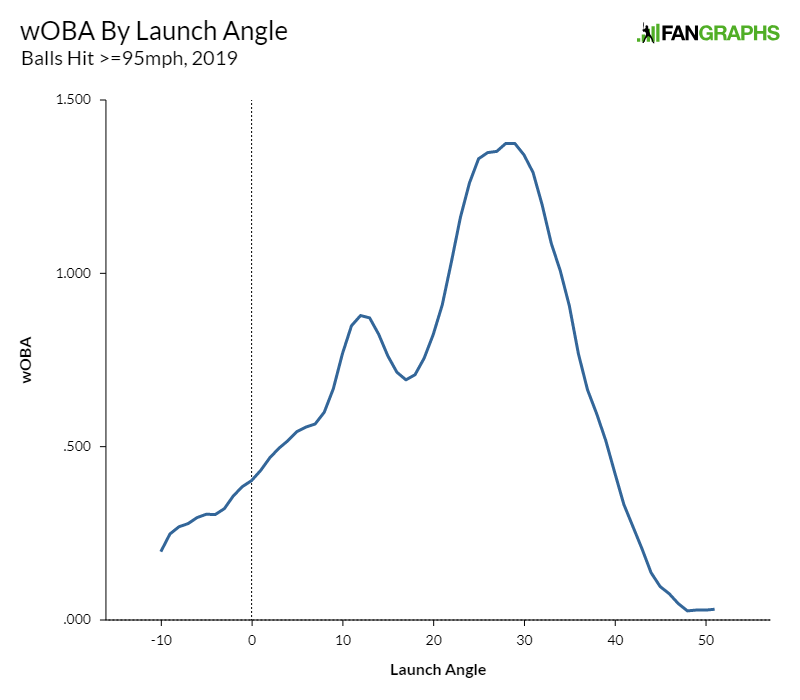
This graph shows the angles batters would prefer to achieve when they drive the ball. That peak around 30 degrees is now a mountain, and it’s better to hit even a near-popup fly ball than a grounder, because you’re far more likely to spike a home run if you hit the ball this hard. If you want a graphical representation of the launch angle revolution, it’s right above you.
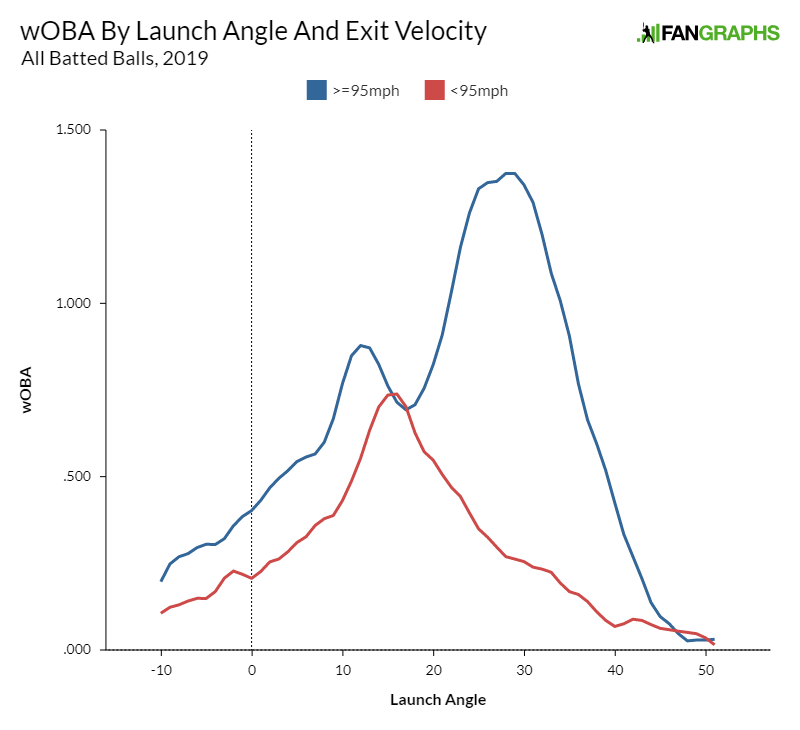
Let’s keep the graph party going by combining these two:
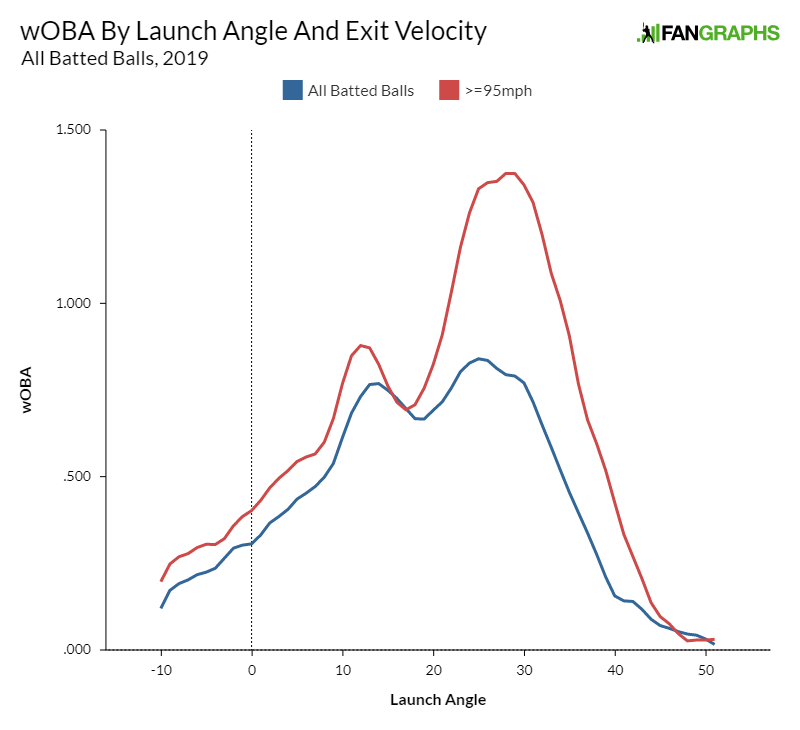
Now that’s interesting. Hitting the ball hard helps a little at nearly every launch angle, which isn’t exactly breaking news. But it’s only a small boost until you get into the fly ball range. Hit the ball at peak home run angles, what Statcast calls barrels, and your power goes a long way. Hit a flare or low liner, and you’re nearly indifferent between mashing the ball and only hitting it decently.
Of course, if we have the results of batted balls hit above 95 mph, that means we can also look at the inverse, which is production by launch angle on balls hit less than 95 mph:
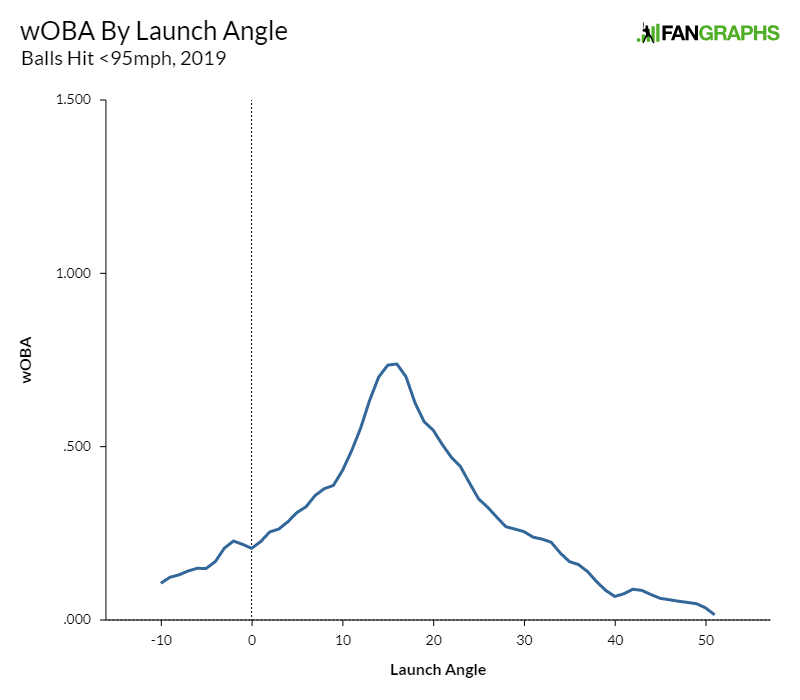
Low line drives are still good. There’s a reason that line drives are such a valuable batted ball type: it doesn’t really matter how hard you hit them, they’re likely to become a hit. But now fly balls are terrible, roughly as bad as hitting the ball directly into the ground.
In fact, the first graph in this article is a bit of an illusion. It looks like a distinctive double-peaked pattern, and it is. But those two peaks aren’t the result of every batted ball being best at those angles. It’s a combination of two sweet spots, one for poorly-hit balls and one for well-hit balls:
What does this all mean? Well, a shorthand for how often you hit the ball at a good angle is something called Sweet Spot%. As Baseball Savant defines it, it’s the percentage of batted balls hit between 8 and 32 degrees of launch angle. One quick look at that double-peaked graph is enough to explain why.
The leaderboard for Sweet Spot% is a mixed bag:
| Player | Sweet Spot % |
|---|---|
| Cavan Biggio | 44.2% |
| Mike Trout | 44.1% |
| Whit Merrifield | 42.4% |
| Yadier Molina | 42.1% |
| Luis Arraez | 42.0% |
| J.D. Martinez | 41.9% |
| Jorge Polanco | 41.8% |
| Brandon Belt | 41.4% |
| Domingo Santana | 41.2% |
| David Dahl | 41.0% |
Underground superstar Cavan Biggio! Actual superhuman Mike Trout! Human launch angle advertisement J.D. Martinez! Yadier Molina?
The reason there’s such mixed production on this leaderboard is because of the heterogeneous nature of production on contact. A 30-degree ball, toward the top of the range, is tremendously valuable when hit hard; that bucket produced a 1.342 wOBA, more valuable on average than a guaranteed double. Hit weakly, it produced a .255 wOBA, a significantly worse result than Billy Hamilton’s production on contact for his career.
One solution to this conundrum is to add a second filter; look for hard-hit sweet-spot balls. That’s essentially what barrels are; they’re different, but you won’t go too wrong in your head if you think of a barrel as a hard-hit ball that’s in the air without being too high in the air.
Barrels, and particularly barrel rate, are great statistics. They’re descriptive and predictive at the same time; a player with a high barrel rate likely did a ton of damage on contact, and they’re also likely to maintain a high barrel rate the next year. In fact, if you want to, you could stop reading this article right now, look at a barrel rate leaderboard, and easily find all the most dangerous hitters in baseball:
| Player | Barrels/BBE |
|---|---|
| Miguel Sanó | 21.2% |
| Aaron Judge | 20.2% |
| Nelson Cruz | 19.9% |
| Gary Sánchez | 19.1% |
| Mike Trout | 18.6% |
| Yordan Alvarez | 17.2% |
| Jorge Soler | 16.9% |
| Pete Alonso | 15.8% |
| Christian Yelich | 15.8% |
| Josh Donaldson | 15.7% |
Let’s get fancy though. It’s a Tuesday in February and you’re reading about baseball on the internet. You’re looking to dig a little deeper and kill some time. Look at the graphs above, and it’s clear that the optimal launch angle depends on how hard you hit the ball. For hard-hit balls, it’s actually something like 20-35 degrees; that entire range produces a wOBA above .800, and it’s not particularly damaging to miss by a few degrees high or low. I’m ignoring the secondary peak around 10 degrees to focus on a single range that gets monotonically higher as it moves towards the center of the range. A hard-hit sweet spot leaderboard would look like this:
| Player | Good Angle% |
|---|---|
| Derek Dietrich | 40.4% |
| Ronald Guzmán | 37.1% |
| Eduardo Escobar | 37.0% |
| Joey Gallo | 36.8% |
| Brandon Belt | 36.8% |
| Cavan Biggio | 36.6% |
| Eugenio Suárez | 36.3% |
| Omar Narváez | 36.3% |
| Jorge Polanco | 35.7% |
| Gleyber Torres | 35.5% |
There are still some weird names on this leaderboard; Guzmán had an 80 wRC+ in 2019, for example. But he had a decent wOBA on contact, and his xwOBA was even higher, which measures something close to what we’re looking for. When these players hit the ball hard, they’re doing it right, elevating and celebrating.
We can do something similar with weakly hit balls. If you’re hitting the ball softly, the best angle is lower, between 10 and 24 degrees. Who’s the best at that, you might ask?
| Player | Good Angle% |
|---|---|
| Mike Trout | 26.5% |
| Victor Reyes | 26.4% |
| Jon Jay | 25.2% |
| David Fletcher | 24.5% |
| Kyle Seager | 23.4% |
| Bubba Starling | 23.1% |
| DJ LeMahieu | 22.4% |
| Eric Thames | 22.4% |
| Ehire Adrianza | 22.3% |
| Omar Narváez | 22.2% |
That’s a very interesting list. Trout is the best at it. Narváez optimizes his launch angles on hard and weak contact. Biggio is just off the list in 13th place. We could stop here if we wanted to. Fletcher and Jay are prototypical weak-contact hitters who still produce, and LeMahieu used to fit that mold before becoming something more. Maybe we’ve found something!
But we can do a little more. These rates are expressed as a percentage of the relevant exit velocity events; in other words, the hard-hit leaderboard rates are as a percentage of hard-hit balls. We can combine the two leaderboards, weighting by the percentage of a player’s batted balls that fall into each category, to produce a unified leaderboard.
One final modification before I do that: it’s more important to hit the ball in the sweet spot when you hit it hard. Balls hit above 95 mph and between 20 and 35 degrees produce a wOBA 696 points higher than hard-hit balls that fall outside those angles. The difference is a mere 441 points for soft-hit balls in and out of the optimal launch angle range. This means that hitting the sweet spot is 1.58 times as important on hard-hit balls, and we’ll appropriately weight the number of hard-hit balls based on that.
Without further ado, the true sweet spot leaderboard:
| Player | True Sweet Spot% |
|---|---|
| Mike Trout | 30.1% |
| Cavan Biggio | 29.2% |
| Austin Riley | 28.1% |
| Chris Davis | 27.8% |
| Joey Gallo | 27.6% |
| Brandon Lowe | 27.6% |
| Anthony Rendon | 27.5% |
| Kyle Seager | 27.4% |
| Ronald Guzmán | 27.4% |
| Brandon Dixon | 27.4% |
| Omar Narváez | 27.4% |
| Jorge Polanco | 27.4% |
| Eric Thames | 27.4% |
| Brandon Belt | 26.7% |
| Cody Bellinger | 26.5% |
Now we’re talking. Trout and Biggio stand alone at the top, and the leaderboard is filled with interesting names. Chris Davis also makes an appearance to keep things mysterious. To paraphrase an old Sam Miller rule, a statistic is meaningful when Trout is the best at it. That’s not to say that this statistic is necessarily a great one; I recently found that hitters don’t exert much control over line drive rate, and production on soft contact is heavily tied to hitting line drives. They do exert some control, however, and they also control the frequency of fly balls, which gives me hope that this leaderboard means something.
When I set out to write this article, I was looking for diamonds in the rough. I suppose you could say we found some; Narváez and Guzmán keep coming up, and seeing Austin Riley so high on the list should give Braves fans hope. But of course, as is true of most things in baseball these days, if you look for hidden indicators of greatness, Mike Trout will sneak to the top of the pile. That’s a satisfying capper on a meandering look at batted ball optimization.
Ben is a writer at FanGraphs. He can be found on Bluesky @benclemens.
last chart is a bunch of dudes who cant make contact and strike out a ton
and trout
And Polanco and Rendon. Their career K-rates are 15-16%. Bellinger cut his K-rate to the same in 2019.
Makes sense. Metrics of production on contact tend to skew that way, I think. Those are the guys who need to do maximum damage on contact just to be viable. A player who makes good contact just as often on a per PA basis but strikes out less is probably more valuable overall because they get at least some occasional good results on the worse contact. But they won’t show up here because a smaller amount of their contact is good.
And Mike Trout shows up because he breaks baseball.
I think that’s basically right, but it’s really “a bunch of dudes who can’t make contact and strike out a ton” but also do enough damage when they do make contact to remain major leaguers.
And Chris Davis.
Who previously fit that mold to a T, so it still checks out.
who made enough contract to remain a major leaguer.
Narvaez hardly strikes out a ton. He’s the back end catcher to own. Line drives like crazy, and consistently so.
You’re telling me Rendon strikes out a ton?