
A Visual Look at Defensive Metrics
As we move into May and people start to check our WAR leaderboards, there will inevitably be a discussion about why certain players rank highly, especially if they aren’t putting up big offensive numbers. Most of the time, that discussion revolves around the player’s defensive value; For example, last August, Alex Gordon sat on top of our WAR leaderboards, which generated a fair amount of controversy at the time.
Here at FanGraphs, we use Ultimate Zone Rating (UZR) as the fielding component of WAR. UZR is one of two defensive run estimators we host here on the site, the other being Defensive Runs Saved (DRS). Both metrics go beyond traditional fielding stats using the same Baseball Information Solutions (BIS) data set to assign runs to players by dividing the field into different areas and then comparing each play to a league average. At FanGraphs, we don’t have UZR values for catchers or pitchers, so those positions are simply removed from any data visualizations in this post. We also have great library entries that go over the minutiae of the metrics better than I can in this post.
To help illustrate some of the differences and similarities from this season, I have created an interactive visualization showing the UZR and DRS for players so far this year. In general, whenever you attempt to measure the same underlying talent level in different ways, you are going to have some agreement and some disagreement between the numbers. The scatter plot illustrates the variance between the two metrics and has a 0.44 r-squared value.
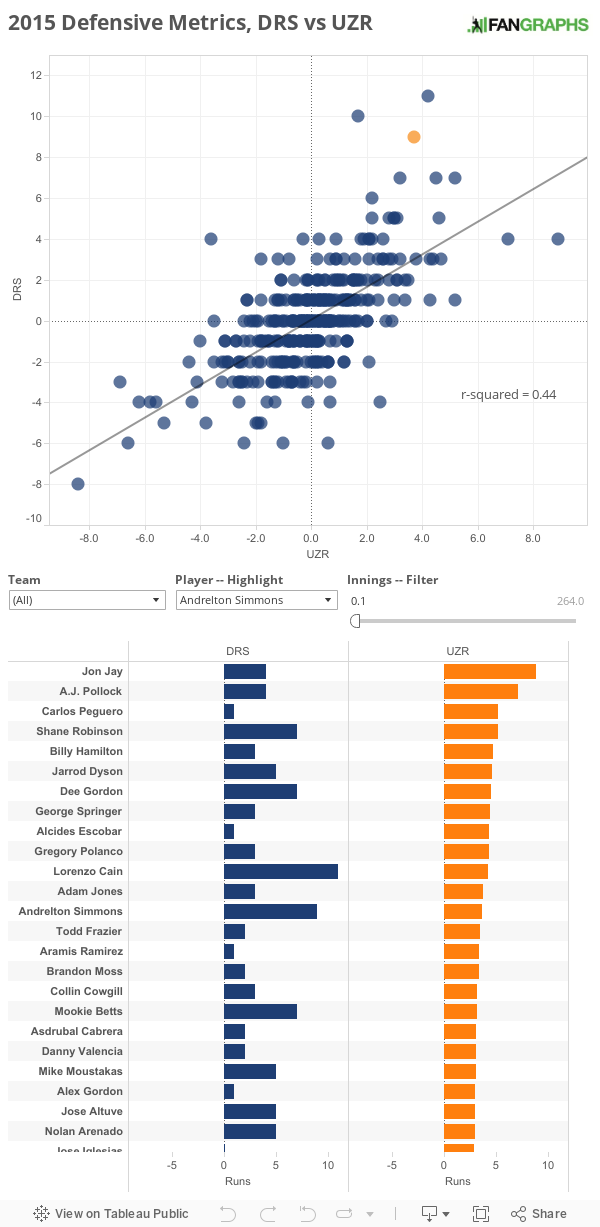
Data is current through 5/5/2015, and each player’s data point represent his defensive metrics at all positions.
In a perfect world, these measurements would be identical, but unfortunately, fielding data is fairly noisy. Both metrics are attempting to measure the fielding value of each player in the first month of the season, but the measurements are imperfect, arising from both the variables that go into measuring fielding value and the performances of the player. Of course, all baseball stats contain noise — Dee Gordon, Major League Leader in WAR — but fielding stats do have more than most.

Of course, when the measures agree, it’s easier to have more confidence in the conclusion; I don’t think anyone doubts that Andrelton Simmons has been a big asset to the Braves so far this year, for instance. That said, keep in mind that both systems are using the same data source, so if there was an issue with the quality of the underlying data, neither system would act as a check-and-balance for the other. However, Baseball Info Solutions has been collecting fielding data for over a decade, and the odds of an uncovered systemic bias are pretty low at this point.
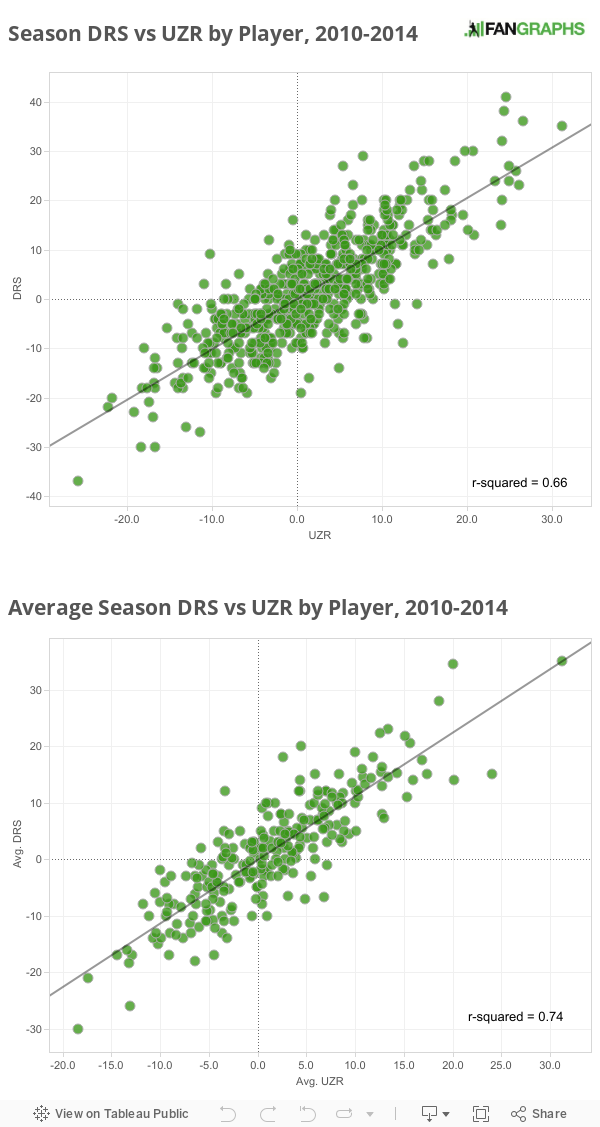
After seeing the correlation between the DRS and UZR for plays through early May, I wondered what an entire year of fielding data would produce. More data will yield a clearer picture of the true talent level. Below is the same scatter plot with each player-year with the requisite qualified innings at a given position from 2010-2014 and plotted them to get a more attractive r-squared value of 0.66. When I averaged the stats over the same time frame, there was even more agreement between the two defensive stats; the r-square value became 0.74.
With the potentially exciting development of tracking data such as MLB’s Statcast system, we’ll likely be able to improve and refine these metrics in the future, giving everyone a better understanding of defensive value. But while the current numbers are imperfect, they are also worth keeping an eye on, and incorporating into our overall view of a player’s defensive value to his team.
I build things here.
DRS is clearly the accurate measure of defensive value. UZR needs to be eliminated.
Fielding percentage is clearly more accurate than either DRS or UZR. Destroy any knowledge or public record of both statistics immediately.
PS I am not a crackpot.
As someone who watches Jake Marisnick play almost every day, there is no way that those metrics are accurately capturing his usage of his abilities. (If you’re looking for him, he’s in the -1 DRS, 0.2 UZR regions.) Hopefully he isn’t being penalized for making plays on gappers and would-be bloops while still on his feet.
As both these metrics are calculated as a relative value to other players of the same position, you better reserve some extra time to watch almost every other centerfielder play almost every game until you can be almost certain that your statement almost makes sense.
You’re right. I only watch the Astros’ pitching side of the frames and was just introduced to baseball this season.
His point is that those plays you think are demonstrative of Marisnick’s superior range are probably just as easy (or difficult) for the ordinary center fielder.
^ I do understand his point, however snarky. Thank you for the clarification. While I’m a true believer in analytics side of the game, I’ve seen and played enough baseball to believe what I’m seeing in this case.
Did Marisnick make a lot of good catches on bloopers in a gap caused by all that shifting the Astros do?
I don’t know if these systems can tell whether these were tough plays or get fooled into thinking they’re routine plays.
Defensive stats are still very noisy. Marisnick’s defensive stats will likely improve. They were good a week ago or so.
Hahaha…I’m such a Luddite, but I just read through the Library pieces (again), and actually feel like DRS is the better measure. Probably because the official Lichtman primer is so utopian, and as near as I can tell contains no actual calculation.
somebody answer me this though-if all DEF does is make a positional adjustment, why is Escobar twice as good as Simmons by UZR/150, but only a tenth better by DEF?
http://www.fangraphs.com/leaders.aspx?pos=ss&stats=fld&lg=all&qual=120&type=1&season=2015&month=0&season1=2015&ind=0&team=0&rost=0&age=0&filter=&players=0&sort=25,d
DEF = UZR + PosAdj
UZR/150 is UZR adjusted for 150 games, and becomes a rate stat, while UZR and DRS are effectively counting stats.
The positional adjusted is also accrued by innings played. So Escobar has fewer innings played at SS, so the lower denominator increases his UZR/150, and the fewer innings played earns him less positional adjustment.
Thanks, that makes perfect sense. So the positional adjustment is 7.5? how is that calculated? UZR*7.5(innings played/1,450 or something)?
Close…
Def = UZR + PosAdj
Def = UZR + 7.5 * (Innings Played / (162 games * 9 innings) )
Def = UZR + 7.5 * (Innings Played / 1458 )
So if the * in your comment was a typo (instead of +) then you had the right idea.
Also you can more clearly see the Fielding Runs and Positional Runs on the Value section of the player pages:
http://www.fangraphs.com/statss.aspx?playerid=6310&position=SS#value
You can also create custom leader to get those fields if you want to compare them across many players. Also the league adjustment and replacement level components of WAR work the same way as the positional adjustment, except they use PA instead of innings played.
Ask John Dewan, the BIS top dog, how many evaluators look at each play. I did, and he said, smiling, “Fifty.” Which, of course, is bullshit. Thus, it’s difficult to evaluate his system.
Simmons has played significantly more, which means both that his UZR isn’t much different than Escobar’s (3.7 v 4.3) and that he gets a bigger positional adjustment (which is also per-inning). Hence the nearly-equivalent DEF.
tl;dr: DEF is a compiled stat, UZR/150 is a rate stat.
For an interesting “huh” moment, sort the player list by UZR and scroll to the very bottom for a famous player whose UZR and DRS are very, very, very different.
I may not be looking hard enough, but the only player with a bigger difference between the two stats is Kevin Pillar.
Harper? Yeah, fielding is very interesting to me, and I have a hard time getting my head around why there is such a difference between the 2 systems. UZR feels like a spreadsheet with an ignored circular reference error to me.
Urban Shocker, you are so right about UZR. Which is why DRS needs to be the one true measure of defensive value.
For the life of me, I can’t figure out why the metrics aren’t on board with Juan Lagares this year. He’s made several fantastic plays, seemingly hasn’t missed any plays that the average CF would make, and his Inside Edge stats look tremendous.
He’s made 2 out of 3 Unlikely plays (where 10-40% of CF would make), and he’s 1 for 1 in Remote plays (1-10% of CF would make it). He’s made every play in the 60-100% range. The *only* negative is that he’s 0 for 1 in 50/50 plays, but that’s more than offset with his Unlikely/Remote plays. Both metrics loved him in 2013 and 2014, Inside Edge thinks he’s great this year, the eye test universally loves him – but UZR/DRS just give him a shrug and move on this year.
By the way, it would be great if there was a list of which plays are involved in Inside Edge data. I’d love to see the date and inning for the 1-10% play he made so that I can go back and watch it. Same with Alex Gordon.
There must be some mistake with Juan Legares. Fangraphs depth chart gives him a Fld of 10.3 which sounds reasonable: that puts him above Lorenzo Cain and little below Alex Gordon. The DRS and UZR in this chart are way too low.
Should be Lagares. Sorry.
There is a third and likely better defensive metric also hosted on Fangraphs that didn’t get any mention and that is the “Fans Scouting Report” or FSR. While it doesn’t change on a day to day basis (really, a defensive metric shouldn’t have much change on a day to day or week to week basis) what is given at the beginning of the year is likely more accurate and less noisy than UZR/DRS. FSR could probably stand to get updated at the midpoint of the season to help raise its standard even more.
I don’t see why that measure would be better. I might think it is much more susceptible to bias, in particular past-performance bias.
Why shouldn’t a metric change day-to-day or week-to-week early in the season? Early in the season, a player can start a day batting .220 and end it batting .290. Why should defensive stats be different? After all, it’s a record of value contributed, not a measure of true talent.
One thing that’s stunningly clear from that first graph: any way you cut it, the Wil Myers in CF experiment must come to an end soon.
My goodness, Matt Kemp.
A lot of people have argued that Matt Kemp has been underrated by WAR the past few years, by disputing his defensive ratings. They usually either argue that A) there’s no way he was really that bad – essentially an appeal to the ridiculous – or B) that no one can actually be that bad – essentially that the system is miscalibrated. I don’t really know how to respond to the first one, but I’m somewhat unconvinced of the second by the fact that Kemp is all alone at the bottom here. It would be one thing if UZR said that all these defenders were worth -30 runs, but no, it’s just Kemp really.
I don’t know if this is an old question… but for a layman like me who’s mathematically challenged… Why must the DRS and UZR squared to make them more visually appealing? And what’s the reason of using 0.66 as the value?
This should help:
http://en.wikipedia.org/wiki/Coefficient_of_determination
It’s definitely encouraging that UZR and DRS correlate so strongly but that doesn’t mean either one is right.
Please explain why Juan Lagares is near the middle of the chart, grouped in with “the field.” Anyone who watches him with any regularity knows he saves the Mets runs. So why doesn’t he stand out here?
See my post below. These grades are handed out arbitrarily by a group of individuals. Juan Lagares makes it look easy so he “never” makes remote plays according to the people grading. He is in my opinion one of the best CF in the game right now.
My problem is the way BIS measures plays is completely arbitrary done by a handful of interns who are in their first year of their job and they change from team to team (or league to league). For an intern a play can be “routine play” and for another intern the same play could be “remote play”. There was plenty of debate of how Juan Lagares only had “routine plays” but was one of the best CF in baseball? He makes it look easy and only has average speed, but he covers so much ground because his first step reaction is off the charts, which is impossible to measure watching a televised broadcast of a game. I hope statscast will solve some of this mysteries.
Gardner has been the worst glove on the Yanks and Didi the second best.
Just to clarify one thing: That box chart (or whatever it’s called) that goes “True talent” “Noise” and then “Stat” should really be “Defensive performance” rather than “True talent.”
We are always measuring defensive performance and then (perhaps – if we want to) inferring true talent. As the sample size gets larger and there are no major biases in the metric, we approach true talent with respect to what the metric is reflecting.
And that is not always the case (perhaps never the case), if there are any biases in the metric that are not perfectly corrected for (which will always be the case), like park, opponents, coaching, etc. For example, by coaching, I mean that you can measure a player’s defensive performance for an infinite amount of time and if that includes positioning dictated by or helped by the coaching staff, and that is not corrected for, then you still don’t know the player’s true defensive talent.
Whoever is complaining about Lagares and UZR, are you kidding me? The guy has a career UZR of 27 runs per 150 games in CF. That is like all-time Andruw Jones, Griffey Jr (in their primes) great. .3 UZR runs in 26 games in 2015? Seriously? If you think that means that UZR doesn’t think that he is a great CF’er, you know virtually nothing about how this stuff works, so perhaps you should just read and learn…
😉
That is EXACTLY like seeing a great hitter like Miguel Cabrera with an OPS of .750 after 15 games and declaring, “What a lousy stat that OPS is! It only has Cabrera as a .750 hitter! That can’t possibly be. I’ve seen him hit every game for the last 5 years, and he is a great hitter. .750 OPS? Hmph…”
It really isn’t exactly like that. OPS has almost zero measurement error on the outcomes that go into the calculation. If Miguel Cabrera has an OPS of .750 there is no argument about the outcomes. You might watch the games and think he had some bad (or good) luck on balls in play, but the .750 OPS is actually what happened. UZR and DRS are not like this at all. With these two statistics there are tons of errors in just assigning the outcomes. You can watch the games and think that Lagares played amazing in the field and disagree with the subjective scoring of the actual data going into the calculations. Just look at the correlations presented above. DRS and UZR use the exact same data to measure the exact same thing and the correlations are terrible!
For what it is worth, UZR, DRS, and all the other advanced defensive metrics are…
What they are. They are not fantastic and they are not terrible.
The correlations above suggest that they are pretty terrible.
Imagine two people are tasked with measuring the stature of a set of people. If you give them both a stadiometer (the appropriate tool for the job) the agreement between the measures of the two people will be extremely high. The agreement between the measures would be quite low, however, if one person decides he is going to measure stature by pacing back 20 steps from the person and holding up his outstretched thumb for scale, and the other person decides he is going to measure stature by laying the person down and walking heal to toe along them and counting the number of steps.
With the defensive measurements we’ve got one person holding up their thumb, and another walking heal to toe and counting steps.
Is Brett Gardner rated badly by UZR?
In the real world when you have more than 1 model and don’t know which represents the true value you average them for best results. When more than 2 models you may throw out any obvious outliers, but with only 2 you just have to average both. So use UZR and DRS and you smooth out some of the noise. Still should be regressing about 50% though
The biggest problem with WAR is the defensive position adjustment. As Hanley Ramirez has shown in LF, a SS is not necessarily 15 runs better than a LF’er just cause he plays “SS”. Until this is fixed WAR is a nice gimmick, not not much value in doing much except allow comparisons among players who play the same position. Middle IF bias to the extreme IMO, to Bill James delight which is probably why he has not slammed WAR as much as would have. As he said, he thought there was more to it. Sadly, no.
UZR compares the players at each position to the average at that position. So really just the averages are being compared not just one of the worst defensive players at either position.
That’s not to say we should be dogmatic about the positional adjustments, but that’s the way you’d have to evaluate it.