Aaron Nola’s Losing the Waiting Game
The Philadelphia Phillies are off to a more-than-reasonable start in 2019, standing at 11-6 and currently in first place in the NL East. In the early weeks of the season, the division has been as tight as expected, with only 2.5 games separating the four teams that had a reasonable preseason claim to 2019 relevance. What’s unexpected about Philadelphia’s early lead is that it has little to do with the performance of their ace pitcher, and 2018’s third-place finisher in NL Cy Young voting, Aaron Nola.
Nola has thrown four starts so far this season and has been terrible in three of them, all losses. Even more damaging is that all four starts have been against the NL East competition, meaning every loss in those games is a guaranteed win for the team’s direct rivals, no scoreboard-watching needed. Add it all together and you have a pitcher who is already nearly a third of the way to what would be his career-high for home runs allowed in a season, with a 7.45 ERA and a walk rate double what he posted in 2018.
So what’s happening with Nola? The obvious thing to do is to look is at his miserable walk and home run rates, and see if there’s any chance he’s not getting what he “deserves” from his pitching.
For a quick look at a pitcher’s walk rate, you can actually make a simple model that estimates that rate knowing just his plate discipline numbers. Knowing just that, you can get a surprisingly adequate estimation of what a walk rate “should” be. In this case, my very basic non-linear model with observations weighted by number of batters faced, gets the r-squared to 0.65. In layman’s terms, that means that approximately 65% of the pitcher-to-pitcher variance in walk rate is explained by the pitcher-to-pitcher variance of the inputs.
| Year | BB% | Predicted BB | O-Swing% | Z-Swing% | Swing% | O-Contact% | Zone% | F-Strike% | SwStr% |
|---|---|---|---|---|---|---|---|---|---|
| 2019 | 12.6% | 13.3% | 25.5% | 55.4% | 38.4% | 70.0% | 43.0% | 48.3% | 8.4% |
| 2018 | 7.0% | 6.2% | 33.2% | 64.2% | 47.0% | 60.9% | 44.7% | 69.4% | 12.4% |
| 2017 | 7.1% | 7.6% | 29.4% | 60.8% | 44.5% | 59.3% | 48.2% | 64.4% | 10.8% |
| 2016 | 6.0% | 8.0% | 29.5% | 55.7% | 42.2% | 61.5% | 48.3% | 60.7% | 9.6% |
| 2016 | 6.0% | 7.5% | 27.7% | 61.1% | 43.6% | 66.1% | 47.4% | 63.8% | 8.6% |
That’s a pitcher who’s largely earning a poor walk rate. One might think that Zone% is the a key statistics here, but it’s actually not; first-pitch strikes and swing percentages are far more relevant when predicting walk rate, with the r-squared for Zone% by itself only being 0.05. For the other two variables, it’s 0.41 and 0.29, respectively. Nola’s not throwing first-pitch strikes and batters are not swinging at his stuff at the usual rate. And when they do swing, especially at out-of-zone pitches, they’ve been far more likely to make contact than in the past. At a cursory glance, batters are taking a more patient approach with Nola, waiting him out, and largely getting the pitches they want.
This number tends to stabilize fairly quickly (52% of pitchers with at least 10 innings pitched are already within two percentage points of their actual walk rate), so it’s a statistic I tend to use when deciding whether to panic about a pitcher’s early walk rate. Since someone will no doubt ask, here are the top 10 departures from expected walk rate so far in 2019 (both good and bad).
| Player | Walk Rate | Predicted Walk Rate | Difference |
|---|---|---|---|
| Shelby Miller | 18.6% | 8.5% | 10.1% |
| Blake Treinen | 15.2% | 6.9% | 8.3% |
| Yu Darvish | 18.1% | 10.3% | 7.8% |
| Martin Perez | 15.7% | 7.9% | 7.8% |
| Chris Paddack | 11.3% | 3.6% | 7.7% |
| Jeremy Hellickson | 13.8% | 6.2% | 7.6% |
| Sean Newcomb | 13.8% | 6.9% | 6.9% |
| Domingo German | 14.0% | 7.2% | 6.8% |
| Rick Porcello | 17.7% | 11.0% | 6.7% |
| Liam Hendriks | 16.3% | 10.2% | 6.1% |
| Sonny Gray | 7.9% | 16.9% | -9.0% |
| Trent Thornton | 8.9% | 16.1% | -7.2% |
| Patrick Corbin | 5.3% | 11.7% | -6.4% |
| Dereck Rodriguez | 4.4% | 10.7% | -6.3% |
| J.B. Wendelken | 4.1% | 10.4% | -6.3% |
| Tyler Skaggs | 3.2% | 9.1% | -5.9% |
| Adam Warren | 7.3% | 13.1% | -5.8% |
| Josh Hader | 5.6% | 11.1% | -5.5% |
| Zach Eflin | 1.5% | 6.8% | -5.3% |
| Robert Gsellman | 4.2% | 9.1% | -4.9% |
A simple look at Statcast also suggests that Nola’s getting hit a lot harder than in the past. His average exit velocity has jumped from 85.9 mph to 90.0 mph and his barrel-percentage has doubled. The algorithms of Willman, Petriello & Friends predict that a player with Nola’s profile ought to be allowing a .490 slugging percentage; hitters are actually slugging .533 against Nola. So while one can say he’s getting hit a little harder than expected, you still don’t want any of your starting pitchers to be that crushable. In 2018, only a single qualifying pitcher allowed a slugging percentage worse than .490: Dylan Bundy at .523, with a shocking difference between him and Jakob Junis in second place at .455.
So why is it happening? That’s a tricky question, in that there’s no giant red flag, no significant dip in velocity or worsened movement on his pitches. You can see a lot of what’s going on with that first-pitch strike percentage, which shows a troubling difference from 2018. Last year, batters swung at 29% of Nola’s first pitches, whiffing on 28% of those swings. This year, those numbers are 18% and 19%. Nola’s started off 32 plate appearances this year throwing a curveball and he’s gotten a swing-and-miss on…zero. It’s a similar story with his fastball. 27% of his first-pitch fastballs resulted in a 1-0 count last year. This year, that number is 55%.
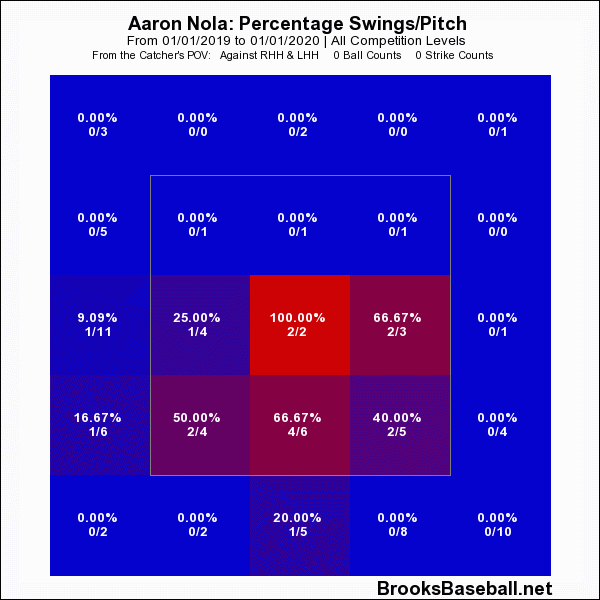
From this graphic, Nola’s thrown 60 pitches outside the strike zone on 0-0. Batters have swung at only three of them.
At least in the early going, batters seem to simply be taking a more passive approach to Nola after his breakout 2018 season, and he hasn’t adjusted. And he’s getting away from some of the things that he did successfully in 2018, such as daring to throw curves to lefties when behind in the count (he’s dropped from 39% to 20%). Batters are more patient and Nola’s been more predictable.
With the division expected to remain a tight race, every loss is of enormous consequence. ZiPS estimates that Nola’s four starts, when you combine what he’s already done and the decline in his projection, will eventually cost the Phillies 1.2 wins from their preseason forecast. To get an idea what this costs the Phillies in terms of their October fate, I set ZiPS to project the Phillies with Nola performing as predicted before the season (3.9 WAR prorated over the remaining games) and how Nola is predicted to perform now (3.4 WAR), along with a few worse projections, based on how long it takes Nola to get back to where he should be.
| Nola Rest-of-Season WAR | Phillies Division % | Phillies Playoff % |
|---|---|---|
| 3.9 | 25.2% | 58.1% |
| 3.4 | 23.1% | 55.0% |
| 3.0 | 21.5% | 52.7% |
| 2.0 | 17.8% | 46.7% |
| 1.0 | 14.5% | 40.7% |
| 0.0 | 11.5% | 34.8% |
The Phillies are surviving so far without Nola in top form, but the longer it lasts, the more damaging it becomes to the team’s playoff hopes. It’s not time for Philadelphia to panic about their star pitcher, but with it unlikely that there’s a pitcher equally as good available for trade, it’s time to mix in some serious concern with the cheesesteaks.
(Please note that I don’t mean ketchup. Please don’t do that ever.)
Dan Szymborski is a senior writer for FanGraphs and the developer of the ZiPS projection system. He was a writer for ESPN.com from 2010-2018, a regular guest on a number of radio shows and podcasts, and a voting BBWAA member. He also maintains a terrible Twitter account at @DSzymborski.
Wow. I feel like I learned something! This was a really cool dive into cause/effect!
(down with ketchup)
Just count yourself lucky that you can eat cheesesteaks (no matter what you put on it). Because of my damaged nervous system, I can’t eat any high-protein foods at all.
Great breakdown about Nola’s trouble, nonetheless.
Love to see the math used in respect of traditional baseball-isms like ‘the best pitch in baseball is strike one’.
absolutely. Not all traditional thinking has to be wrong; it’s cool when advanced analytics can help explain the importance of that stuff, like 1st pitch strikes. I eat up articles like this, very helpful
The bit about Zone% not being predictive of walk rate is eye-opening. I’m going to have make a conscious effort to pay more attention to F-Strike% now.
I usually learn something from Dan’s columns. Thanks again!
Eyeball report from Nola’s last start, vs Mets — A lot of pitches were clearly going to miss the zone, upon first recognition.
Is there a stat for average out-of-zone distance? I’m not real hip to the new data, but my gut says there’s a big value difference between “competitive” misses and those that put no pressure on the batter.
I remember Jeff used to occasionally write articles that referenced “competitive” pitches (as opposed to “wasted pitches”) but I don’t know where he got the data from. Baseball Savant presumably?
There’s this new-ish category in Savant called ‘Attack Zones’ that has ‘chase’ and ‘waste’ categories for pitches outside the zone. It replaces an old set they had that was called ‘detailed zones’ and did a similar thing. It’s not perfect but it’s trying to do that.
Interesting stuff.
Have you actually tested to see if the formula predicts future BB% better than RoS (Steamer/BAT/ZiPS) projections?
Worth noting that all four of Nola’s opponents are in the top 12 in team BB%. Adjusting for schedule is crucial for assessing small samples.
Agreed. People like to show how certain stats stabilize after a certain number of games/pitches/appearances, etc. That might be true on a league-wide view, when taking a random sample, but does it really work on the individual-player level when you’re dealing with an unbalanced schedule? He has faced solid offensive teams in every start so he hasn’t had a chance to even things out.
On the flip side, a player might have faced (more than once) deGrom, Syndergaard, Strasburg, Scherzer, Corbin, and Wheeler by now. If his strikeout rate is higher than it’s been in previous years – it that because he’s worse, or because half of his games are against great strikeout pitchers?
It’s basic quality control when writing April articles, but it almost never happens
Article good.
Ketchup on cheesesteaks also good.
You know nothing Jon Go
Is there a way we can email this to him because I really need him to step it up.
Flat out great piece, and a bit of a relief (if the conclusions are accurate). Having only listened to his starts on the radio, I thought there was something way off in movement or velocity. He seems to have the makeup to handle the adjustments.
Oh, and ketchup on a cheesesteak is an absolute must, unless you’re talking about the tourist-trap places with Cheese Whiz in South Philly.
Nearly everyone in Philly I know puts at least a bit of ketchup on their neighborhood cheesesteak*
*Or, as A-Rod called it, “cheese sandwich.”
update the 3 year zips
What’s the model for predicted walk rate?
Small sample size could explain his bad start