
Alex Rios And Problems of Perception
Everybody remembers the movie Inception, right? Nice visuals, convoluted premise, and that killer score – a more than sufficient popcorn delivery system. Fun fact: the main plot point of inception, that an idea can be planted in someone’s subconscious without them realizing, is real!
At some point this summer, exasperated Texas Rangers writer/blogger/fanalyst Jamey Newberg tweeted something to the effect of “Alex Rios is one of those players whose production will never line up with his numbers.” At first, I was offended. A player produces what he produces, his numbers reflect his….production. But the thought, the idea that a player is less than his final stat line, it stayed with me. I couldn’t shake it.
Then the offseason rolled around. The crop of available outfielders is charitably described as “very much ungood” and then a bunch of guys signed. One of those signees, Nick Markakis got four years and an AAV north of $11 million, to the surprise of many. And then, piling shock on top of shock, Rios himself signed a one-year deal with the Royals for $11 million.
There are plenty of reasons to scoff at the big outfielders contract. Entering his age-34 season, Rios comes off a rough season in Texas. He produced right at replacement level in 2014, displaying a worrisome lack of power (just four home runs and a career-low .118 ISO) and he missed time with injury, as older players are wont to do.
But more than most players, Rios’ problems are matters of perception. There are many reasons to not like Rios as a player or this signing in a vacuum, all factors that I believe contribute to the shrugs and disbelief when news of his Kansas City contract broke.
Most pressing, the concern expressed by the Rangers fan above: does his production lag behind his numbers?
The idea that a given player’s numbers might be hollow is tough to prove and even tougher to make stick, given the fickle nature of “clutch” performance. But, if we zoom out a bit, sometimes a pattern emerges.
Below is a plot of all batters with more than 1500 plate appearances over the last decade. It graphs their weighted runs above average (wRAA, the main offensive component of WAR) against their REW24, which includes base out context in measuring the value of a given offensive event. This graph highlights players close to league-average as a means to focus on Rios.
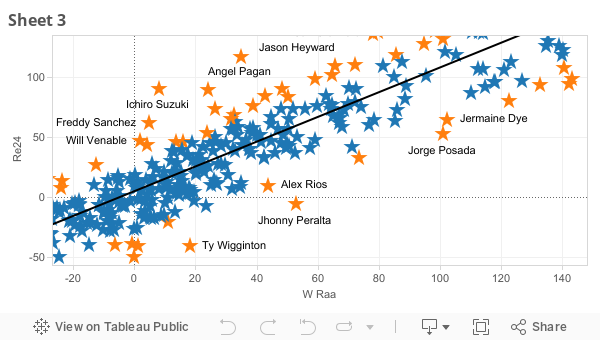
(click here to see the full chart)
The relationship between the two is strong (r squared = 0.9288) and it serves our (my) purposes well. All players more than one standard deviation (around 30 runs) off the mean are highlighted in yellow. There, with a 30 run differential between his RE24 and wRAA, sits Alex Rios.
Rios consistently underperforms in terms of RE24 relative to his overall numbers. Rios has played on a good team exactly once in his career (the 2013 Rangers, to which he came as a deadline acquisition and actually played quite well), with a grand total of zero postseason at bats to his name.
A player without a great deal of exposure during baseball’s playoff pressure cooker, a player who bounced around a little bit during his career (and one who made an ugly exit from the team that drafted him), one who didn’t build up the “gritty grinder” reputation like his mirror image Nick Markakis, and suddenly you have a player well on his way to falling through the cracks.
There are many names on the above scatter plot who “fail” to produce situationally in a way that represents their true talent and it didn’t prevent them from signing lucrative, long-term deals. It isn’t a deal-breaker but it contributes to the view of a player is viewed by fans and, perhaps, front offices.
*Rios’ former team, the Texas Rangers, are reportedly pursuing Jonny Gomes, rather than trying to bring Rios back into their fold. A cheaper option (because he’s older and worse) who offers nearly the same core ability – hitting left-handed pitching. Gomes boasts an ineffable quality that teams seem to love while Rios…does not.
Doubling down on Rios’ troubling inability to produce “when it counts” are his wild swings in value. Terrible seasons sandwiched between very good, above-average years. Compared to the reliably 2 WAR Markakis, Rios yo-yos up and down and makes it hard to get a good read on him.
Source: FanGraphs — Alex Rios, Nick Markakis
By signing Rios, the Royals are betting on a bounceback from the notoriously hit-and-miss player. It’s just a one-year deal and they have contingencies like Jarrod Dyson and others ready to take over if Rios’ bat truly slowed down and his career is mostly over, not just waning. As Dave notes over and again, teams are paying a premium for these kinds of plug-ins, risking little in the long term but coughing up more for a low-ceiling lottery ticket.
Unfortunately for the Royals, our projection systems don’t care about perceptions. They don’t think of Rios as undervalued because of historic inabilities to produce when it matters. They forecast him as a 1 WAR outfielder, an aging player without much power and slowing legs to drag down his defensive contributions. Basically the same guy that sleepwalked through his final season in Texas, in other words.
Is Alex Rios a good bet in this environment? When presumably worse players are getting longer and richer deals, a team in Kansas City’s position can take on this minimal risk, secure in their belief that he can be the guy of 2012 and 2013 again. So long as they don’t ask him to deliver the kind of impeccably-timed base hits that fueled their World Series run.
Drew used to write about baseball and other things at theScore but now he writes here. Follow him on twitter @DrewGROF
Should I find the Rios signing irritating after hearing that Michael Morse is in Miami for 2 years and less overall money? I feel somewhat irritated. I would rather have had Rios than Morse, but why such a discrepancy in $$? This has been a hella-weird offseason.
It’s $11m versus $12m. The only difference is the payment plan.
No…
It’s $11m vs $6m (x2)… He’s wondering why one year of Rios costs nearly twice as much as Morse.
Because Michael Morse can’t play the outfield, regardless of what his player card says. Alex Rios can at least do that.
No income tax in Florida “adds” $700K to Morse’s overall contract.
The initial report said Morse got 2 years and $8 million, my comment was based on that figure. Now the $12 million figure is popping up in reports.
2 years, and $16 million plus potential incentives
trying to understand this better.
Rios, in actual contexts, performed worse than he should be? So his doubles were worth less, maybe he was stranded on 2nd or did not drive in runners? Or is it leverage based?
It’s based on run expectancy before his plate appearance vs after his plate appearance.
The stat comparison here is essentially saying that Rios is getting a disproportionate amount of his hits with 2 outs or without men on base.
Agreed with the weird offseason comment. Bad teams like the Astros and White Sox are signing role players that typically end up on contenders and last year’s division winners have done very, very little.
and last years World Series champ has done very very…. nothing.
The Giants have gaping holes at 3B, LF and the back end of the rotation and havent done anything yet.
the Giants can fill 3B from within – Duvall, Duffy, Posey (Susac catching). they do appear a little light in LF though but I think they can and should make a play for Justin Upton. That seems like a solid fit.
And they’ll probably either wind up with Shields or Peavy so that doesn’t concern me. Losing Romo is another matter. But they could easily add a guy like Papelbon w/o giving up that much talent it seems, if the Phils want to move the contract. iow, there are things they can do and likely will.
If you think that duvall can play 3rd you are in for a bad time.He was absolutely horrendous in two consecutive seasons in AAA that he got moved to first (before the call up). And there is absolutely no chance of posey moving off catcher, except to first in a handful of years because of his bat. So you’re stuck with duffman and arias as in-house options, neither of which should be everyday players for a competitive baseball team. Now Duvall could maybe get thrown into LF in a Morse-like role with a bit more platoon with the underrated blanco, but I don’t know how viable that would be. In any case, as the team currently stands, LF and 3b are absolutely gaping holes no matter how you slice it.
This (2015) is their year not to win.
Remember the Giants can’t compete in an odd year. They will spend their money next year to win another World Series in 2016.
Well, this can’t possibly be right. Mr Clutch himself, Derek Jeter, has a 126.9 RE24 and a 134.9 wRAA on this chart, placing him below league average. I think you need to re-weight the variables so that Mr. Clutch becomes a standard deviation above league average in clutchness and then we can really see where Rios stands versus his peers. Otherwise, this is a nice first effort.
ok, can someone more educated than I give me an explanation of REW24?
Every base-out situation–runner on first with one out, bases empty with two outs, bases loaded with no outs, etc.–yields a certain expected value for the number of runs that will be scored in the inning. This is called the Run Expectancy for that stat. This is calculated (I think) by taking the average probabilities of different outcomes for each at-bat and running sims to see how many runs score from a given situation if you just pick random things to happen from that point on. (The 24 in the stat name comes from the 24 different base-out situations–eight ways for the runners to be on bases times the three possible out situations.)
RE24 measures the difference between Run Expectancy before and after the at-bat. In the simplest case, the RE24 of a solo home run, or a run-scoring double with a man on second, should always be 1.000; it leaves the game in the exact same base-out situation but with one more run in. To pick a more complicated examples, let’s take a no-out grand slam. According to Baseball Prospectus’s Run Expectancy matrix, with no outs and the bases loaded we can expect 2.234 runs to score in the inning. After the grand slam there are four runs in, and we have the bases loaded and no outs, which means we can expect 0.455 more runs to score in the inning. So our total run expectancy for the inning is 4.455, and we have a total RE24 for that at bat of 4.455-2.234=2.221. The RE24 is less than 4 because even before the grand slam there was a good chance that some of those runs would score.
By contrast, hitting into a 1-2-3 DP with the bases loaded would score no runs and leave men on second and third with two outs. The RE for the latter situation is 0.535 so the RE24 for the double play is -1.699.
REW24 is just a typo, I think. Finger overslid the E key.
I appreciate the sample size you have here, but I just don’t think the context specific is contextual enough. There are so many factors that are not captured in this data. For example, if there is a runner on first and that runner has zero chance to steal or threat to steal, that will likely impact the number of fastballs thrown to Rios. Same goes if there is no one batting behind Rios, pitchers surely aren’t going to give Rios (a guy with power) something he can hit. Its important to remember that creating context-specific models leaves your output vulnerable to the context your not capturing. Is Rios result due to his team or his performance? You can see how that causal connection could be crossed.
As I read the original hypothesis, I think the production lagging the numbers would be more accurately tested by looking at Rios performance vs. the bad pitchers or in blowout games. That’s the most common issue I see….guys like Pedro Alvarez or Chris Carter feast on #4 or #5 pitchers or mop up guys that are tossed in after the game is out of hand, but they have zero chance against any team’s #1-#2 guys. That is production that is worthless.
But isn’t that how it is for most/all players? Is anyone actually better against aces?
Of course a player is going to be worse against an ace, but there is a difference between 20% decrease in product vs an ace and a 60% decrease in production. I think there are plenty of guys that feast on poor pitching, but aren’t nearly as good a hitter as their stat line may show at the end of the season.
When we talk about the elite hitters in the game, Miguel Cabrera, Matt Holiday, maybe Hunter Pence this past post-season, they can battle an ace.
Tony Gwynn: .444 against John Smoltz, .415 against Greg Maddux, .390 against Curt Schilling, .333 against Pedro Martinez, .303 against Tom Glavine. Gwynn also, in 366 plate appearances against those 5, struck out just 5 times.
Pedro Alvarez vs. Adam Wainwright: 738 OPS
Everyone else vs. Adam Wainwright: 650 OPS
Zero chance!
And Chris Carter has a 1.700 OPS vs. Jeff Samardzija and a 1.117 OPS vs. Corey Kluber, but a .367 OPS vs. Jason Vargas.
I’d feel bad about cherry-picking pitchers instead of looking at stats systematically, if I thought you’d looked at stats at all in making your judgment. You know any easy way to look this up?
And by the way, if you want to adjust for production occurring in blowout games you should look at WPA or Clutch scores, which calculates how batters affect the probability of winning the game–it’ll discount blowouts because the game is mostly decided. Rios’s Clutch is at -1.15 for his career, which is middle of the roadish. The highest Clutch since 2004 is Willie Bloomquist (of course) and the lowest is Adrian Beltre.
I think Rios is a bigger name than he should be mostly because he has been an incredibly useful fantasy player for a number of years, but it essentially amounts to an “empty batting average” in the real world.
I wonder how much is from his mediocre/bad obp, especially lately?
So the 2012 White Sox weren’t a good team? Sure, they ran out of gas, but on September 18 they were 81-66 with a three-game lead over the Tigers.
That ish still makes me so mad.
the only problem with Rios is that he stinks. this deal is a real head scratcher.
Rios has a WAR of 3.1 or higher in 6 of the last 9 seasons…maybe the majority of the players on his teams sucked…
well he’s only ever played for 3 teams that were outright bad – final year in Toronto, final year in Chicago, final year in Texas – and in two of those he was traded mid-season to a contender. Other than that he played for teams that were near .500 or better. Can’t really buy the “he’s never played on good teams” argument.
I can tell you that you will not find many people in the Jays organization that will give the guy a glowing character reference. Of course that doesn’t mean he can never have team success, but his situation seems very analogous to Yunel Escobar: very physically talented, quite productive at times and not carrying huge price tags, but why do they get dropped like hot potatoes as soon as their production slips? And noted character issues in both cases.
It’s possible I have completely misunderstood the central premise of this article and if that’s the case, I apologize. The full chart shows that (based on RE24 vs. wRAA) Carl Crawford, Carlos Beltran, Juan Pierre and Ichiro performed better than Adrian Beltre, Robinson Cano or Troy Tulowitzki. I have a hard time with that.
What the graph is trying to say is that there is, generally and with a strong confidence interval of r = .92, a positive correlation between wRAA and REW24. Meaning that when a players wRAA is large then so is their REW24. The line on the graph is what would be the expected REW24 if a players wRAA was a certain value. Thus with Robinson Cano he has a wRAA of 235.2, higher than about 95% of the sample, his REW24 is 169.9, still higher than about 90% of the sample. However, if we use the line that is given on the graph, which pictures what the expected REW24 would be (with the equation REW24 = 1.03048*rWAA+4.53235) 246.9. That number would put him on the line right next to Hanley Ramirez. In the case of Juan Pierre, the numbers work the exact opposite way, but that does not make Pierre a better hitter in the ‘clutch’ situations described by REW24. Pierre’s wRAA and REW24 are still negative, worse than Cano by a extremely substantial margin, but what Pierre does is outperform his expected REW24 given his wRAA, by a pretty large margin as well. When looking at Cano you would say he is less ‘clutch’ than those that around his wRAA like Hanley, Chipper Jones, Adrian Gonzales and Joe Mauer and Juan Pierre is much more clutch than those around his wRAA like Alcides Escobar, Corey Patterson and Nick Punto. Comparing Pierre to Cano is not how one should look at this graph.
Thanks for the explanation. Makes more sense to me now.
So the Blue Jays teams from 2006-2008 were chopped liver? 87 wins in 2006 and 86 in 2008 are nothing to sneeze at, not to mention the 87 and 93 wins Pythag had for the 2007-8 teams. Sure, they didn’t win the division or the Wild Card, but they were among the best teams in the AL (maybe less so in 2007, when they only actually got 83 wins).
(I feel like I might just be paraphrasing an old GRoF post, btw.)
I couldn’t find the one I was thinking of, but behold!
Inception was not a good film. It’s visuals were unimaginative, it’s score torterous, and it’s story pitiful. People definitely have a problem perceiving that film.
It was better than average, IMO, probably a little overrated, and has absolutely zero re-watch value.
Remember, it took three or four films for people to finally stop calling M. Night Shayamaln a genius, so yeah on the whole perception thing.
Ironically Markakis is also seen as an underlier on the graph. He’s the yellow star to the right of the name “Jermaine Dye”
Cliff Floyd seemed to me to be similar in underperforming his stats, despite having some excellent seasons.