An Emergency Hackathon: Multiple Swings at Analyzing Two-Strike Approach

Growing up a Yankees fan, I quickly became familiar with many Michael Kay-isms. Every home game starts with a “let’s do it here in the Bronx,” every home run elicits a “see ya!” and every caught stealing followed by a home run prompts a lecture on the fallacy of the predetermined outcome. Some of these sayings are worthy of further examination. For example, Kay’s favorite “fallacy” — assuming that the runner who was caught stealing would have scored had he not failed to swipe a bag — warrants a second look, but there’s another one that I’ve always been especially intrigued by, one more ripe for analysis.
When a hitter expands the zone on two strikes, waving in the wind to try to extend the at bat with a foul, Kay describes their swing as an “emergency” or “defensive hack.” There’s no doubt that hitters chase more with two strikes: in 2021, they pulled the trigger on 39.0% of two-strike balls but only 22.0% of other wild ones. In 2022, those numbers were 40.3% and 23.5%, respectively. But given the ever-present nature of strikeouts in today’s game, I’ve wondered if some players have lost any semblance of two-strike panic, not minding the K and not bothering to try to fight off pitches. On the other hand, maybe the increase in strikeouts indicates a further expansion of the zone in tandem with less contact in this era rife with three true outcomes types (see Gallo, Joey).
A related question, which I explored during my swing-mirroring forays, is whether some hitters are more loss-averse than others. Previously, I had discovered that hitters’ first-pitch swing rates (FPS%) increase on average following teammates’ hits or strikeouts. I thought that social influence was the driving force behind both phenomena, so I was perplexed when it turned out that hitters whose FPS rates increased even more than average following hits tended to have FPS rates that increased less than average (or even decreased) following strikeouts. Before I demonstrate that result in graphical form, here is a refresher on what each z-score (for FPS differentials) indicated:
| Other – Ks | Other – Ks | Other – (1Bs + 2Bs) | Other – (1Bs + 2Bs) | |
|---|---|---|---|---|
| Year | 2021 | 2022 | 2021 | 2022 |
| Mean | -3.0 | -2.3 | -5.0 | -3.9 |
| SD | 6.5 | 7.1 | 6.6 | 6.5 |
| Z = 0 | -3.0 | -2.3 | -5.0 | -3.9 |
| Z = 1 | 3.5 | 4.8 | 1.6 | 2.6 |
| Z = -1 | -9.5 | -9.4 | -11.6 | -10.4 |
And the graph below, using 2022 numbers, is for illustrative purposes, without control variables included. But even when they were, the result’s statistical significance stood (despite the subtlety of the effect):
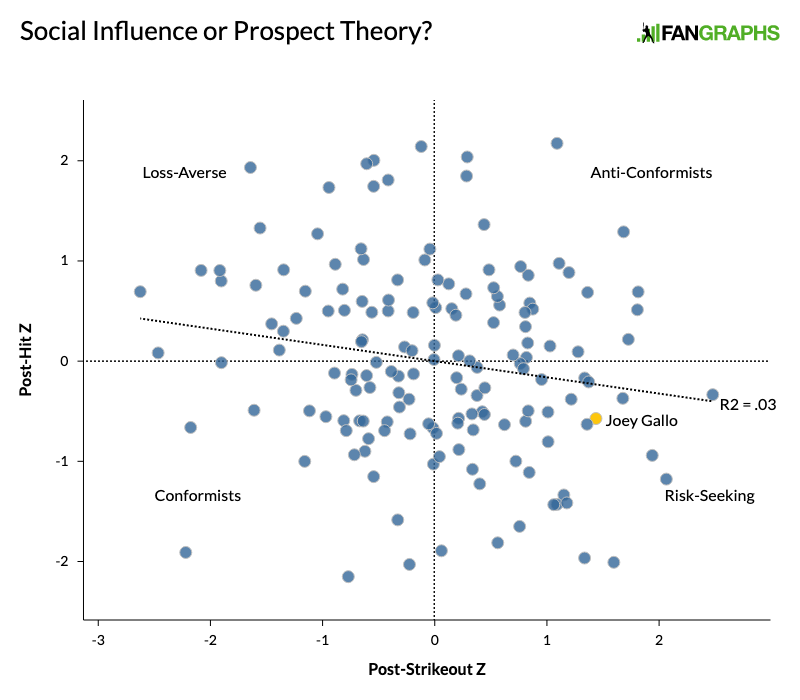
If both post-strikeout and post-hit FPS% are about conformity, why are the two inversely related? And why did I label each of the four quadrants in the graph above? Because of Prospect Theory, a Kahneman and Tversky product that describes the human tendency toward loss aversion. In a nutshell, people tend to be more sensitive to a loss than a gain of the same magnitude. While this behavioral conservatism may have helped keep us alive during the Stone Age, the impact today is that, on average, a potential payout for a behavior has to be larger than a potential loss in order to encourage said behavior. Yet this is only on average; there are individual differences in loss aversion just as there are individual differences in susceptibility to social influence.
I described loss-averse hitters as those at the high end of the post-strikeout FPS increasers and the low end of the post-hit FPS increasers (the top-left quadrant in the graph); they are more concerned with avoiding strikeouts when their peers do than they are with getting hits when their peers due. Risk-seekers (bottom right), on the other hand, don’t mind the occasional strikeout in exchange for more base hits during a rally.
How sticky are any of these labels from year to year? I conducted a series of logistic regressions (best for binary variables) to find out. I used a hitter’s presence or absence in each group during the 2021 season to try to predict which group they would end up in for ’22. This is a bit of a quick-and-dirty method, but the results are listed below, using the logit’s version of r-squared (called “pseudo” r-squared):
| Loss-Averse ’21 | Risk-Seeking ’21 | Conformist ’21 | Anti-Conformist ’21 | |
|---|---|---|---|---|
| Loss-Averse ’22 | .00 | .02 | .01 | .00 |
| Risk-Seeking ’22 | .00 | .00 | .00 | .00 |
| Conformist ’22 | .01 | .00 | .00 | .01 |
| Anti-Conformist ’22 | .00 | .01* | .02** | .00 |
| * p < .10, ** p < .05 | ||||
There was hardly any signal here. The most meaningful result was that being a conformist in 2021 indicated a lesser likelihood of being an anti-conformist in ’22, which does make sense, but I had been hoping for more robust findings.
So I went back to the drawing board, and that (in addition to my hours of listening to Michael Kay) is how I ended up on the two-strike approach idea. This endeavor yielded far more significant results.
I was interested in the difference between two-strike chase rate and chase rate otherwise; I wanted to see whether those who truly expand the zone on two strikes (relative to their normal chasing tendencies) fall in the risk-seeking category or the loss-aversion group. In other words, I was curious whether two-strike chases were really emergency hacks (i.e., loss-aversive behaviors) or just representative of the normalization of the strikeout (more risk-seeking).
Another positive of this approach is that I wasn’t nearly as restricted in my sample size cutoffs as I was with swing-mirroring. The swing-mirroring demoninator — the number of first pitches after a hit or a strikeout — was pretty small for most hitters; there were only 158 players who hit after at least 50 strikeouts and at least 50 singles and/or doubles in both 2021 and ’22. By contrast, the denominator for chase rate calculations is just number of balls; I could get a comparable sample size, of 155, for players who saw at least 400 pitches outside the Statcast strikezone on two-strike pitches and 400 pitches outside the zone in other counts (i.e., at least 800 total) in both 2021 and ’22.
And 400 just so happens to be the magic number for statistical stability for the normalized chase-rate difference. In case you’re unfamiliar with the concept, Russell Carleton, now of Baseball Prospectus, pioneered the idea of statistical stability. Specifically, he sought benchmarks for when a given statistic could explain a certain amount of the variance in itself across two samples. The explanatory benchmarks vary based on the sampling method, but I chose to focus on sequential samples; the benchmark there is around 49% of the variance, or an r-squared of .49.
For both non-two-strike chase rate and two-strike chase rate, I found that sequential samples of 270 balls within the same season yielded r-squareds of around .49 (.50 for the former and .51 for the latter for 2021). Statistical stability is most often used early on in the season to determine when a player’s results so far are likely to hold up for the rest of the year, so the sequential sampling method made sense in this case.
But there were no hitters who saw two samples each with 270 balls for both chase opportunities of interest in 2021, and only one hitter (Matt Olson) who did so in 2022. A decent sample size of 184 hitters saw two samples each of 135 balls for both chase opportunities within one season, but the r-squared across the two samples was only .15. So I pegged the chase-rate difference statistic as more useful for prediction across seasons. This isn’t necessarily what Carleton had in mind, as inter-sample reliability is typically more robust when we can maintain the same basic environmental factors, but bear with me here, because that’s how I was able to reach (or at least near) the magic r-squared plateau.
My aforementioned 155-hitter sample yielded an r-squared of .47. The statistic’s ability to predict itself (from 2021 to ’22) proved robust to controls for zone percentage and average number of balls already in the count (for both two-strike and other situations), as well as a control for overall K-rate and the proportion of at bats that reached two strikes for the hitter in question. All controls were from 2022 statistics. After removing unhelpful predictors, average number of balls (for both situations), zone percentage (for non-two-strike situations), and overall K-rate remained in addition to the previous season’s chase-rate difference. The controls improved the model’s r-squared to .70.
Interestingly, overall K% correlated with a smaller chase-rate difference — specifically, a 10% increase in K-rate corresponded with a 3% drop in chase-rate difference. For context, recall that the average chase-rate difference is around 17%. For this sample, it was 16.9%. So hitters that strikeout more, like Gallo, tend to have smaller chase-rate differences. Despite his K-rates of 34.6% and 39.8% in 2021 and ’22, respectively, his chase-rate differences were just 9.7% and 6.5%. In other words, he doesn’t mind (as much as others) taking something that isn’t his pitch even if it means striking out. At the same time, given his contact-making difficulties, this might not be because of any risk-seeking behavior, but rather a recognition that two-strike panic wouldn’t get him anywhere. Like Gallo, hitters who strikeout more tend to make less contact, so that may be why they don’t bother trying to fight pitches off on two strikes.
But is there anything to my risk-seeking idea? I had one last box to check before I came to a conclusion either way. I joined my swing-mirroring and two-strike approach datasets, narrowing my sample to 145 hitters who fit both sampling requirements. Here’s what I found:
| Year | Loss-Averse | Risk-Seeking | Conformist | Anti-Conformist |
|---|---|---|---|---|
| 2021 | .00 | .00 | .00 | .00 |
| 2022 | .03** | .02* | .00 | .00 |
| * p < .10, ** p < .05 | ||||
While 2021 yielded nothing significant, in ’22, I found the relationships I expected: the higher the chase-rate difference, the higher the likelihood a batter had of falling into the risk-seeking group. Further, the higher the chase-rate difference, the lower the likelihood a batter would end up in the loss-averse group.
Given that these results don’t hold for both years I examined, even if the relationships are present, they are likely not super impactful. The bigger takeaway is that teams should anticipate that higher strikeout hitters will expand the zone less than their teammates on two strikes because they know they’d have a harder time fouling off tough pitches. In other words, pitchers shouldn’t be afraid to pound the zone against higher strikeout hitters in these counts.
Another important takeaway is that you shouldn’t mute your local team’s broadcast. Even if it isn’t the most analytically inclined, there is value in learning the conventional wisdom surrounding the game and also just hearing another baseball watcher’s observations. You never know when a catchphrase might turn into a 1,600-word article.
Alex is a FanGraphs contributor. His work has also appeared at Pinstripe Alley, Pitcher List, and Sports Info Solutions. He is especially interested in how and why players make decisions, something he struggles with in daily life. You can find him on Twitter @Mind_OverBatter.
“Another important takeaway is that you shouldn’t mute your local team’s broadcast.”
I will say muting (or not listening to) National Broadcasts can help improve one’s happiness in some cases. If it was an option, I’d opt for just the sounds of the game/crowd without national broadcasters. I like my team’s current local guys, but 10 years ago, I would have prefered only the game sounds to the local guys.