
Are Starters Improving Relative to Relievers?
If you read about baseball on the internet these days, it’s tough to miss pieces on the changing relative skill levels of relievers and starting pitchers. As Sam Miller pointed out on Effectively Wild, relievers have a higher ERA this year than starters. Not only that, but the strikeout rate advantage relievers have traditionally had over starters is plummeting. Look at almost any statistic, and the historical edge relievers have had over those in the rotation has diminished.
At the same time, relievers are setting volume records left and right. For five straight years, relievers have set a new record for largest share of pitches thrown. In 2012, Rockies relievers struck out more batters than Rockies starters for the first time in baseball history, and you could convince yourself that it was a Coors field oddity. In the next six years, however, four more teams did it. From a bulk perspective, relievers are pitching more and more innings, carrying ever more of baseball’s pitching workload.
Clearly, these two effects are correlated. You’ve undoubtedly heard of the times-through-the-order penalty, the concept that starters fare worse each time through the batting order. In tandem with the innings spike by relievers, the number of pitches starters throw their third time through the order is plummeting. It’s not rocket science — the third time through the order is the time when starters are weakest, and those weak points are disappearing. Of course starters’ stats look better!
Given the changing roles of starters and relievers, it’s probably not right to look at unmodified splits to figure out whether starters are actually getting better relative to relievers. Even if the talent level of every pitcher remained exactly the same, cutting out a chunk of third-time-through plate appearances from starters’ cumulative totals will change their statistics. To actually see whether relievers are getting better relative to starters, we’ll need to do something a little fancier.
With copious database assistance from Sean Dolinar, I came up with an idea. What if we could just look at starters and relievers their first time through the order, and strip out non-representative at-bats from each of those samples? Giving starters credit for blowing away pitchers defeats the purpose of this analysis, for example, because relievers basically never get to face pitchers. To handle this discrepancy, we looked only at pitchers’ performance against the first seven batters in a lineup (as a few teams bat their pitcher eighth), and only the first time through that lineup.
Now, as you might expect, this narrows the gap between starters and relievers considerably. Limiting our sample to the first time through the order barely changes relievers’ stats: in 2018, for example, relievers only faced 3,459 batters a second (or third!) time, as compared to 71,212 batters the first time through. Starters, on the other hand, get to discard a ton of challenging situations. Right there, you’d expect to see a large narrowing in skill differential.
In fact, if you don’t look too closely, you might be inclined to say that the times-through-the-order penalty was the only reason relievers looked better than starters all along. This year, for example, starters have allowed a .313 wOBA the first time through the order against 1-7 hitters. Relievers, on the other hand, have allowed a .319 wOBA over the same split. There’s just one problem, though. Starters haven’t always been better than relievers the first time through the order. Take a look at the difference between wOBA allowed for the two cohorts over time. One note: in this and all following analysis, I’ve stripped out intentional walks.
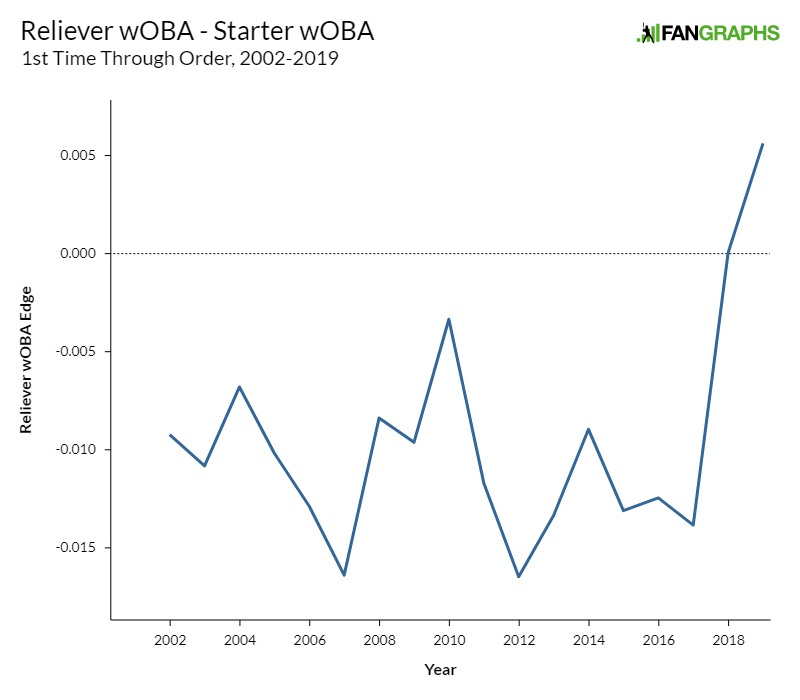
For the most part, relievers enjoyed a consistent advantage over starters, even controlling for times through the order. Last year, though, that edge disappeared completely, and this year starters have taken the lead.
It’s not just wOBA, either. Take a look at strikeout rates using the same data set.
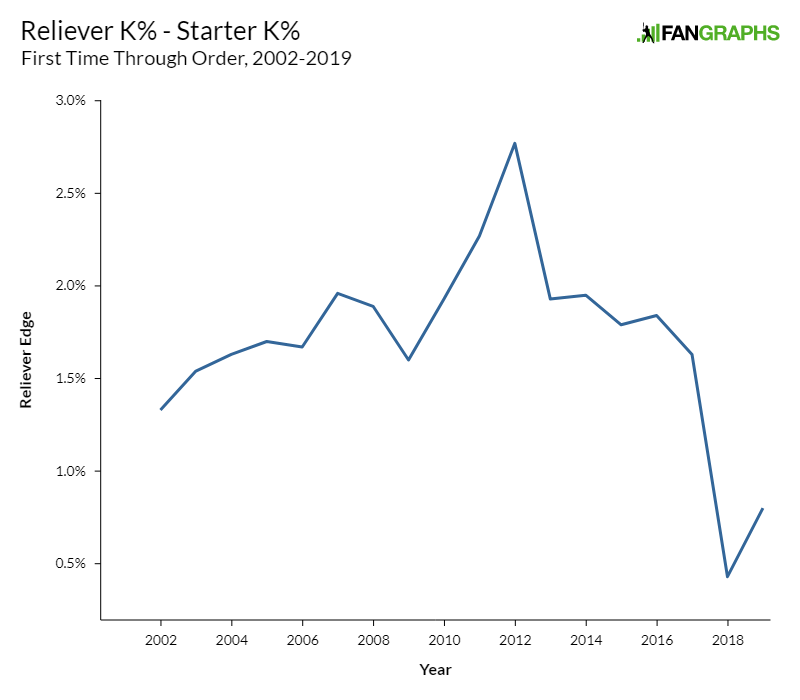
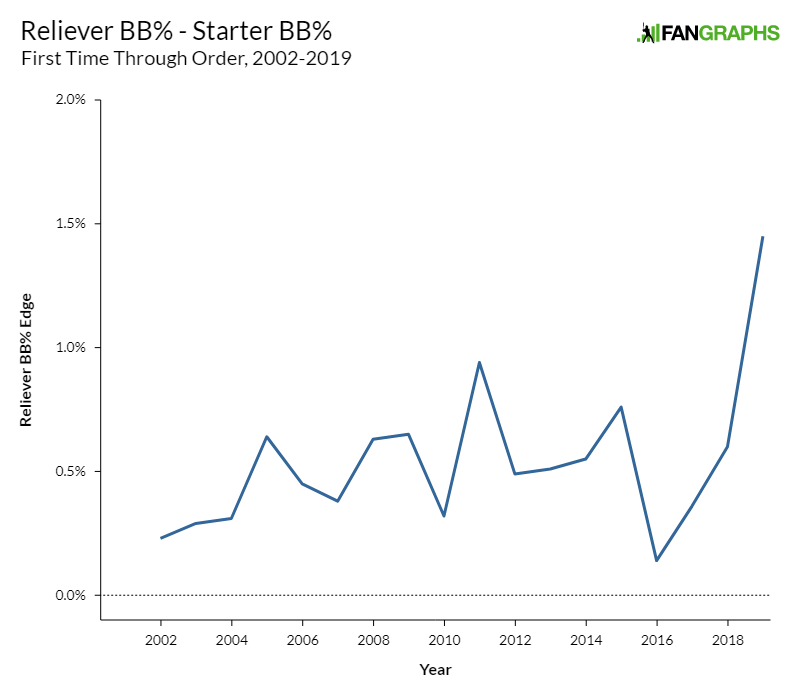
Though it’s not quite as dramatic, the last two years represent the smallest advantage relievers have had over starters in our sample. Walks are a bit noisier, but while relievers have always walked more batters than starters, the gap is at its widest point in our sample in 2019.
So, what does this all mean? Are starters just magically getting better relative to relievers, even after accounting for the conditions they’re pitching under? Well, there are two theories I’d like to explore. First, more and more relievers are getting into games. In 2008, 496 pitchers appeared in relief. Ten years later, in 2018, that number was up to 657. Pitchers who might have been back-end starters or minor league depth are increasingly joining the back end of major league bullpens. What if the declining (or even reversing) reliever edge is just showing the dilution of the reliever ranks?
To handle this criteria, I got creative. I ran first-time-through-the-order numbers for starters and relievers, but this time only for players who met a playing time minimum. I looked at relievers and starters who faced at least 120 batters the first time through the order (40 for 2019), trimming the marginal hangers-on from both lists.
These pitchers, as you might imagine, perform better than the total set of starters and relievers. They’re the pitchers their teams are consciously giving innings to, not Quad-A players filling gaps in the bullpen or rotation. Still, though, the trend of starters performing better relative to relievers remains.
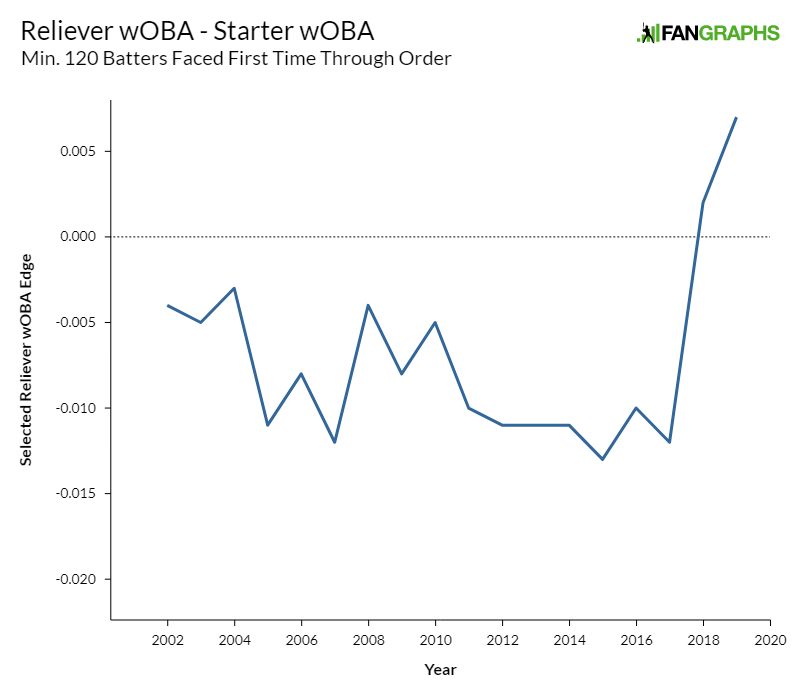
Now, this isn’t a perfect way to control for the talent level of relievers. Still, it makes the talent pools far more uniform, and yet the sudden improvement of starters relative to relievers remains. What else could it be?
There’s another excellent reason the results gap between starters and relievers might be narrowing. Forget the diluted talent pool for relievers; what if starters are approaching their outings differently? For most of baseball history, starters were expected to pace themselves and pitch the majority of each game they appeared in. Recently, though, that model has changed. Many starters now expect to face about 18 batters (two times through the order) and then hit the showers. Maybe they’re just throwing with much more effort to each batter than they used to.
To test for this, I turned to a trusty cohort of pitchers — swingmen who made at least 10 starts and 10 relief appearances in a given year. These are pitchers without a fixed role, bouncing around to whatever spot serves their team best. Maybe they’re banished to the bullpen after a string of bad starts, or promoted to the starting rotation after some effective relief work. Either way, they have enough appearances in each role to understand how to prepare for it. If the way starters approach starting is truly changing, we’d expect swingmen to have smaller splits than they did in the past.
Take a look at the performance gap the first time through the order for swingmen (between starting and relieving). This data goes back only to 2008, the first year I could query on Baseball Savant.
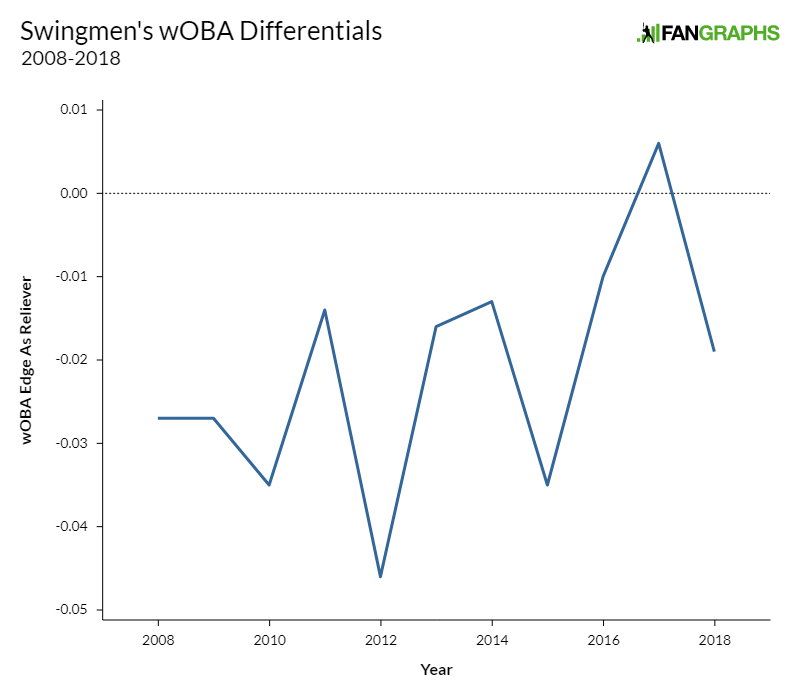
A quick note on the methodology here: in creating this split, I emulated a study in The Book, working out each pitcher’s first-time-through wOBA gap, then taking a weighted average using the smaller of the number of batters faced as a starter or a reliever. I also manually stripped out openers in 2018.
Well, that data is way too noisy. It’s kind of hard to tell anything, as we’ve run into our old nemesis, sample size. There are only 15 or 20 pitchers a year who are true swingmen, which makes it hard to do a year-by-year study. Let’s look at that data again, only with three-year averages.
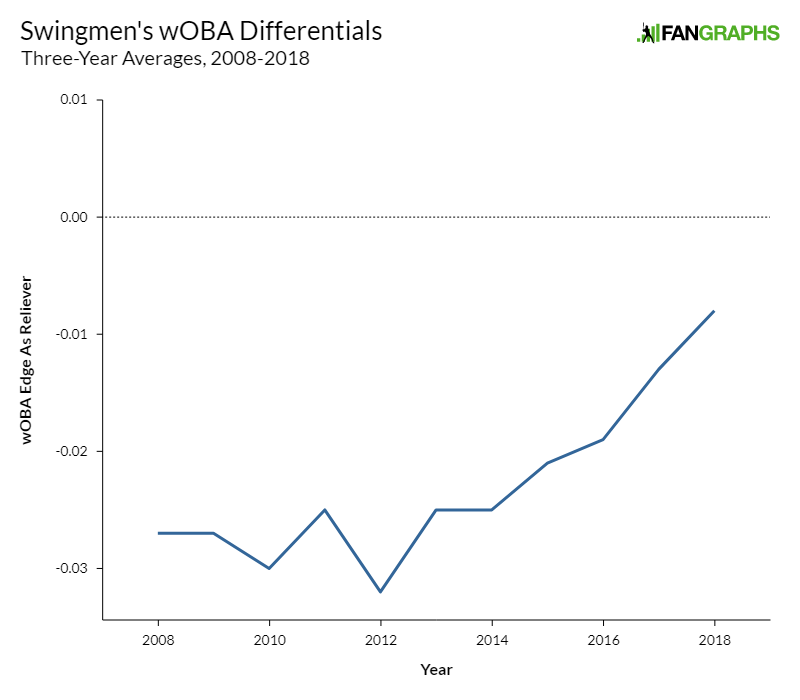
Okay, there’s maybe a trend there if you want to see it. That’s the problem with these sample sizes (1000 to 1200 PA a year): they’re small enough that noise is a major component. While this isn’t real evidence of anything, it’s at least pleasing to see it move in the correct direction.
So, what can we say overall about the seeming improvement of starters relative to relievers in the past handful of years? As far as we can tell, it’s not just an artifact of starters going through the order a third time less often. Even focusing just on pitchers’ first time through the order, the last two years show a marked change in relative skill level.
The change also probably can’t be explained by a dilution of reliever talent — even looking only at high-volume starters and relievers, the talent change over the last two years shows up. This effect merits further study, but it doesn’t seem like an obvious culprit.
The best evidence we have is the diminishing advantage swingmen get when pitching in relief. Maybe, just maybe, starters are improving relative to relievers because they are preparing more like relievers, putting in maximum (or closer to maximum) effort on every pitch. The data isn’t conclusive, but it’s at least suggestive.
No matter how you slice it, starters’ performance is getting better relative to relievers. Whether it’s changing preparation, the changing talent levels of pitchers becoming starters, or something else I didn’t consider, you can’t deny the effect. Whatever the cause, baseball looks different now than it did 10 years ago. I can’t wait to see what the next 10 years bring.
Ben is a writer at FanGraphs. He can be found on Bluesky @benclemens.
Is it maybe because they are pulled before they get nuked? Traditionally the starter goes 6-7 and then you have 2-3 great relievers.
In those last innings the starter does worst and if you pull him earlier you make him better. And more relievers also mean more arms needed but there are only so many good arms. Easy to find 2-3 lights out arms but not so much 7-8 good relievers.
This … this is exactly what is discussed in the article. Did you skip straight to the comments from the headline?
What is wrong with paraphrasing? Its 2019, who reads beyond the title?
Fantastic article! Personally I really appreciate your guys writing when it’s focused on big picture stuff and league wide trends.
This is purely anecdotal, but I feel like the first half of the decade saw a particularly outstanding crop of star relievers emerge (Kimbrel, Chapman, Jansen, Holland, Betances, Melancon, Robertson). Many of them have declined or faded, and no new crop of relief aces have emerged to replace them. And when guys like Kimbrel and Betances haven’t played at all this year, they have a legitimate swing on the average effectiveness of relievers.
So I would suggest that maybe the level of talent in the reliever pool this year has, in fact, decreased.
As to the general idea that maybe there’s some talent change that’s hard to detect, I’m totally with you that trying to find the ‘real’ reason is incredibly difficult. That’s why I tried to be really careful in stating my conclusions- I don’t think the data prove anything at all, and I hope that came across.
As to the second part of your query, about Kimbrel and Betances having a legitimate swing on average reliever performance, I thought I might as well test it. I looked at relievers’ performance the first time through the order from 2010 to 2018, as well as all those relievers EXCEPT Betances and Kimbrel. Removing them wasn’t worth zero, but the biggest effect it had was in 2014 (Betances faced a trillion batters with the best wOBA of his career), when the no-Dellin-and-Craig group was worse by…. just under .001, i.e. less than a point of wOBA.
Obviously, this doesn’t prove anything, but the sample populations are big. Cutting out two relief superstars isn’t enough to move the needle in anything like the magnitude we’ve seen in the last few years.
There are plenty of relief aces that are in this sample of time when starters are closing the gap. Hader. Diaz. Treinen. Vazquez. Doolittle. Even less heralded guys like Kirby Yates, Jose Alvarado and Ryan Pressly have been worth 2.5 to 3 wins over the last year. So even if these guys don’t have the sustained success of those guys, there still should be plenty of high end talent covering this change.
Though it would still be interesting to break things up into different buckets. Like is the gap between starters and guys who pitch primarily in high leverage spots similarly or is it the low leverage relievers that are accounting for this? Are #4-5 starters getting better relative to bullpens or is this change being pushed by the aces?
This article hits my trigger. Let me say first that this is a great piece of analysis delving into almost everything that is in question. I have seen, and written in this blog, that there have been an unusual number of complete bullpen explosions this season and the numbers appear to support that idea. All of this correlates directly with my pet peeve which is the use of starting pitchers in today’s game. There is a robot like, certainly computer driven, tendency for some teams to go into their games with a printout that must be followed regardless of the situation of the game. Pulling the cruising starter, especially one of the top pitchers in a rotation, after allowing less than two runs in 6 innings and 85-95 pitches with a lead of two to five runs seems to have no logical reasoning behind it and now it appears that teams are thrilled to get 4 innings from their fourth and fifth starters. No team has enough decent relievers to do this in three or four consecutive games and the results are what is happening the past couple of seasons. Once a team get past it’s top two set-up men there is not much left and these
Quad-A players are getting whacked around like never before. Durability of the starters has always been one of the arguments for their early removal. This has no basis in fact. There are horses who can throw 120 effective pitches every fifth day and go on forever. History is full of them and who can tell me that Max Scherzer, Jacob de Grom or Noah Syndergaard and many, many more can’t do that today. Syndergaard actually has 3 complete games in his last 14 starts. Hardly Bob Gibson, but maybe the realization some pitchers don’t melt on the mound after 100 pitches. On the other side of the fence there is no evidence that coddling starters keeps them on the mound. There is no way to corroborate this theory but did the collapse of one pitcher, Johan Santana, after he threw his no-hitter, cause all of this fear of injury? Teams are paying more than ever for starters and getting fewer and fewer innings for their dollars. $30 million for 150 innings seems a little steep, but so does $30 million seem a little steep for the 69 innings the Giants have gotten from Mark Melancon the past two seasons. The article attempts to make adjustments for these (deep?) bullpens by only using established and
semi-established relievers but that fails to accurately describe what is actually happening on the mound. The fewer innings the starters go the more the end of the bullpen is being used and I have seen enough of Colten Brewer and Tyler Thornburg. Are the starters making no attempt to conserve energy and try to extend their starts? Ben mentions 18 hitters and if we assume 30% of those men get on base we are talking about 13 outs. That is a ridiculous way to use a starter. This brings up a dilemma that is almost foolish when it is considered. It appears absurd to stick to a formula that removes a starter, especially a top three pitcher after 18 hitters yet that brings up the third time through the order situation. Thanks but no thanks. I will stick to the idea that a pitcher stays in there until he is knocked out and i will even allow for a pitch limit of 120.
I don’t know about 120 pitches every 5th day, but this old horse could throw 50 effective passes every seventh day.
Just neighing.
Really clever data treatment to approach each of these different questions. Fun article.
Have starters also been throwing harder using your PA filters?
This is a great look at the changing effectiveness of starters versus relievers, good work!
Also, I was wondering if you looked into any subanalyses to account for platoon splits. My assumption is that relievers are still more likely to have platoon advantages, espescially with teams shortening their benches to add an extra arm, but that, and their effectiveness with and without the platoon advantage might have changed over time as well.
Kudos for a strong effort to unwind a very tangled question. I’m just not sure we can find a convincing answer.
The biggest knot lies in exactly how the workload has shifted: Not by increasing individual RP workloads, but by rostering additional relievers. That makes the issue of whom, exactly, you’re comparing both crucial and somewhat arbitrary.
The BIG question is whether the overall workload shift is paying dividends. But that’s incredibly complex.
For one thing, scoring is up significantly in the same period as the steepest workload shift — and scoring changes ALWAYS impact workload, no matter what else may be happening.
Any year with a sharp rise in scoring has a notable drop in SP share of innings. In both 1920 and ‘30, SP share dropped 1.3 points; in 1953, -2.5 points; in 1969, -2.1; in 1977, -2.4.
And of course it works the other way, too. So, as scoring fell from 2009 to 2014, SP workload rose 1.4 points, despite the long-term inexorable downward trend. You just can’t fully separate workload from scoring context.
What we’ve seen since 2014 is both a “necessary” and a “voluntary” drop in SP workload. From 2014 to 2017, scoring rose almost as much as the radical rise from 1968-69, while SP workload dropped twice as much.
Scoring since 2017 has stabilized, while SP share continued down. But that makes it very hard to analyze 2018-19 against anything beyond 2017 — which leaves us with unfortunately small samples.
Terrific comments as you get to the point of the issue. Is the shift in the workload paying dividends?! I cannot help but think that increased use of inferior pitchers, basically anyone who isn’t the closer or the best two set-up men on a staff, is intrinsically the wrong approach, but you are spot on when you say this entire situation is incredibly complex. Since these good relievers cannot pitch 100 games a year there is more and more usage of the Quad-A guys who were in Pawtucket yesterday. I accept removing a top of the rotation starter, assuming he is cruising and his pitch count is averaging 13-14 pitches per inning, in a blowout but not before the 8th in a close game. I appear to be in the minority here when I defend a more aggressive use of the top of the rotation starters but there is a reason these top of the rotation guys are just that. They have a knack for getting hitters out. Your stats on the time through the order penalty is thought provoking. Are you clumping Jacob deGrom together with Jason Vargas as equals? Next is who is coming in. Is it Tyler Bashlor or Edwin Diaz but, as you say, the question is complex. Having watched the game evolve for at least 70 of my 77 years a question I continue to ponder is how did all those great pitchers from the past ever throw a shutout, or even a complete game, if they were getting crushed by the third time or, much more likely, the fourth time through the order penalty. They simply were not. I would like to see if today’s aces are as good.
Thank you, bosox. There is some evidence that the workload shift hit a tipping point last year — i.e., that the pace of increased RP usage outran the supply of deserving RPs.
I compared 2018 with 2010, the most recent year with very similar scoring context. (Overall OPS was .728 both years.)
Last year had 17% more relief outings and 22% more relief innings. In that context, I compared individual usage and performance thresholds.
For any usage threshold (# of relief outings), 2018 had a much greater rise in low-performers (by bWAR) than in raw count or in high-performers. Two examples, expressed as the 2018 rise over 2010:
20+ relief games:
— Raw count, +21%
— 0 bWAR or less, +55%
— 0.5 bWAR or more, +8%
40+ relief games:
— Raw count, +8%
— 0 bWAR or less, +41%
— 0.5 bWAR or more, +3%
Essentially, we saw a lot more RPs getting a substantial trial in 2018, but a much smaller increase in those proving worthy of more work, and a much larger increase in those proving UNworthy.
Which more or less fits our anecdotal observation: Demand for good RPs has run far ahead of the supply. And with this year on pace for more record high usage and degraded performance, it remains to be seen when or if development will catch up.
On a tangent … Why do we only note the “3rd-time-thru” penalty, when the “2nd-time-thru” penalty is also significant and consistent?
I didn’t even realize this until doing some research in response to this post, and it surprised me.
OPS for starters in the 1st, 2nd and 3rd time through the order:
2018-19 — 698, 739, 783
2016-17 — 728, 766, 797
2014-15 — 695, 718, 758
2012-13 — 708, 735, 763
2000-11 — 734, 764, 797
The 2nd-time penalty size relative to 3rd gets bigger the further back you go. In 20-year chunks before this century, the 2nd-time penalty was consistently bigger:
1980-99 — 707, 734, 758
1960-79 — 669, 694, 714
1940-59 — 683, 705, 719
1920-39 — 709, 729, 740
Maybe it’s not discussed because no one thought anything could be done about it, until the opener was invented. Or maybe I just missed the discussion. But it’s very interesting.
One thing it touches on is the idea that starters of past generations were more inclined to pace themselves, saving energy early in the game so as to have enough to finish. These data don’t support that theory. Starters throughout history have lost significant effectiveness the 2nd time through the order.
Didn’t those starters in the past still successfully get hitters out in the early innings while they were pacing themselves? Of course they did. There is no answer. If there was we would know the outcome and not bother to watch. Just today, Rick Porcello was flattened in the first time through the order to the tune of 4 runs and 5 hits, then did not give up another hit in the next 5 2/3 innings and 19 batters. “Remember Suzyn, you can’t predict baseball.” as John Sterling says so often.
The issue with those OPS-by-PA trends is that there’s tremendous survival bias in there. The true gap between 2TTO and 3TTO is much wider especially in the current environment because the hook is faster. There are many fewer failed 3TTO PA’s in the recent data set so the 44-point gap in 2018-2019 is telling you that even for the truncated period when the starter was worth keeping in, he was still 44 points worse than the 2TTO version of himself.
Craig recently wrote that hitters are chasing less breaking pitches out of the zone and crushing fastballs in the zone this year.
Maybe this strategy works better against relievers, who are more likely to be two pitch pitchers, throw more fastballs, and less strikes?
I can’t do a quick research on pitch usage distribution but can see the difference in fastball rate (40.8%/37.3%) and zone rate (48.1%/46.8%, the biggest gap since 2007).
And also, velocity gap between starters and relievers this year is smaller than ever.
If you are a reliever with lesser command and no decent third pitch, and can’t induce wiffs with your primary breaker out of the zone, then you’ll be in trouble.
Starters got better by pitch like relievers, not pacing themselves. And facing more relievers and starters who pitch like relievers, hitters might have made adjustments against reliever’s pitching style.
So I imagine relievers could be getting better by pitch like starters, mixing pitches. (with three batter minimum rule coming, third pitch would become important for relievers anyway.)
Interesting idea. But one reason that guys BECOME relievers is the lack of a good third pitch. So that’s another development question.
A reason the velocity gap is dropping could be because the teams are going deeper and deeper into their euphemistic called organizational depth, the bottom of the barrel so to speak, to find more and more relievers and, down there, there aren’t many guys throwing 95 and the few that do haven’t a clue where it is going.
The third trip through the order fallacy isn’t nearly as sound as people like to talk it up to be. There are a lot of reasons that the data looks the way it does, like getting pulled right after something bad happens or not getting to face the weak back of the order. It is certainly debatable. You can’t just pull stats and take it as a fact – well, you can and people do but if it is worth something then it needs a lot of scrutiny. There is nothing magic about the third time through the order. If a SP was going well, then I am sure he would go well the third time too. If a guy is on fumes, then yes, his day is probably just about done and that just happens to coincide with the third trip through the order. SP get pulled more often than they should on the third trip through and that is just bad decision making.
Its all very simple – RP are getting exposed. It is easy to hide the weakness of a pitcher in the bullpen, but when you use them enough they are are going to demonstrate why they couldn’t hack it in the rotation. Starters are not improving, you are just seeing what it looks like when you ask too much of the back end of the staff.
SP are certainly not improving and I think you could argue that they are having a bad year. Lots of TOR are getting crushed early. Imagine how wide the production gap would be if the top end of SP were doing their jobs! In addition, there are several teams that are making no effort to develop SP – the pool is shrinking. I think what you are actually observing is the degradation of pitching throughout. Want to know why people thought overuse of bullpens seemed like a bad idea in the long-run?