Author Archive

The Superlative Kyle Hendricks

You know it’s almost time for baseball season when all of the major projection systems forecast Kyle Hendricks‘ ERA one run per nine innings too high.

As much as this sounds like a knock on those who develop projections, it’s not. What Jared Cross (Steamer), Dan Szymborski (ZiPS), Derek Carty (THE BAT), and the folks at Baseball Prospectus (PECOTA) do is no small feat. If I weren’t too cowardly to even try to create my own projection system, I would be too stupid to design one that is half as effective as theirs. Glass houses and all that.

That said, I am just smart enough to know that projected ERAs ranging from 3.84 to 4.42 for Hendricks, who boasts a career ERA of 3.12 and has never finished a season with an ERA above 3.46 (except that dastardly 3.95 ERA in 2015), are too high. It’s easy to poke holes in the obvious outliers, but projections succeed by describing and then predicting the talents of most pitchers, not the ones whose talents deviate dramatically from expectation. Hendricks is every projection system’s known blind spot.

It’s not just projections that struggle with Hendricks, either. We, the sabermetric community, frequently use ERA estimators as shorthand to characterize a pitcher’s talent level. If you frequent FanGraphs, you’re familiar with Fielding Independent Pitching (FIP), expected FIP (xFIP), and Skill-Interactive ERA (SIERA). By virtue of how they’re constructed, each metric makes assumptions about the skills a pitcher theoretically “owns”:

  • FIP: strikeouts, walks, and home runs allowed
  • xFIP: strikeouts, walks, and fly balls induced
  • SIERA: a complicated combination of strikeouts, walks, net groundballs (groundballs minus fly balls), and their squared terms and interactions with one another

While each estimator features a batted ball component, they focus on trajectory (launch angle), not on authority (exit velocity). This is a fair assumption, frankly. I have illustrated how a pitcher can influence hitter launch angle, operating under the assumption they bear little to no influence over hitter exit velocity. It’s not quite that bleak; certified baseball genius Rob Arthur found that the average pitcher’s effect on a baseball’s exit velocity: roughly five parts hitter, one part pitcher. Read the rest of this entry »

Where Vertical Approach Angle Seems to Matter Most

A couple of weeks ago, I was chatting with PitcherList’s Alex Fast about four-seam fastballs swinging strike rates (SwStr%) and their relationship to pitch height — or, perhaps more specifically, their lack of relationship. At the pitcher-season level (e.g., “2020 Clayton Kershaw“), the correlation between SwStr% and pitch height appeared weak at best. When you consider that no fastball is created equal and then introduce small-sample variance to the equation, the relationship could, understandably, become blurred at the pitcher level.

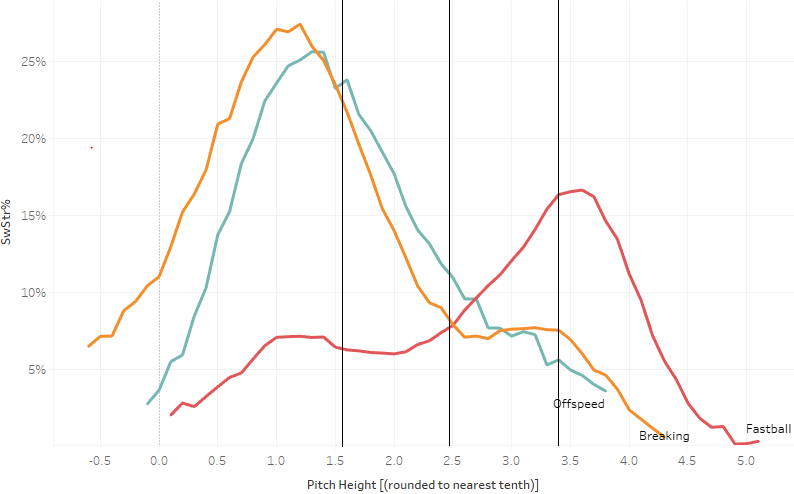
As a retort, I sent him the following graph, which shows SwStr% by pitch height for the three broad pitch classes as defined by Statcast, the source of the data. For reference, I’ve added black lines to indicate the average bottom, heart, and top of the strike zone:

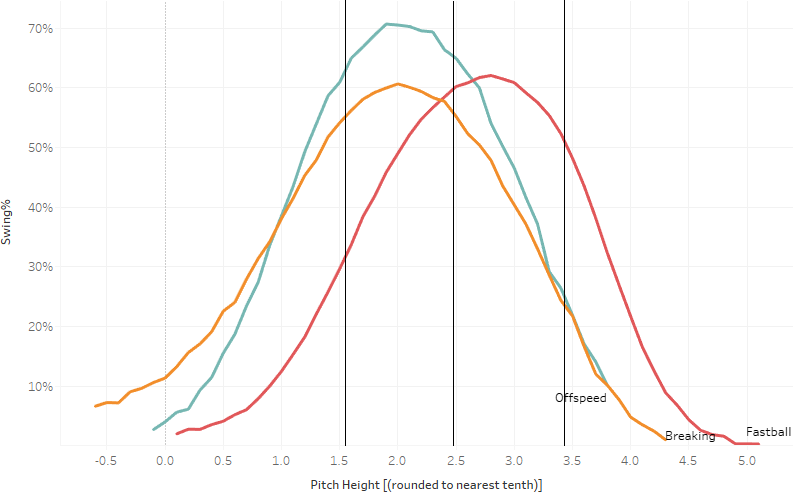
If we zoom out and consider the question at the macro level, independent of context (what’s the average swinging strike rate for all fastballs by pitch height?), we can see that fastballs generate more swinging strikes up in the zone, a phenomenon our own Jeff Zimmerman touched upon here. This finding is mildly interesting in and of itself. But as I considered the matter further, the importance of swing frequency (Swing%) to SwStr% became clear (both use all pitches as a denominator). Regardless of efficacy, more swings will afford more chances for swinging strikes. As such, I anticipated that fastballs probably induce more swinging strikes up high than down low simply because hitters swing more frequently at high fastballs. Similarly (but inversely), non-fastballs would generate more swinging strikes down low instead of up high. The next graph all but affirmed my intuition:

Although the peaks of the bell curves cluster near the heart of the zone, we can see distinct differences in swing rate by pitch class at the thresholds of the strike zone. At its bottom edge, hitters are half as likely to swing at fastballs as they are at non-fastballs; at its top edge, twice as likely. Read the rest of this entry »


Modeling Salary Arbitration: Introduction

This post is part of an ongoing arbitration research project and is coauthored by Alex Chamberlain and Sean Dolinar.

Feb. 25: 2015 MLB Arbitration Visualized

* * *

Sean and I share a mutual passion for knowledge and understanding how things work. Said mutual passion is magnified when regarding baseball-related matters. With that said, the mysterious arbitration process intrigues us. We joined forces to try to crack the code, so to speak, and we would like to share the fruits of our labor with you.

Players with anywhere from three to six years of service time are eligible for salary increases based on performance. Teams and players typically reach settlements outside of arbitration, but if they can’t agree on a salary figure, both sides enter the formal arbitration process, as described here by FOX Sports.

Therein resides the questions intrinsic to the process: How do teams and players decide what is an appropriate dollar-value raise in salary? How does an arbitration panel decide in favor of one side or the other?

Read the rest of this entry »