Stock Rising: Four Players I’m Higher on After a Month of Play

Roughly a month’s worth of the 2024 season is now in the books. The American League East looks great. The Brewers and Guardians are standing up for the Central divisions. The White Sox can only beat the Rays, and the Astros somehow can’t beat anyone. Enough time has passed that I feel confident saying all of those things. On the other hand, it still feels too early to be certain about which players are over- or under-performing. But that doesn’t mean our opinions can’t change a bit. There’s enough data to make some educated guesses, so let’s put on our speculation caps. Here are four players — two hitters and two pitchers — who have risen in my estimation over the last few weeks. Tomorrow, I’ll follow up with four players who have gone the other way.
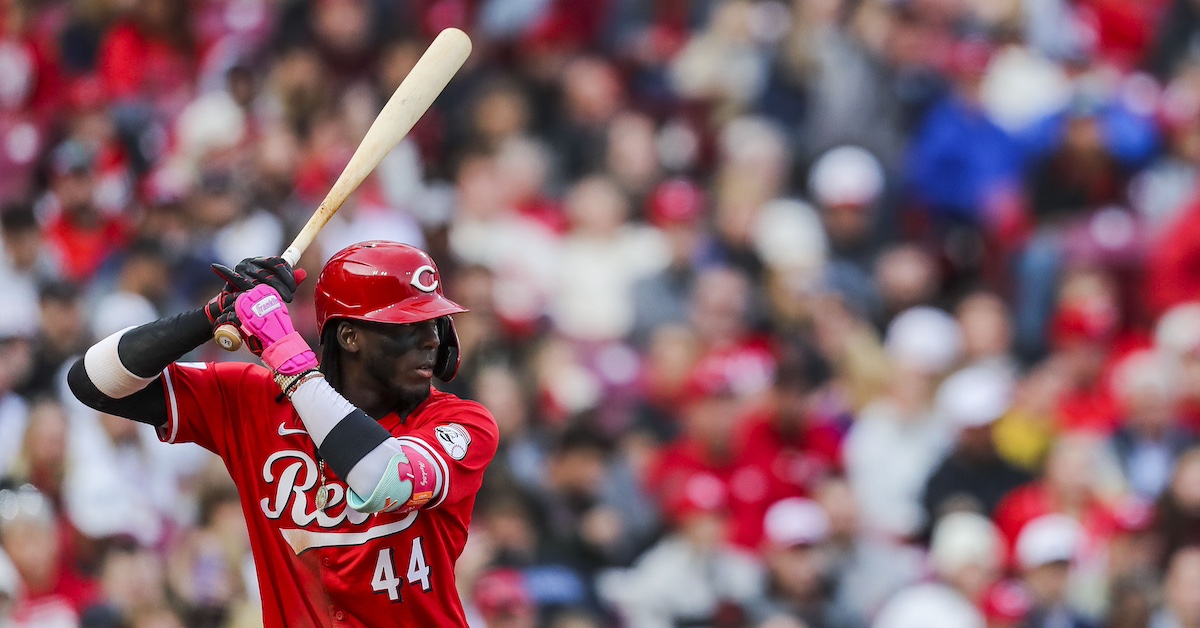
Elly De La Cruz, SS, Cincinnati Reds
I already thought De La Cruz had the potential to be one of the best players in baseball before the season started. Quite reasonably, though, I was worried about the downsides. A guy who struck out 33.7% of the time last year is always risky, and that’s particularly true given how he did it. He swung more often than league average at balls and less often than average at strikes; he also made less contact than average. You can have one of those three things be true, or maybe even two of three if you make up for it elsewhere, but three of three? Yikes. Read the rest of this entry »