Orioles Add Taylor Ward, Send Grayson Rodriguez West

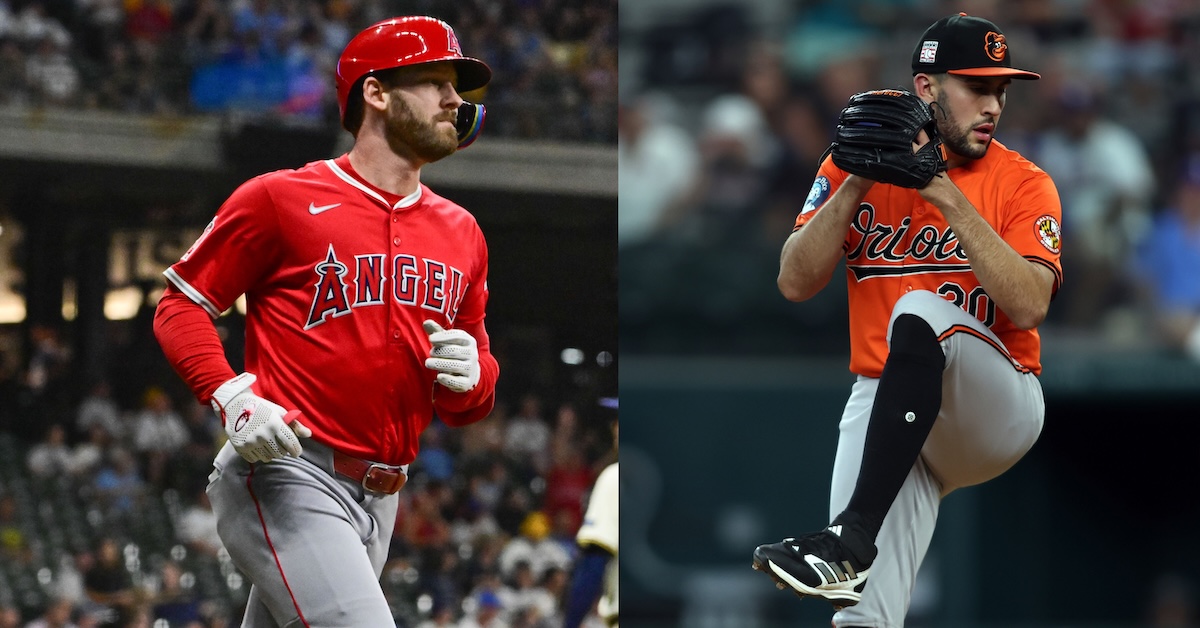
November is supposed to be a sleepy time of the offseason, with qualifying offers and 40-man roster shenanigans the main points of interest. This year has had a few fun surprises, though. First, Josh Naylor returned to the Mariners on a five-year deal, a surprise less in terms of destination than timing – these sorts of contracts normally wait until December. Now, we have a bona fide challenge trade: The Orioles are sending Grayson Rodriguez to the Angels in exchange for Taylor Ward.
Rodriguez, one of the top pitching prospects in baseball a few years ago, is also one of the toughest players in the majors to evaluate. The potential is there. He has multiple putaway secondaries, a lively fastball he can command to multiple parts of the zone, and he’s athletic enough that his command has trended upwards from fringe to average, with the kind of trajectory that makes you expect more to come. If you’re looking for an ace, you’re probably looking for someone whose skills roughly look like this.
On the other hand, unavailability is the worst ability, to twist the tired old saying ever so slightly. Rodriguez has struggled to stay on the field in his time in the majors, and that’s putting it lightly. He missed a good chunk of 2022, his last minor league season, with a lat strain. He then missed half of 2024 with two different shoulder injuries, while another lat strain and bone spurs in his elbow cost him the entirety of the 2025 season. At this point, three of his last four seasons have been severely curtailed by major injuries, including recurring shoulder problems. Read the rest of this entry »