Ben Clemens FanGraphs Chat – 11/7/22
by Ben Clemens


November 7, 2022

Welcome to the offseason. As is customary, the end of the playoffs means the release of FanGraphs’ annual top 50 free agent rankings. In recent years, we’ve rotated through the writers principally responsible for the list – first Dave Cameron, then Kiley McDaniel, Craig Edwards, and, more recently, me. I’m back this year and I’ve brought help: the FanGraphs staff contributed mightily to this piece.
Below, I’ve provided contract estimates and rankings of the winter’s top free agents, along with market-focused breakdowns for the top 25 players. That could be a quick discussion of where a player might sign, what a team might look for, or even just statistical analysis masquerading as market analysis – I’m an analyst at heart and never stray far from my roots. Meanwhile, a combination of Michael Baumann, Justin Choi, Jay Jaffe, David Laurila, Eric Longenhagen, Dan Szymborski, and Jon Tayler supplied player-focused breakdowns, which are designed to provide some context for each player at this moment in his career. Special thanks to David Appelman, Sean Dolinar, Jason Martinez, and Meg Rowley for their help behind the scenes.
The players are ranked in the order in which I prefer them. That’s often the same as ranking them in contract order, but not always. In some cases, I prefer a player I expect will get less money over one who stands to make more. I’ll generally make note of that in the accompanying comment, but just to reiterate, this list isn’t exclusively sorted by descending average annual value or anything like that. All of the dollar amounts are estimated guarantees. Plenty of contracts will include team options or player incentives, but those aren’t included in these estimates. Player opt outs are similarly not included. All of the projections are Steamer 2023 projections, but use our Depth Chart playing time allocations. The lone exception is Kodai Senga, whose projection comes courtesy of ZiPS. The listed ages indicate the age-season the player is about to play. Read the rest of this entry »
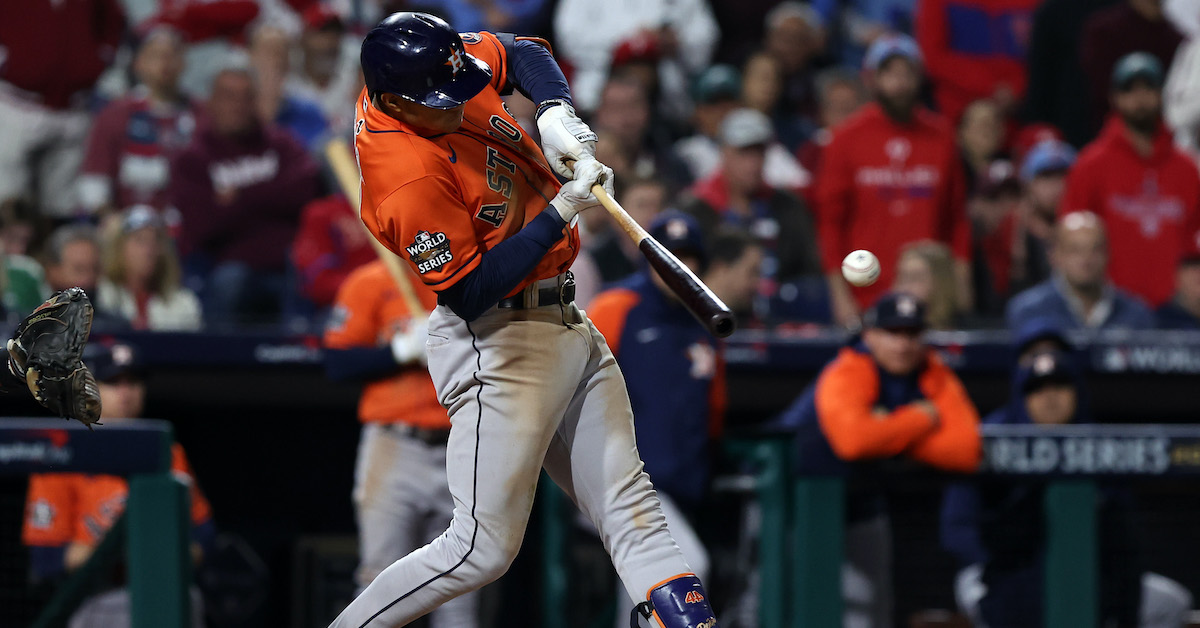
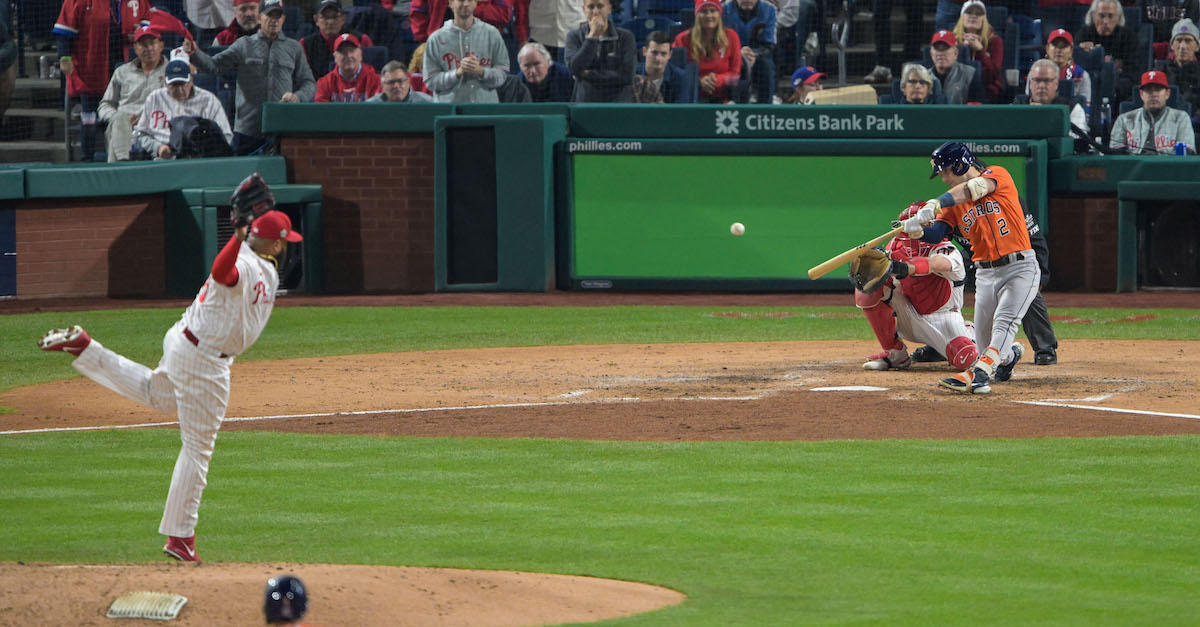
Aaron Nola had a rotten first start of the World Series. He gave up five runs before he finished three innings, and while the Phillies bailed him out en route to a 6–5 win, that game surely left him with a bad taste in his mouth. When he took the ball again for Game 4, he was likely hoping to change the story once and for all.
He had a plan, too. In Game 1, Nola had gotten beaten in a silly way. He came out pumping fastballs, and the Astros were only too happy to feast. They collected six hits; five, including a three-run home run by Kyle Tucker, came on fastballs. Time after time, he threw a perfectly serviceable fastball up there, and the Astros pounced on it. Some were blooped. Some were smashed. Nearly none were missed; the Astros swung at 16 fastballs and came up empty exactly once.
That’s hardly surprising. The Astros were one of the best teams at hitting fastballs this year. They were the best, period, on fastballs below 95 mph. Even with playoff adrenaline, that’s where Nola lives. It’s a bad recipe against such a fearsome offensive team; if you can’t make the Astros swing and miss, you’re going to have a long night — or a short night, measured in innings.
In Game 4, Houston came out swinging yet again. Nola threw nine fastballs in the first inning, and the Astros swung at six. They missed exactly one: the first pitch of the game to Jose Altuve. Nola started Tucker with two straight fastballs in the second inning, and he was on them both times. Something had to change. Read the rest of this entry »
Blame Mike Petriello. I don’t think that anyone is actually wondering whether you should, as a fan of the batting team, root for a double play. You shouldn’t! Don’t do it. Don’t even think about doing it. But after it came up on last night’s Game 4 broadcast, I thought I’d at least quickly go over why this is a bad idea that you shouldn’t consider.
Let’s set the stage. In the top of the fifth inning, Alex Bregman stood at the plate with the bases loaded and nobody out. The Astros already led 1-0 and were looking for more. Bregman was in an 0-2 hole against José Alvarado. Naturally (well, maybe), it’s time to talk about whether you should be rooting for a double play if you’re pulling for the Astros.
Q: Should you prefer a double play here if you’re Houston?
No.
Q: Are you sure? It would put the Astros up 2-0, which is a lot of runs.
Yes, I’m sure.
Q: How likely are the Astros to win if Bregman strikes out?
I used our WPA Inquirer to look up an estimated winning percentage for the Astros with the bases juiced, a one run lead, and one out in the top of the fifth. They stood to win 73.9% of the time.
Q: How about if he hits into a double play?
If it’s a 6-4-3 double play that scores a run and leaves a runner on third, they’re 74.7% likely to win. If the double play erases the runner on third instead, it’s 74.3%. Given where the infield was playing, I don’t think a home-to-first double play was very likely. In fact, I think the 6-4-3 type was the only real consideration.
Q: Hey! They’re gaining win probability by hitting into a double play, aren’t they?
That wasn’t really a question. In any case, sure, if Bregman had only two options – double play or strikeout – he’d prefer to hit into a double play. Baseball has all kinds of outcomes, though! Some of them even let you reach base. Those are a lot better than hitting into a double play.
In his career, Bregman hits .215/.268/.375 after 0-2 counts. He strikes out 32.5% of the time, which is notably not 100%. He’s also a fly ball hitter after 0-2, because he’s a fly ball hitter all the dang time. He has a 34.7% groundball rate when he puts the ball into play after 0-2 counts, right in line with his overall mark.
Alvarado is quite good when he gets ahead 0-2, which does matter. Let’s give him a ton of the benefit of the doubt and say that Bregman will strike out 50% of the time, while only reaching base 10% of the time. That’s a goofy assumption, to be clear – that’s a lower OBP than Alvarado has allowed on 0-2 in his career and far lower than the major league average. Bregman is an elite contact hitter, and he had the platoon advantage. The real number is probably at least double that, but I’m trying to be charitable here.
Let’s break it down like this: 50% strikeouts, 10% one-base singles, 15% groundouts, and 25% outs in the air. With Jose Altuve on third base, let’s say 60% of those fly balls score runs. We’ll even make all the groundouts double plays.
Using those same WPA Inquirer numbers, the Astros were 87.1% likely to win if Bregman reached safely while scoring only one runner, whether by walk, hit by pitch, or single. They were 78.3% likely to win if he hit a sacrifice fly without advancing the runner on second. Sum it all up, and account for the fact that a fly ball that doesn’t score anyone is the same as a strikeout, and that gets Houston’s win percentage to 76%. That’s meaningfully better than the chances of winning after they hit into a double play.
If we make some more reasonable assumptions, this falls apart even further. Let’s say Bregman reaches base 15% of the time, still far lower than a reasonable estimate but at least less punitive towards him. Let’s also say that he hits a double or two-base single once in a while, and that only 85% of his groundouts are double plays instead of 100%. That’s another goofy assumption – when Bregman has grounded out in a double play situation (runner on first, less than two outs), the defense has turned a double play 40.2% of the time in his career.
With these still-goofy numbers, we’re up to 76.9%. That’s a lot better than hitting into a double play. If I used my actual baseline assumptions instead of stacking the deck in favor of the strange assertion that Houston fans should be rooting for a double play, I get a 78% chance of Houston winning with Bregman down in the count 0-2.
Q: That’s a lot of numbers. Give it to me in one word. Should Houston fans have been rooting for a run-scoring double play?
No.
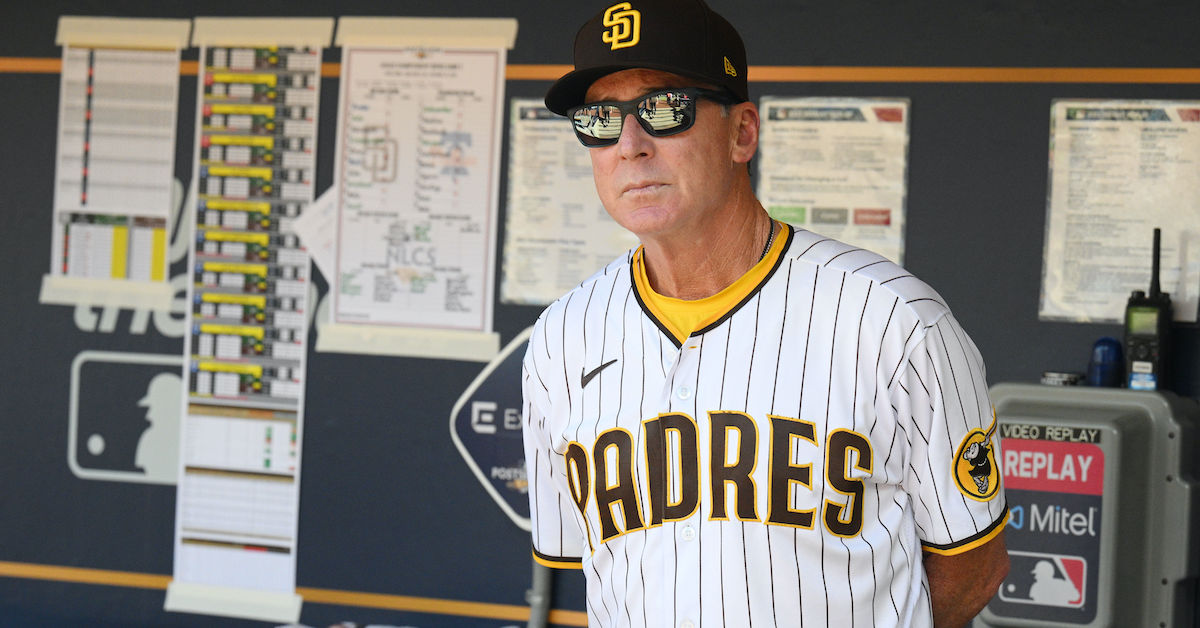
Before we begin, a quick apology from me: I haven’t gotten to these managerial report cards as quickly as I’d like. They take a lot of work, believe it or not. I comb through every game log multiple times to capture the particulars of each situation, keeping an eye on pitcher and batter availability while doing so. I like to watch key moments, too, just in case something pops up that way. I still miss things — it’s hard to get every last detail right, though I try to be thorough — but without poring over the details to get everything straight, I couldn’t write these.
Between the general rigors of writing and compiling the annual top-50 free agent list, I just haven’t had time to get these done. That’s not a great excuse, and I’m sure these are less interesting to read than they would have been if they had come out directly after the relevant eliminations. But hey, they’re here now! Well, this one is. More will follow in the coming week.
Batting/Lineups: B-
Melvin faced one central decision throughout the playoffs: who to play at first base. The lineup didn’t offer much in the way of flexibility anywhere else; every slot had a clear starter. That left Josh Bell, Wil Myers, and Brandon Drury to share DH and first base between the two of them. Drury theoretically has positional versatility, but there was nowhere else to put him. Melvin used two general rules: play Bell against righties and sit Bell against lefties. Read the rest of this entry »

If you’re a fan of balls in play and general athleticism, I’ve got bad news for you: the 2022 playoffs have featured the highest strikeout rate in playoff history, a whopping 26.6% excluding intentional walks heading into last night’s game. More than a quarter of plate appearances have ended without the fielders moving, the runners tearing around the bases, or indeed anyone having reached at all. For what it’s worth, the unintentional walk rate is only 7%; the strikeouts are what’s out of hand, not the non-contact plays.
Why is this the case? I can think of many reasons. Maybe the teams that made the playoffs are jam-packed with the best strikeout pitchers they can find. Perhaps the parade of relievers Jay Jaffe noted last week are just too effective. Maybe that extra velocity from starters is to blame. Hitters shouldn’t escape scrutiny, either; maybe they’re swinging for the fences more with the bright lights of October on them and accepting more strikeouts as a result. It could be matchup-based, or pitchers could be using their best pitches more often. It could be better scouting of hitters’ weaknesses, or just an accident of a few pitchers getting hot, or any number of things. Read the rest of this entry »
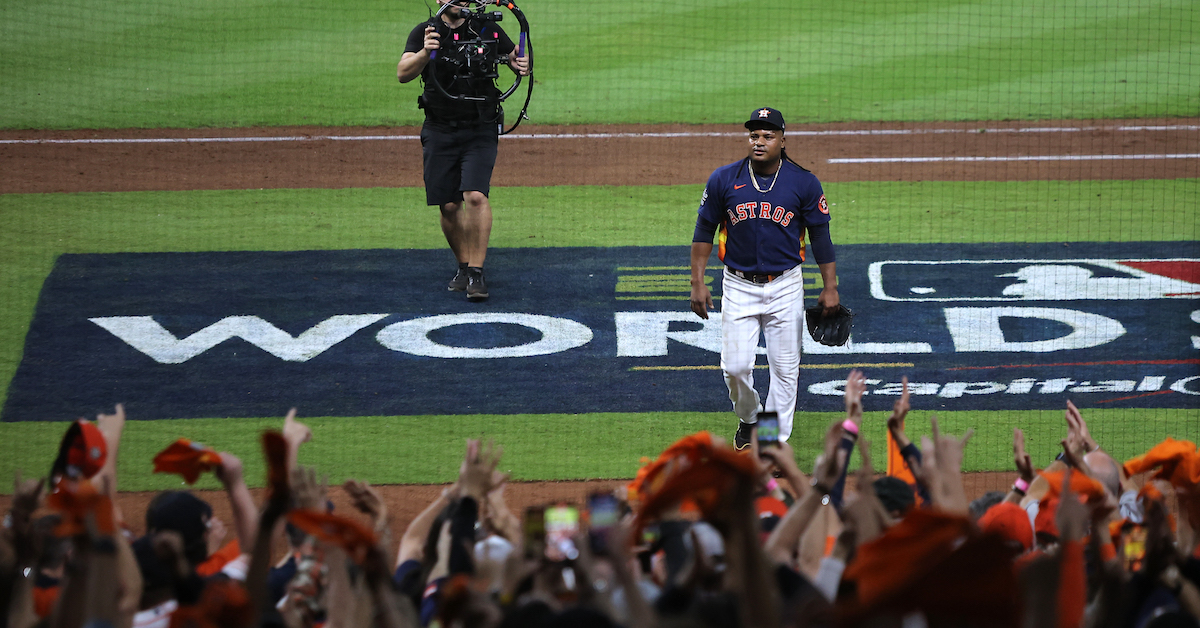
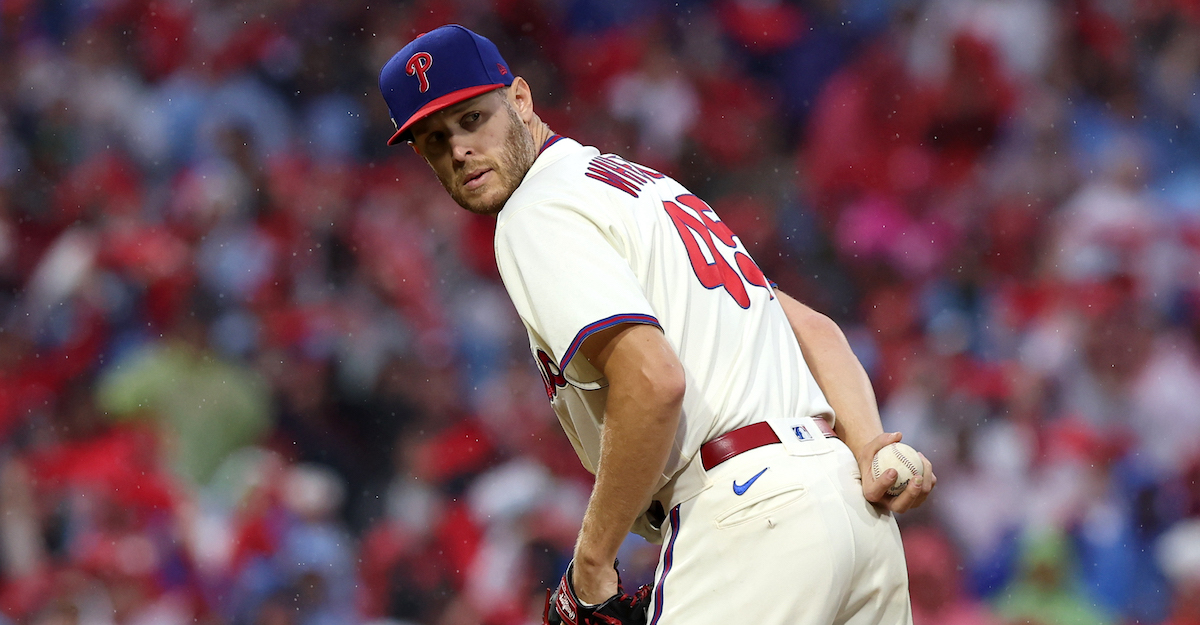
Framber Valdez isn’t the marquee pitcher in this World Series. He’s a solid fourth by reputation, with the top trio some of the brightest pitching lights of the last five years: Justin Verlander, Aaron Nola, and Zack Wheeler. Two games into the series, that top trio have been uniformly bad. Each has given up five runs, hardly the dominant performances they’re known for. Valdez? He stands untouched and mostly unchallenged, allowing a solitary run over 6 1/3 innings to pace the Astros to a 5-2 victory in Game 2.
When Valdez is on his game – and he’s always on his game, setting the major league record for most consecutive quality starts this year – he mixes a snapdragon curveball with a sinker that warps gravity, drawing the ball inexorably downward. He was in fine form Saturday night against a tough Philadelphia lineup. He got awkward swings seemingly at will, weak grounders whenever he needed them, and had a beautiful curveball in his back pocket whenever the opportunity for a strikeout presented itself.
The Phillies have been swinging early and often this postseason. That’s a horrid plan against Valdez; his biggest weakness is an occasional lapse in command. Even tonight, in one of the best performances of his career, he walked three Phillies. If you can lay off his curveball – easier said than done – he’ll sometimes spray a few sinkers and put you on base. Read the rest of this entry »
Every October, I eagerly await the latest installment of Jay Jaffe’s series about the state of starting pitching in the playoffs (his look at relievers is also a highlight). Last year, that waiting was almost rubbernecking; I wanted to see how absurdly short the postseason starts had gotten, and I wasn’t disappointed – thanks, opener Corey Knebel. This year, I was excited to see a rebound because I’m a sucker for playoff pitching duels. Again, I wasn’t disappointed; as Jay noted, start length has exploded this year, to the highest mark since 2019 and second-highest since ’16.
That tracks perfectly with my experience of this year’s slate of games. Sure, there were some games like the deciding Padres/Phillies clash where neither starter escaped the first inning, but for the first time in ages, aces pitching into the seventh has felt more like the rule than the exception this year. Yu Darvish totaled 25 innings across four starts. Zack Wheeler has amassed 25.1 innings in four starts, and he’s coming back for more. Framber Valdez and Joe Musgrove have each averaged more than six innings per start. Six is the new seven; in modern baseball, these qualify as workhorse performances.
You should read Jay’s article if you haven’t already. It’s one of my favorite recurring features — it’s that and my postseason managerial report cards, except with Jay’s series, I get the great pleasure of reading instead of having to pore over every game log countless times myself. When you’re done reading Jay, though, I have a treat: I got my hands on a database of postseason game logs, which means I can do some fun permutations and take a closer look at this season’s postseason starters. Read the rest of this entry »

You can almost hear the hum emanating from the Astros’ player acquisition and development machine. It’s proven and precise, a system honed over 10 years that finds talent all over the place and then helps those players succeed while signing them to win-win extensions. It’s hard to say who the Astros’ core players are because they have too many, and from too many generations. They might be the best team in baseball when it comes to working with pitchers; they also have Yordan Alvarez, Kyle Tucker, and Jeremy Peña bolstering old hands like Alex Bregman and Jose Altuve.
The Phillies, meanwhile, should come with a sign for opposing GMs looking to emulate them: “Don’t try this at home.” The team is a high-wire act. After the previous regime mostly whiffed on developing an Astros-style new core, Dave Dombrowski arrived and worked out which pieces to keep, which to discard, and where to augment. He’s been wildly effective at it, but his options were limited by timeline. Need a new outfielder? Well, there are none in the system, so you’ll need to sign free agents and make trades. Bullpen? Hah! Better start working the phones.
The bones of a nice house were there all along – Bryce Harper, J.T. Realmuto, Rhys Hoskins, Zack Wheeler, and Aaron Nola make for a heck of a foundation – but Dombrowski found the rug that really pulls the living room together. You’d never try to build your team this way, but if you absolutely have to, Dombrowski is the man for the job. Read the rest of this entry »

Sorry for the Shakespearean title; the playoffs make me feel overly dramatic every year. This time, I was inspired by the markedly different approaches of the San Diego Padres and Philadelphia Phillies, who traded blows for five exciting games. The Padres (avatar: Juan Soto) work the count and take walks. The Phillies (avatars: Nick Castellanos and Bryce Harper) sit dead red and swing from the heels. Styles make fights, to borrow a saying from a dying sport, and this one was dramatic.
It got me to wondering: how different were these two approaches, really? It certainly felt like the Padres were watching plenty of hittable first pitches fly by while the Phillies swung at breaking balls in the dirt, but that’s based on my sentiment while watching the game, sentiment that was surely informed by both my pre-existing biases and the broadcasters repeatedly mentioning the disparity throughout the series. Read the rest of this entry »