Ben Clemens FanGraphs Chat – 9/12/22
by Ben Clemens


September 12, 2022

Friday night, umpire Ted Barrett got up close and personal with James Karinchak:
No, Barrett wasn’t looking for hair care tips, or acting out an Herbal Essences commercial. He was checking for foreign substances at the behest of Twins manager Rocco Baldelli. Though he ruffled around to the best of his ability, Barrett didn’t find anything definitive. Karinchak made it back to the dugout with a narrow lead and his pitching eligibility intact, though his dignity may have been affected.
Baldelli’s accusation wasn’t some off-the-cuff act of pettiness. Karinchak has been at the sticky center of controversy ever since the league cracked down on pine tar, Spider Tack, sunscreen/rosin blends, and whatever other tacky options players were using to increase spin. Stricter enforcement of existing rules started at the beginning of June last year; take a look at Karinchak’s spin-velocity ratio and raw fastball spin rate and you can clearly see when things changed:
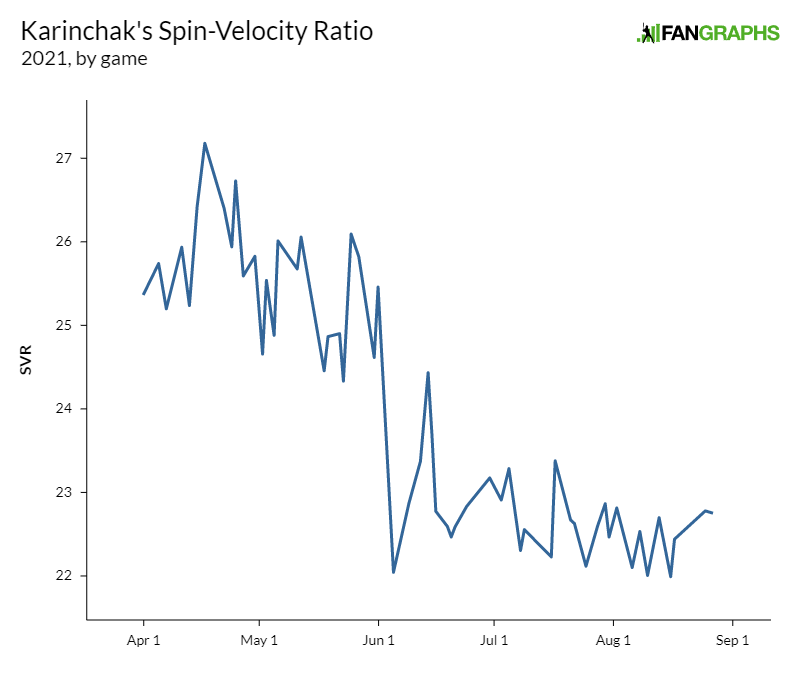
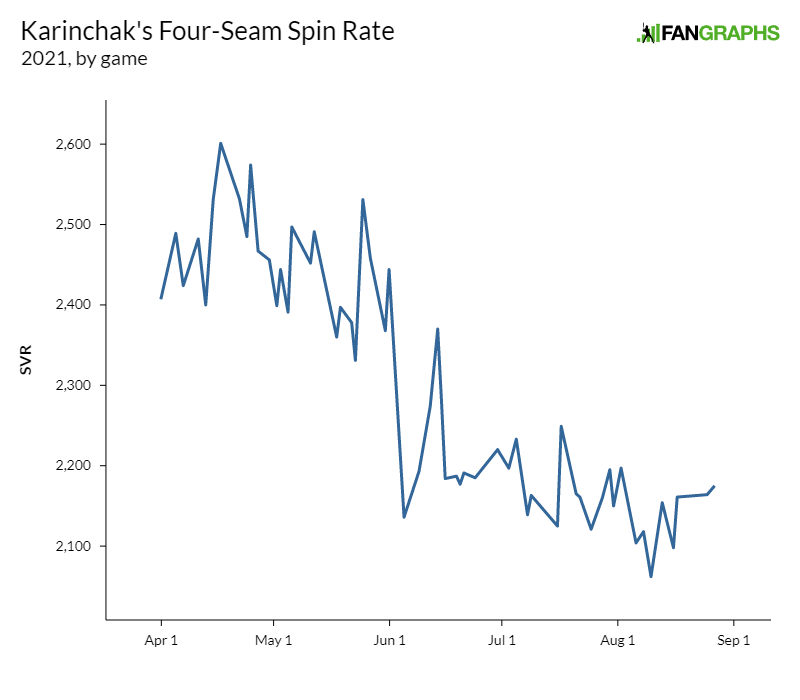
Not coincidentally, Karinchak’s results slipped at the same time. He’d been an unhittable, fire-breathing, back-of-the-bullpen monster since reaching the majors. From June 1, 2021 onwards, however, he posted a 5.40 ERA and a 5.41 FIP, and got demoted to the minors at the end of August. The fall from grace was swift, and seemed obviously related to the change in foreign substance enforcement. Read the rest of this entry »

Last week, we at FanGraphs came up with a fun idea: we simulated Aaron Judge’s remaining games a million times to figure out if and when he’s likely to hit some milestone home runs: numbers 60, 61, and 62. At the time, the takeaway was clear: Judge was most likely to hit each of those milestone home runs during the Yankees’ series in Toronto on September 26–28.
Since that article was published, Judge has played six games and hit only one home run. That changed the odds significantly. More specifically, per my simulation, here are his odds of reaching at least 60, 61, or 62 homers, both now and six games ago:
| Feat | Odds on 9/6 | Odds on 9/12 |
|---|---|---|
| 60+ Homers | 89.4% | 84.4% |
| 61+ Homers | 80.5% | 71.8% |
| 62+ Homers | 68.7% | 56.8% |
Yesterday, I took a look at a few starters who have changed their pitch mix after being traded halfway through this season. Today, I’m finishing the set. Here are the relievers who have changed their pitch selection the most in the month after joining new teams. One note: since relievers throw fewer pitches, the variability in their mix is greater; a few extra sliders to get the feel for them in a random game can tip the percentages meaningfully. I’m focusing on five relievers who made interesting changes, but you could add others to the list.
The Change: -12% Four-Seamer, -6% Changeup, +8% Cutter, +14% Slider
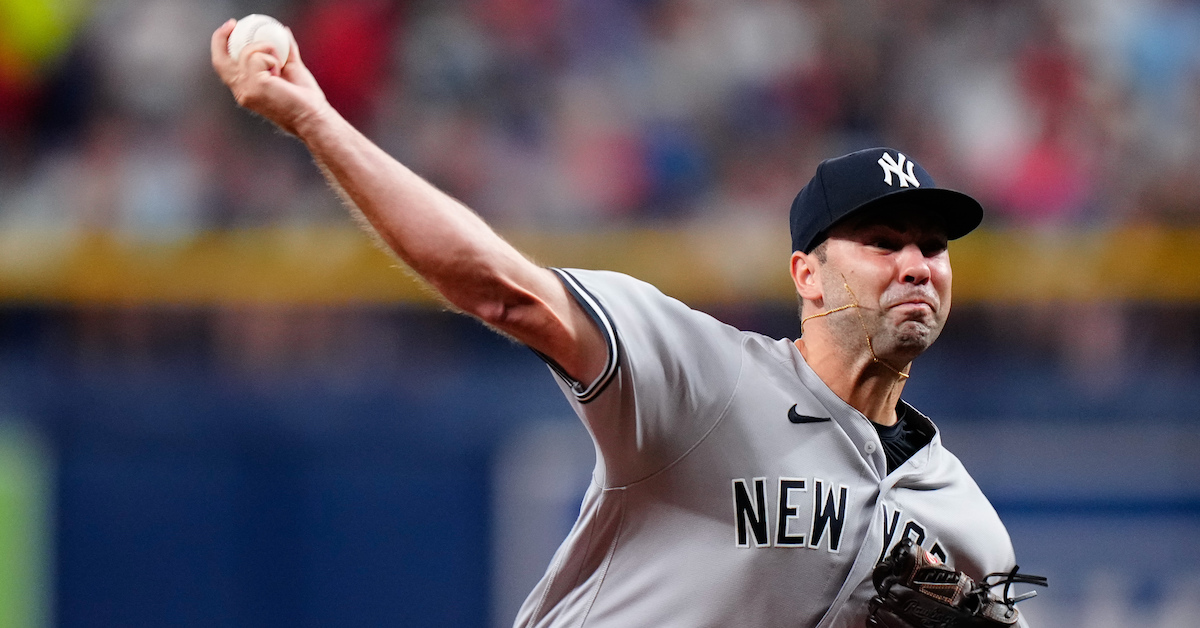
Trivino is a rarity, a legitimate five-pitch reliever. He’s thrown his changeup, slider, sinker, cutter, and four-seamer each at least 10% of the time this year, and mixed in an occasional curveball for good measure. The Yankees are working to change that.
Since donning pinstripes, Trivino is down to three pitches he uses at least 10% of the time: sinker, slider, cutter. His slider is new this year, one of the sweeping types that are all the rage these days, and he’d already taken to the pitch in Oakland, using it nearly 20% of the time. He’s using it even more in New York; a third of the pitches he’s thrown as a Yankee have been sliders. Read the rest of this entry »

Every year, a huge throng of pitchers changes teams at the trade deadline. It happens for obvious reasons: teams with postseason aspirations and second-division pitching staffs try to augment their squad, juggernauts shore up their bullpen, or any of several variations on those themes. For the most part, it’s a simple re-allocation of good pitching: teams that don’t need it this year trade pitchers to teams that do, and reap prospects or otherwise interesting players in return.
Sometimes, though, teams make trades for a slightly different reason. Pitchers aren’t static; you can’t call someone up on the phone and trade for a 3.40 ERA, or 2.4 WAR per 200 innings pitched, or anything of the sort. You trade for a pitcher, and as we detail frequently in the electronic pages of FanGraphs, pitchers change the way they approach their craft all the time. They might take a new approach, or learn a new pitch, or switch roles. Learning a new pitch isn’t practical in the heat of a playoff chase, but changing the allocation of existing pitches is far easier. Let’s take a look at two starting pitchers who have changed their pitch mix significantly since being traded at the deadline, as well as two others who have made smaller changes. Read the rest of this entry »

Aaron Judge is doing something that most baseball fans, myself included, haven’t seen in their lifetime: He’s making a run at the American League home run record. Even if you don’t do some steroid-related asterisking of Barry Bonds et al., passing Babe Ruth and Roger Maris is a heck of an accomplishment; if you want to stick your fingers in your ears and ignore the late 1990s and early 2000s, it only makes Judge’s chase more consequential. Truly, this is an exciting time to follow baseball.
Normally, I’m the writer who pours cold water on everyone’s fun during chases like this. “Sure, he’s doing well now,” I’d say, “but if you look at his career numbers, he’s on pace to fall short.” Well for once, that’s not true! If you look at our Depth Charts projections, our median expectation for Judge gives him a 62-homer season.
That’s a boring and dry number, but in baseball statistics nerd land, it’s rare and exceptional. Projecting someone to break a record is obviously rare – records usually get broken by phenomenal performances, not by median outcomes. In celebration of that, I thought I’d layer on a bit more analytical rigor and give people an idea of not just if, but when Judge might hit home runs number 60, 61, or 62.
I wanted an easy-to-understand process, so I kept it simple. I took the Yankees’ remaining schedule, then noted each remaining team’s HR/9+ (from our suite of Plus Stats), the venue’s righty home run park factor (from Statcast’s new park factors), and whether I think Judge will play that day. I also used our projections to get what we consider to be Judge’s current true home-run-per-plate-appearance level (it’s 7.14%, for those of you keeping score at home). Read the rest of this entry »
I, for one, am not a fan of the breakout of the “sweeper” in recent years. It’s not because I don’t enjoy frisbee-ish pitches that seem to pull out a map, ask for directions, and take a sharp turn on their way from the mound to home. A big part of my job is making GIFs of fun pitches, so I obviously love that part. Personally, I just don’t like the annoyance involved in classifying them.
To give you an example, I decided to do some research on sweeping sliders, or whirlies if you’re into weird nomenclature. In fact, that’s what this article is about. On my way to doing so, however, I had to spend some time getting obnoxiously technical. First, I downloaded all the sliders that right-handed pitchers have thrown this year. I separated them by movement profile, then started asking questions.
I asked a few people, “Does this scatter plot look like it separates out sweepers and non-sweepers to you?” It kind of did, and it also kind of didn’t. Are pitches that have 30% more horizontal break than vertical break sweepers? What about 50%? What about pitches that break a foot horizontally but move six inches downward? I sent several variations of that chart trying to nail it down, but nothing felt quite right – I’ll spare you having to look at the mess I ended up with. Read the rest of this entry »

At this point, it’s becoming a meme. The Orioles chug along, at or around .500, and our playoff odds continue to say that they’ll almost certainly miss postseason play. Across the internet, sites like Baseball Reference and FiveThirtyEight give them a higher chance. The headlines write themselves: “Why doesn’t FanGraphs believe in the Orioles?”
Just to give you an example, after the games of July 29, the Orioles were 51–49. Baseball Reference gave them a 34% chance of reaching the playoffs; we gave them a 4.6% chance. Ten days later, on August 8, Baseball Prospectus pegged them at 22.2% while we had them at 5.4%. On August 11, FiveThirtyEight estimated their playoff odds at 16%; we had those odds at 5.7%. Another week later, on August 19, Baseball Reference pegged them at 35.5% to reach the playoffs; we gave them a 4% chance. You can snapshot whatever day you’d like and you’d reach the same conclusion: we don’t think the Orioles are very likely to make the playoffs, while other outlets do.
Now, we’re getting down to brass tacks. The Orioles are 68–61 after Wednesday’s games. Baseball Reference thinks they are 43.6% to reach the postseason. FiveThirtyEight isn’t quite so optimistic, but still gives them 23% odds, while Baseball Prospectus has them at 29.9%. Here at FanGraphs, we’re down at 6.6%, even after they called up top prospect Gunnar Henderson. Why don’t we believe? Read the rest of this entry »

You know the basics of Lars Nootbaar’s story, because you know how the Cardinals seem to work. An eighth-round draft pick in 2018, he held his own in an increasingly tough set of minor league assignments, made the show in ’21, and is now leading off for one of the best offensive teams in baseball. He’s putting up more or less the best offensive performance of his career, and doing it in the major leagues after less than 1,000 minor league plate appearances. Nothing to it! Just a little devil magic, move on with your lives.
If you look a bit deeper than the basics, though, Nootbaar gets far more interesting. That same old story? It’s not really right. Nootbaar isn’t the same player he was when he was drafted. He’s a slugging corner outfielder who probably had a lot to do with the Cardinals’ willingness to trade Harrison Bader at the deadline. Let’s take a journey through his pro career and see if we can predict his future at the end of it.
When he was drafted, Nootbaar was an approach-over-tools prospect. He’s always had a good sense of the strike zone; the question was whether he’d be able to muster enough power on contact to keep high-level pitchers from knocking the bat out of his hands. In 2018 and ’19, that concern seemed pressing: in 265 plate appearances between Hi-A and Double-A, he hit only two homers and posted a .055 ISO. In other words, pitchers were knocking the bat out of his hands. He posted an average batting line anyway, but let’s face it: that’s an uninspiring start to a career.
Read the rest of this entry »
Here’s a thing that you could say about José Berríos: he’s been a lousy pitcher this year. I don’t even think he would argue with you on that one; after signing a seven-year, $131 million deal with the Blue Jays, he’s having comfortably his worst season in the majors. His 5.28 ERA is more than a run higher than his career mark coming into the year despite the declining offensive environment. He’s striking fewer batters out and giving up home runs at an alarming rate. Whether you’re talking about advanced or standard metrics, new school or old school, it’s been a disaster of a year.
Here’s another thing you could say about Berríos: he’s a solid pitcher who’s sticking with the approach that got him here in the first place. If you thought he was good last year — and you probably did, given that he put up a mid-3s ERA in both Minnesota and Toronto with the peripherals to match — you’d expect him to be good again this year. He’s not losing velocity. He didn’t change his pitch mix. He didn’t suddenly lose command of the zone. What the heck is happening here?
Before we go any further in this investigation, I’m going to spoil the conclusion a little bit: I don’t know the answer. I don’t think there’s an obvious answer at all, in fact. If there were, I’m fairly certain the Jays would have figured it out by now. Whatever’s ailing Berríos, it’s somewhere on the margins. Read the rest of this entry »