As is tradition at FanGraphs, we’re using the lead-up to next week’s trade deadline to take stock of the top 50 players in baseball by trade value. For a more detailed introduction to this year’s exercise, as well as a look at the players who fell just short of the top 50, be sure to read the Introduction and Honorable Mentions piece, which can be found in the widget above.
For those of you who have been reading the Trade Value Series the last few seasons, the format should look familiar. For every player, you’ll see a table with the player’s projected five-year WAR from 2023-2027, courtesy of Dan Szymborski’s ZiPS projections. The table will also include the player’s guaranteed money, if any, the year through which their team has contractual control of them, last year’s rank (if applicable), and then projections, contract status, and age for each individual season through 2027, if the player is under contract or team control for those seasons. Last year’s rank includes a link to the relevant 2021 post. Thanks are due to Sean Dolinar for his help in creating the tables in these posts. At the bottom of the page, there is a grid showing all of the players who have been ranked up to this point.
One note on the rankings: particularly at the bottom of the list, there isn’t a lot of room between the players. The ordinal rankings clearly matter, and we put them there for a reason, but there’s not much of a gap between, say, the 35th ranked player and 50th. The magnitude of differences in this part of the list is quite small. Several folks I talked to might prefer a player in the honorable mentions section to one on the back end of the list, or vice versa. I think the broad strokes are correct — but with so many players carrying roughly equivalent value, disagreements abounded. Read the rest of this entry »
Baseball’s annual rituals have been around for so long that they feel like an immutable part of the fabric of life. Pitchers and catchers reporting, the All-Star break, September playoff chases and, of course, FanGraphs leaving your favorite player off of our top 50 trade value rankings, which we do to spite you (and them) specifically.
I kid, of course, but today does mark the first installment of our annual Trade Value Series. In the following days, we’ll release our list, taking performance, age, and contract into account. Dave Cameron, Kiley McDaniel, and Craig Edwards all helmed this exercise at various points in the past, and after tag-teaming with Kevin Goldstein last year, I’ve taken over on my own.
That doesn’t mean I haven’t gotten help. I considered a broad range of inputs: estimates of current value, projections of future value, age, contract status, positional scarcity, Statcast data, and anything else I could dream up. From there, I solicited feedback from the rest of the FanGraphs staff (special thanks are due to Dan Szymborski for his ZiPS assistance and Sean Dolinar for his technical wizardry) and consulted with several outside sources, both public- and team-side, to compile the final order. Make no mistake, this is still my list, and it’s an inherently subjective estimation, but I’d like to think it’s an informed one. Read the rest of this entry »
It’s a good thing that baseball writers don’t get tested on our ability to do fractions. Since time immemorial, we’ve called the All-Star break the halfway mark of the season. It’s not. Every team has played at least 90 games, even in a season with a delayed start. In fact, this is the season where calling the All-Star break the halfway mark would make most sense, and it’s still wrong.
Why do we do it? Partially, it’s because it sure would be convenient if the break really did mark the halfway point. Dividing the season into two halves makes for some fun analysis, and it works a lot better when the division occurs at a point with an event around it, rather than some random Tuesday in early July. It’s also because it creates something interesting to write about during a gap when game play would otherwise be stopped. There’s dead air every year around this time; filling it with “in the first half of the season” stories makes good sense.
I’m rambling, though. The point is, it’s the All-Star break, and I want to write an article about terrible swings. What was I going to call it, the worst swings of the first 55.5% of the season? That’s not catchy enough. “First half” just sounds better. And so here, perpetuating a bad sportswriter generalization, are the worst swings of the first half of the season.
A few ground rules: I’m focusing on swings at fastballs. Bad swings at breaking pitches are funny, but they’re understandable. Those pitches were designed to deceive, and they accomplished their goal. Sure, maybe swinging at a slider that bounces in the opposite batter’s box isn’t a good look, but I can understand how a hitter might end up there. Baseball is an unfair game. The pitches move funny. Read the rest of this entry »
The Nationals are going to trade Juan Soto. Oh, sure, it’s not official yet, but it’s basically official. After he turned down their most recent extension offer, a reported 15-year, $450 million deal, reports emerged that the team was open to dealing him. And with the trade deadline conveniently only weeks away, general manager Mike Rizzo will have no shortage of phone calls to field in the coming days.
In a fortuitous coincidence, I’m currently working on our annual trade value series, so I’ve spent a good deal of time considering Soto’s value. He’s an interesting case, perhaps one without precedent in the trade market. He’s undoubtedly one of the best five or so players in baseball. In a down year, he’s still hitting .250/.405/.497, good for a 152 wRC+. That’s the kind of production that most players would call a career year, and we’re writing about adjustments he can make.
In addition, Soto is no rental. He’s under team control through the 2024 season, and while he’ll command record-breaking arbitration salaries for the next two years, he’ll still be an unbelievable bargain while doing so. Consider: He’s making $17.1 million this year in arbitration and on pace for roughly 5 WAR in a down year. What would teams pay for that production on the open market? Well, the Mets are paying Max Scherzer $43.3 million per year over the next three years, and Soto has out-WAR’ed Scherzer in each of the past three seasons. He’s also only 23, so it’s not as though he’s approaching age-related decline. Read the rest of this entry »
Baseball is a dynamic sport. Sure, it’s static plenty of the time — there’s a lot of spitting, scratching, and adjusting between pitches — but wait for a ball in play, and everyone on the field moves as though jolted by electricity. Fielders rearrange themselves based on the path of the ball. Baserunners charge, pause, and retreat according to a set of rules they know by heart. The batter tears out of the box — or jogs, or strolls, as the case may be — before adjusting based on the flight of the ball and the action on the field.
That intricate burst of motion is thrilling. It explains why fans, players, and the league as a whole want more balls in play. Thanks to Statcast, it’s also measurable. More specifically, Statcast measures and publishes sprint speed, which you can think of as the average top speed a player achieves across all of their competitive runs.
On the other hand, maybe the board doesn’t work. An average of your competitive runs depends on what “competitive” means. Loaf on one of those, and you’re dragging your average down. Loaf on a run that just ticks over the border to uncompetitive, and it won’t count. Anytime you’re measuring a subset of all runs — an admirable goal, because comparing apples to apples is important — you’re opening yourself up to error due to the definition of that subset. Read the rest of this entry »
There is a rule in baseball that allows managers to intentionally walk opposing batters automatically. More specifically, “following the signal of the manager’s intention, the umpire will immediately award first base to the batter.” Depending on who you ask, it’s either a minor time saver or completely pointless.
There is a generally accepted practice in baseball that intentional walks are either issued at the start of a plate appearance, after first base becomes open, or when the count begins to favor a batter. You won’t find that anywhere in the rulebook, but it’s true nonetheless. It’s a common-sense practice: the only other time you can walk a batter intentionally is after a pitch tilts the count in the pitcher’s favor, and if an intentional walk makes sense then, it probably made sense before that pitch was thrown.
Baseball conventional wisdom isn’t always correct. In the case of when to intentionally walk a batter, though, it follows straightforward logic. Allow me to make an analogy. Let’s say you and I have made a strange deal. I have 60 seconds to accomplish some task – call it untangling a knot. If I manage it, you’ll owe me $10. Before I start, I make you an offer: you can just hand me $5 now and we’ll call the whole thing off. You can trade the possibility of a $10 loss for the certainty of a $5 loss.
Let’s further say that you turn me down, and that the clock starts. For the first 10 seconds, I don’t do anything — maybe I stubbed my toe and am hopping around in pain. After those 10 seconds, I offer you the same deal: for $5, we can call the same thing off. You wouldn’t take me up on it, of course. You liked your odds enough that you didn’t opt out before, and now I’m less likely to accomplish my task.
Anyway, Tony La Russa intentionally walked José Ramírez yesterday. He did so automatically, in keeping with the rules of the game, by signaling to the umpire from the dugout. He did it in contravention of the generally accepted practices of the game, though, by issuing the walk while Ramírez was behind 0-1 in the count.
In an abstract sense, it’s pretty clear why you wouldn’t do this. The knot-untangling game is a clunky analogy but it gets the point across. There’s no reason to run the numbers: by the numbers, the walk doesn’t make sense. But abstractions don’t always tell the whole story, so let’s look at the specific circumstances around this walk and see if any of them can shed some light on what happened here.
First, the situation. Ramírez came to bat with two outs in the fifth inning. Amed Rosario, the previous batter, had doubled to make the score 4-0 and now stood on second base. Davis Martin, the White Sox starter, stayed in to face Ramírez. Pitching coach Ethan Katz came out for a discussion with Martin. After that meeting came this pitch:
From there, La Russa had seen enough: he walked Ramírez. Martin recovered to strike Franmil Reyes out, escaping the inning. It didn’t matter, in either case; the Sox only scored once all game, and Cleveland held on to win 4-1.
“…Sometimes… they get themselves out. And if they get good patience, it’s like an unintentional intentional walk. So that’s what Ethan went out to say, and the first pitch was on the plate. He fouled it off, so I said, well, put him on. I just think it’s lack of experience for Davis and understanding more about that situation. Because he’s smart enough to know to pitch off the plate and he got it on, cost him two runs. He was supposed to do it again, and after one strike, said no.”
First things first: that explains the pitching meeting. Katz was out there to tell Martin to pitch around Ramírez. Ramírez had singled in two runs in the third inning, as La Russa alluded to above. Easy peasy, right? He wanted Martin to get Ramírez to chase, Ramírez didn’t, let’s face the next batter.
Only, that description glosses over the change in count, which is the most meaningful thing that happened on that first pitch. If you’re looking to record an out, a foul ball is a pretty good place to start. José Ramírez is one of the best hitters in baseball. For his career, he’s hitting .279/.356/.507, and he’s better than that now. Even after 0-1 counts, he’s hitting .266/.307/.472 for a perfectly acceptable 106 wRC+.
But again, the question isn’t whether walking Ramírez made sense. I think I would have walked him there from the start, but I don’t believe it’s an obvious choice either way. The question, instead, is whether the information in that foul ball tilted the balance in favor of an intentional walk.
We know La Russa’s case: the pitch being on the plate proved to him that Martin couldn’t follow his instructions. He wanted pitches out of the zone, he didn’t get them, and he didn’t need to see anything more. It’s not that Ramírez made devastating contact – per Statcast, that foul ball was 63 mph off the bat, though I’m not sure how accurate foul ball exit velocity readings are – but merely the location of the pitch that made an intentional walk a good option.
I can’t tell you what the odds of Ramírez getting a hit on a ball in the strike zone were. La Russa can’t either – but from the sound of his comments, it sounds deterministic. In the third inning, when Martin left a pitch over the plate, it “cost him two runs.” Let’s see the pitch in question:
Unquestionably, two runs scored on that play. Unquestionably, Ramírez hit a single. He even hit the ball pretty hard. But is that a process failure by Martin? I’m not so sure. He threw a well-located changeup that Ramírez put on the ground into the shift. Position your second baseman three steps to the right, and that might be an out instead. Ramírez is great – but he’s hardly a guaranteed base hit every time a pitch is in the strike zone.
There’s really not much more to say than that. In La Russa’s mind, a pitch in the strike zone was unacceptable. I don’t for a second think that Martin meant to throw that changeup in the zone. Pitchers miss their targets sometimes, and Reese McGuire was setting up fairly close to the zone anyway.
I’m just an analyst on the internet. I’ve never managed a team. I won’t claim to know any of the exact numbers here, or whether Katz came out to tell Martin that any pitch in the strike zone, regardless of outcome, would lead to an intentional walk. But if I were La Russa, I wouldn’t give that order.
I’m just projecting, but it seems to me that La Russa is substituting absolutes for probabilities. You can pitch Ramírez in the zone and get an out. You can try to miss the zone and hit it. It’s not black and white – sometimes a bad process leads to a good outcome, and vice versa. That’s baseball in a nutshell: the edges are small either way, and both sides can’t win. All you can do is give yourself the best chance to succeed – pitchers have singled against Jacob deGrom, and Mike Trout has struck out against bad relievers. There are no absolutes.
Maybe I’m misunderstanding La Russa’s logic. Maybe there’s a detail left out somewhere, or something lost in translation. I don’t think so, though. Sometimes, you have to take people at their word. La Russa didn’t care about the fact that the foul ball made the count 0-1. It didn’t enter into his decision making. It wasn’t a question of whether Ramírez’s odds of getting on base changed after the combination of a pitch in the zone and a foul ball. It was just: pitch in zone, walk.
If you like La Russa’s decision making this year, this one won’t change your mind. In fact, you probably agree with him that baseball can be reduced to a binary. Pitches in the zone when you want to throw them out of the zone turn into runs, and so on and so forth.
If you haven’t liked La Russa’s decision making, on the other hand, this is just more evidence. When you deal in absolutes, you miss out on the fact that hitters do worse after 0-1 counts than overall, or that getting the other team’s best hitter to ground the ball into the shift is an overall good thing. You might also inadvertently belittle your pitcher after the game; “he’s smart enough to know” is something people say about children or pets.
If you came here to see the math behind another unlikely intentional walk, I’m sorry. There really isn’t any. You either trust that Tony La Russa knows enough that when he makes a wildly counter-intuitive decision, it’s for good reasons, or you don’t. As best as I can tell, there have never been any similar intentional walks, though our pitch-by-pitch database only goes back to 2002 and it’s entirely possible I missed some anyway. Is your faith in La Russa’s genius enough to outstrip that? That’s for you to decide on your own.
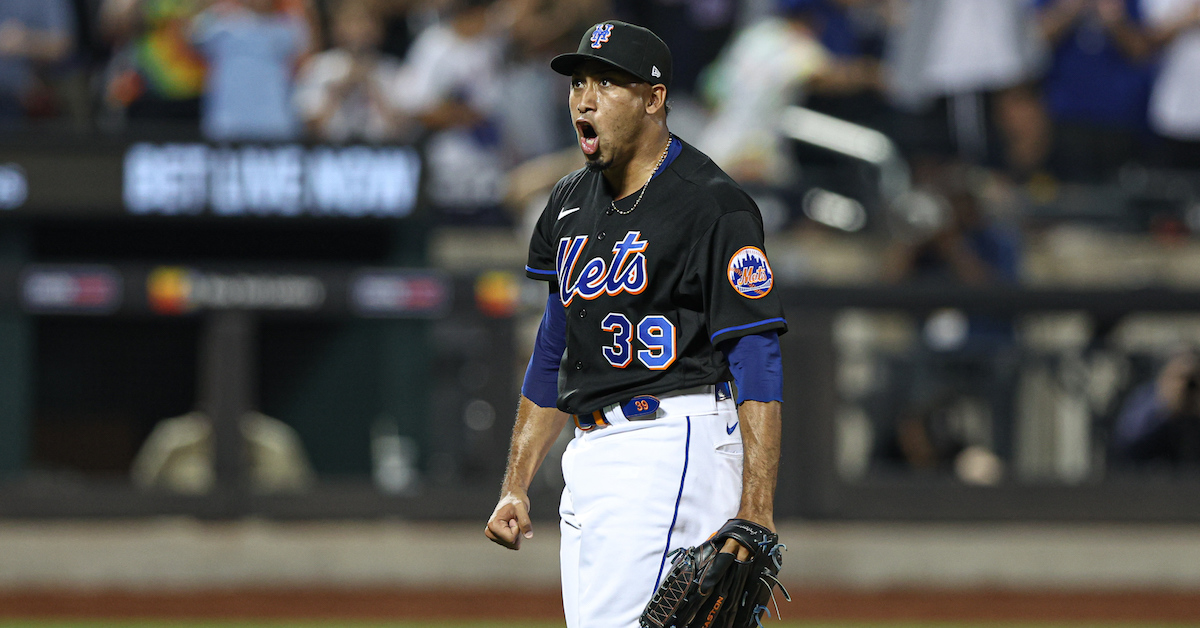
The New York Mets acquired Edwin Díaz in a trade with the Seattle Mariners before the 2019 season. At the time, the deal was controversial, to put it charitably. Díaz was coming off a breakout 2018 season, one that established him as the best young reliever in baseball. He struck out 44.3% of his opponents en route to a 1.96 ERA (1.61 FIP, 1.78 xFIP) and had four years of team control remaining.
That combination of skill and value doesn’t come around often, and the Mets paid dearly for it. They took Robinson Canó and his contract along with Díaz, and sent multiple prospects back in the bargain, headlined by Jarred Kelenic, their previous year’s first round draft pick and a consensus future star. Things went quite poorly for New York out of the gate; Kelenic flew through the minors, Díaz posted a 5.59 ERA in his first season with the Mets, and Canó had his worst season since 2008.
You probably already knew all of that. It wasn’t exactly a small story at the time, and when Kelenic debuted at the start of the 2021 season while Canó was serving a suspension for violating the league’s performance-enhancing drug policy, the “Mets snatch defeat from the jaws of victory” headlines reached a fever pitch. But with the benefit of 15 more months of games, and also as someone who isn’t particularly good at hot takes, allow me to add this to the discourse: Edwin Díaz is really good. Read the rest of this entry »