Author Archive

A Playoff Pitching Primer

The playoffs feature the best teams, with the best hitters squaring off against the pitchers with the best stuff. The stakes and the quality of the competition force teams to respond to fluctuations in leverage more quickly than they would in the regular season. This response makes sense: every change in win probability has an outsized effect on championship probability, so major league clubs act accordingly.

In his dissection of Kevin Cash’s decision to pull Blake Snell in the sixth inning of Game Six of the 2020 World Series, Ben Lindbergh pointed out that starting pitchers leave playoff games earlier than regular season contests, with relief pitchers now throwing the majority of playoff innings. Lindbergh also noted that more playoff starters threw 3 1/3 innings or fewer in 2020 than went at least six, a product of teams’ acceptance of the third time through the order penalty. The third time through the order penalty is real, especially for starters who lack deep repertoires. Removing starters after they turn the lineup over once or twice in favor of a high-octane bullpen arm throwing 97 mph with a slider gives the pitching team a better chance of recording an out in situations where the outcome of the game hangs in the balance.

With starters aware that they are on a short leash and likely won’t see a hitter more than once or twice, I figured it was worth looking at how pitch usage changes in the postseason. I pulled every pitcher who threw at least 50 pitches in both the regular season and the playoffs from 2015-20. I calculated each pitcher’s pitch usage in the regular season and playoffs separately and took the differences in pitch usage for each pitch. My hypothesis was that hurlers who feature a bevy of different pitches would lean more on their more trusted offerings knowing they likely won’t be asked to go deep into the game and will be pulled at the first sign of any trouble. Similarly, I thought that pitchers who employ a limited arsenal would trust their favorite pitch with the increased pressure of getting their clubs back to the dugout without allowing runs. Read the rest of this entry »

Luis Castillo Has Revitalized His Season

I am not going to beat around the bush: Luis Castillo had a miserable start to the season. On Opening Day against the Cardinals, he allowed 10 runs (eight of which were earned) and recorded zero strikeouts in just three and a third innings of work. He bounced back about a week later against Pittsburgh, tossing seven innings with five strikeouts versus one walk without surrendering a run. But despite that showing, Castillo’s Opening Day struggles proved to be more than a blip on the radar for a pitcher who ranked among the top 20 in baseball over the three seasons prior to 2021. At the beginning of May, Castillo still had an ERA above six (6.07); it would not dip below that mark until his June 15 start against Milwaukee. His ERA peaked (apart from the stretch between his first and second start) at 7.61 on May 23. As of this writing, his ERA is 4.20; he has accumulated 3.0 WAR over 163 innings, placing him 26th in the majors among qualifiers.

So what has changed? Back on May 18, Justin Choi wrote about Castillo’s performance through his first eight starts, attempting to diagnose what plagued the Reds right-hander. Justin first looked at Castillo’s changeup, which had long been his most effective offering but which was generating far fewer whiffs than before. Justin found that the pitch was dropping more than it had in the past, though Castillo was still able to locate it just below the lower edge of the strike zone. The rest of Castillo’s repertoire (a sinker, four-seamer, and slider), on the other hand, was being placed right down the pipe. Justin concluded that the location of Castillo’s changeup were so different from that of the rest of his pitches that batters were either laying off the changeup or swinging at the few that landed closer to the heart of the zone.

Since Justin published his analysis, Castillo has compiled a 3.15 ERA and ranks 10th in WAR. Let’s try to locate the difference. Year-over-year, his pitch mix is largely the same:

Luis Castillo’s Pitch Mix
Season CH FF SI SL
2018 26.2 36.4 20.9 16.5
2019 32.3 29.2 21.5 17.0
2020 30.0 27.1 25.2 17.7
2021 29.2 29.0 24 17.9
SOURCE: Baseball Savant

Read the rest of this entry »


Max Fried Is Leading the Resurgent Braves

The Braves have been a revelation over the last month. Jay Jaffe detailed last week how Atlanta turned its season around after the trade deadline, adding 67.4 points to its division odds and 5.3 points to its World Series odds in roughly three weeks. And all of that was in spite of losing Ronald Acuña Jr., for the season to a torn ACL. The Braves have gotten solid contributions across the board from their new-look outfield of Joc Pederson, Adam Duvall, and Jorge Soler, all acquired around or at the deadline. Of the rest of the core, only Ozzie Albies has performed worse post-July 30; the trio of Freddie Freeman, Dansby Swanson, and Austin Riley have been among the most productive players in the NL in that same span.

Aggression in adding outfielders at the deadline in conjunction with a high level of play from star hitters has helped Atlanta surge to the top of the standings. The pitching has held up its end of the bargain as well, though, ranking as a top-10 unit since the trade deadline, improving its ERA by just over half a run and posting the sixth-best strikeout and walk rates during that timeframe.

Much of this success can be attributed to Max Fried. Since the deadline, he ranks third in WAR among qualified pitchers, buoyed by a minuscule walk rate (1.6%, best in the majors) and a massive ground-ball rate (57.5%, fifth in the majors). That’s a recipe for elite performance even with a middling strikeout rate. It’s also a more exaggerated version of the profile he has shown since he became a full-time starter for the Braves two seasons ago; from 2019 to ’20, he ran a 53.5% ground-ball rate, a 24.1% strikeout rate, and a mere 7.1% walk rate.

Fried’s season has not always been this smooth. After his first three starts, capped off by an eight-run, four-inning outing on April 13, his ERA sat at a grizzly 11.45. Worse yet, in that last game, he strained his hamstring running the bases, was placed on the injured list, and did not return until May 5 against the Nationals, allowing one run over five innings with six strikeouts and one walk. Besides missing a turn in the rotation due to a blister on his left index finger back in late June, he has effectively put his April woes behind him and pitched more like the version of himself we saw in the prior two seasons, with a 2.77 ERA and 23.9% strikeout rate.

Read the rest of this entry »


Are Walker Buehler’s Run Suppression Gains for Real?

Walker Buehler has been on a tear in the second half, leading all pitchers in WAR since the All-Star break at 1.8, just a hair ahead of Adam Wainwright, Frankie Montas, and Max Fried. For the season, he now ranks fourth in WAR among qualified starters (fifth if you include Jacob deGrom’s 92 preposterous innings), toting a 26.9% strikeout rate and a park-adjusted ERA 47% better than league average. His 2.11 ERA is more than half a run better than any other season in his career, and the park adjusted figure is his best by 15 points. It’s another great season from one of the consistently best pitchers in the majors; since becoming a full-time starter for the Dodgers back in 2018, Buehler has posted the 11th-most pitching WAR with the 19th-most innings pitched.

I am not breaking any news by pointing out that Buehler has been and continues to be excellent. The surface-level numbers indicate he has never been better. What caught my eye, however, was how he has gone about doing that. There have been some noticeable changes under the hood. For example, at age 26, he has lost over a full tick of velocity on his fastball compared to any prior season; based on my own research, you would expect a player of his age to lose only about 0.15 mph.

Buehler has also lost almost two percentage points on his strikeout rate. On its face, missing less bats and losing velocity is never something you want to see in a pitcher. (That said, he has brought his ground-ball rate back to pre-2020 levels, going from 35.5% last season to 43.8% this year, similar to his ’19 rate as well as a tick above the rest of the league in 2021.)

Read the rest of this entry »


Frankie Montas Has Rekindled an Old Friendship

After a disappointing 2020, Frankie Montas has had a nice bounce-back season. Following a breakout 2019 that saw him post strikeout and walk rates of 26.1% and 5.8%, respectively, and accumulate 2.9 WAR in just 96 innings (his season was cut short due to a PED suspension), Montas regressed heavily last year. His walk rate increased to 9.7%, while his strikeout rate dipped to 25.3%. Even while calling the Coliseum and its expansive outfield home, he posted a 1.70 HR/9 compared to just 0.75 in 2019. The end results were unseemly: he finished 2020 with a 5.60 ERA and a 4.74 FIP, an especially unimpressive figure given his home ballpark.

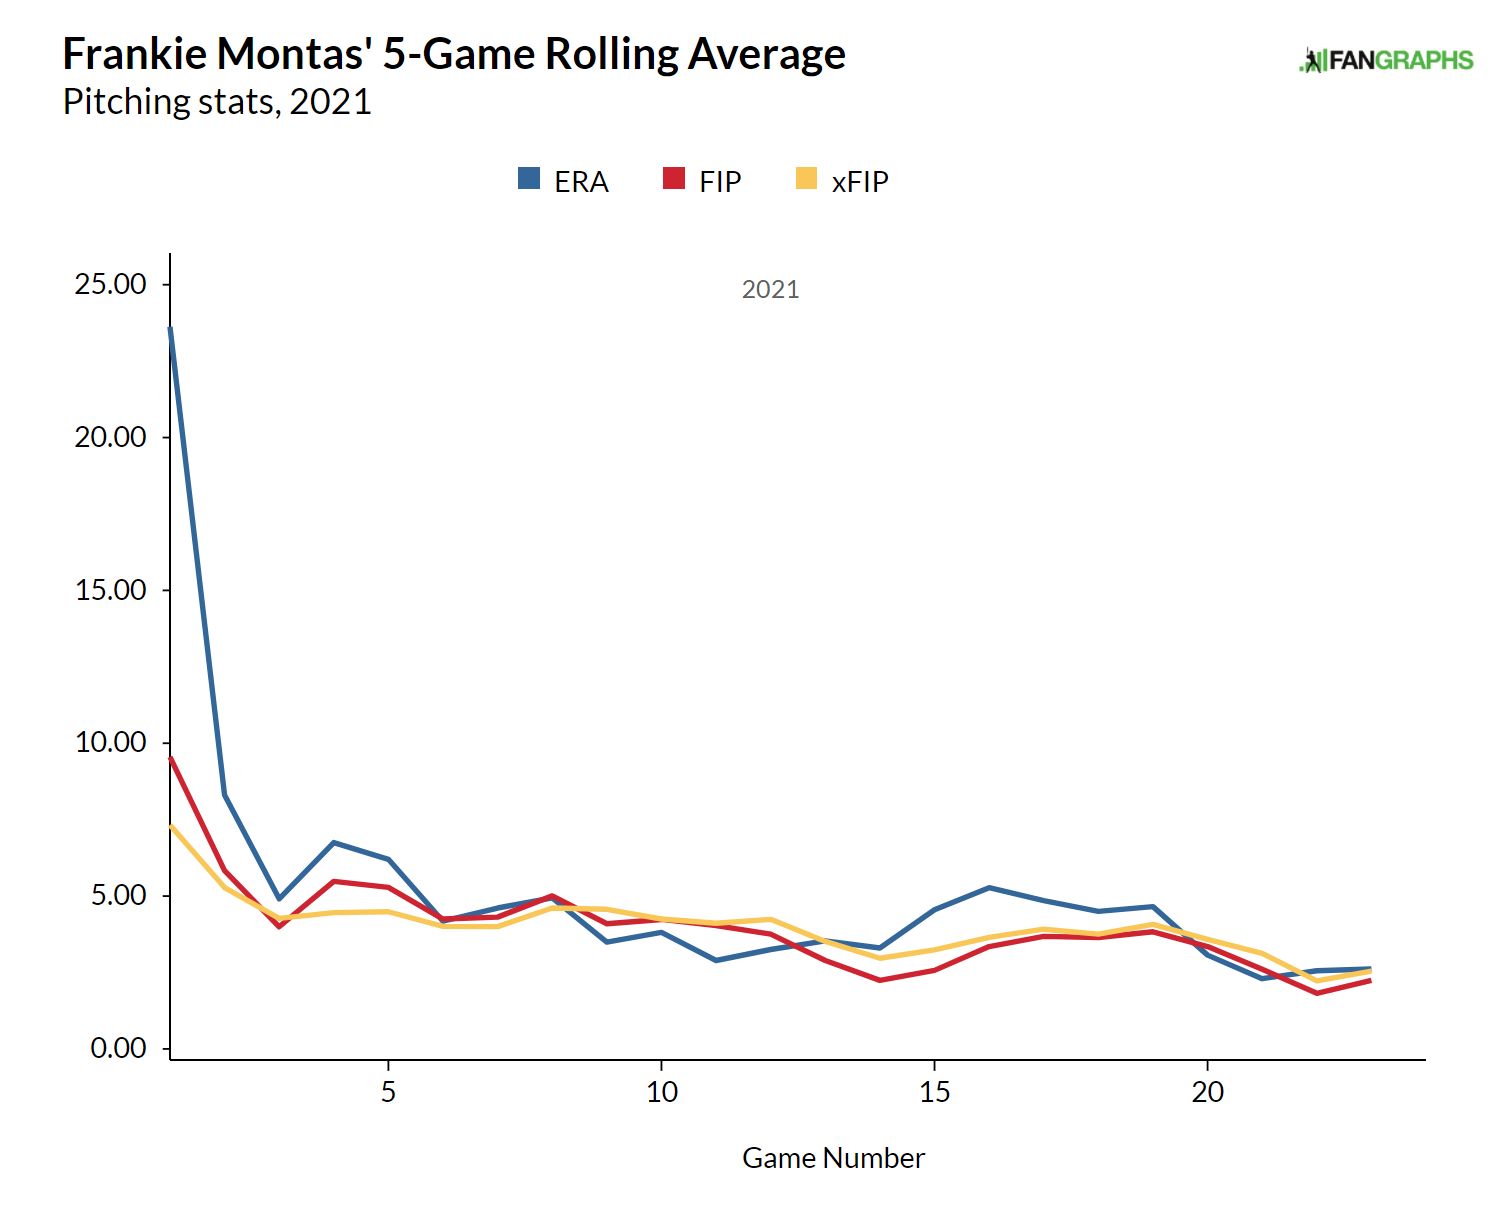
All the gains he made in 2019 were seemingly lost and at the start of 2021 not much appeared to be different. Montas was sitting on a 6.20 ERA at the end of April with a .369 wOBA allowed, a subpar strikeout rate (21.9%), and a walk rate (6.1%) that was only a slight improvement over the previous season. But early struggles masked a marked improvement from 2020. Much of that bloated ERA was attributable to a brutal start against the Dodgers on April 5 that lasted only 2.1 innings and included seven runs allowed (in fairness, Montas was coming off a finger injury sustained in a spring training start). He had one more disastrous start that month — an April 21 tilt versus the Twins during which he allowed six runs in four innings — but with those two stinkers in the rearview, Montas’ run suppression prowess has been on the mend. Indeed, besides those early hiccups, Montas has only had one start in which he has given up more than six runs (a June 21 start against Texas):

Through 23 starts and 131 innings, his ERA, FIP, and xFIP have all massively improved over 2020, placing at 3.98, 3.47, and 3.65, respectively. His strikeout and walk rates are back to 2019 levels (26.4% and 6.5%) as is his accumulation of WAR (2.5 as of this writing). In the last month alone, Montas has made five starts and pitched to a 2.64 ERA and 2.24 FIP, with a gaudy 35.3% strikeout rate; he’s been worth just over a win. Along with the steady performance of Chris Bassitt (be sure to check out Owen McGrattan’s excellent profile on Bassitt) and a career-best season from Sean Manaea, Montas is leading the way for the Athletics as they simultaneously try to hold onto their Wild Card spot and chase down the Astros for the AL West crown. Read the rest of this entry »


How Real Is Nicky Lopez’s Batting Line?

When Nicky Lopez steps to the plate, there is no in-between to his game. Of the 315 players who have seen at least 1,000 pitches over the past two seasons, Lopez places 27th in swinging strike rate (7.5%), in the top third in chase rate (24.7%), and in the top quarter in terms of the percentage of pitches put into play (18.8%) (all stats are through games on August 10). He combines elite plate discipline with an uncanny knack for making contact, an unusual mix of skills in the majors today. Players tend to make a trade-off when choosing to be more selective by accepting that they will put fewer balls in play. Balls in play have about a 178-point wOBA advantage over plate appearances that end in a walk or strikeout. But balls in play on pitches outside of the strike zone only enjoy a 97-point advantage over the combination of walks and strikeouts, a much less enticing proposition. Thus, by avoiding swinging at pitches outside the zone, hitters maximize their chances of putting a high-value batted ball into play, but also lengthen the plate appearance and increase the chance they strikeout. Lopez does not make this tradeoff, as you can see below:

I referenced Lopez’s minuscule 7.5% swinging strike rate; as a percentage of the total number of pitches he has seen, he rarely swings and comes up empty. He either makes contact or doesn’t swing at all. And the rate at which he swings at pitches overall is another indication of his selectivity. Over the last two seasons (2020-21), he’s swung at just 44.2% of the pitches he has seen, 2.9 percentage points less than the rest of the league over that sample.

Selectivity is great if you make it count when you do swing and put the ball in play on those pitches more towards the heart of the zone. Lopez’s problem, especially in his 2019 debut and last season, is that he often hasn’t reaped the benefits of his patience. This is the other side of his game. He has posted barrel rates in the second, fourth, and first percentiles and hard-hit rates in the second and sixth percentiles in his three seasons in the big leagues. He has also yielded zone run values per 100 pitches of -4.44, -5.17, and -3.02 in those seasons, compared to 1.86, 2.30, and 2.97 on pitches out of the zone, a product of his excellent approach but lack of punch when pitchers challenge him (average is 2.10 for out of zone and -2.21 for in zone). His career wOBAcon on the balls he puts in play inside the strike zone is just .302, 101 points lower than the league over that span. Through 937 major league plate appearances, he has hit three home runs, none of which have come in 2021. His extreme lack of pop has manifested itself in a 56 and 55 wRC+ in 2019 and ’20, respectively, the latter of which was also a product of his in-zone contact rate cratering to 82.4%. That placed him in the 51st percentile in 2020, not nearly high enough to offset the types of balls he puts into play. Read the rest of this entry »


Zach Plesac Has Lost What Made Him Break Out

Cleveland’s willingness to trade Francisco Lindor and Carlos Carrasco was the result of two related factors: ownership would not pay anything close to market value for one of the best players in baseball; and the club believed it could maintain competitiveness on the cheap with its core of cost-controlled pitching still receiving pre-arbitration checks. Shane Bieber is the headliner, but breakout seasons from previously unheralded prospects Aaron Civale and Zach Plesac gave the soon-to-be Guardians confidence that they could suppress runs at an above-average clip and hand the game off to a good bullpen.

That plan has not come to pass; Cleveland’s pitching staff ranks just 19th in WAR as of the writing of this piece. But while the bullpen has held up its end of the bargain, sitting ninth in WAR among relief units, the rotation has accumulated just 4 WAR total through the beginning of August.

Much of that can be attributed to the three starters who were supposed to lead the way. Bieber and Civale have been on ice for most season due to a shoulder strain for the former and a finger injury for the latter; both were recently moved to the 60-day IL with the hope of returning in September. Plesac has also missed time, but he hasn’t helped much when he has been on the field. Through his most recent start, he has posted a 4.84 ERA and 5.08 FIP and a strikeout rate of only 15.6%, fifth lowest among starters with at least 80 innings pitched.

Read the rest of this entry »


The Benefits of Changing a Hitter’s Eye Level

There is an old adage in baseball that changing a hitter’s eye level pitch-to-pitch will lead to better outcomes for the pitcher. This makes sense on its face: compared to varying pitch heights and forcing a hitter to alter his bat path, throwing two consecutive pitches at the same height should make it easier for a batter to square up the ball. In a New York Times piece by Tyler Kepner, Mike Mussina discussed the importance of varying locations pitch-to-pitch to mess with the hitter’s eye, offering the example of throwing fastballs down and then countering with a pitch up in the zone. Kepner noted that the hitter’s eye would then be trained on a pitch higher in strike zone, affording the pitcher the opportunity to throw a curveball down to induce a groundball, or net a swing-and-miss. David Price has expressed a similar sentiment: “That’s always a big emphasis [for] me, just making sure I’m hitting spots with that fastball – two-seam, four-seam, both sides of the plate, moving it in, up, down.”

In research on the effect of eye level change on college hitters’ performance against fastballs, Higuchi et al. found that quick eye movement as a pitch traverses towards home plate has negative consequences for the hitter. This research was included in Driveline Baseball’s examination of hitters’ gazes when standing at the plate. On these pages in 2015, Jonah Pemstein looked into whether a pitch thrown at a different height than the one that followed it affected how umpires called the pitch at hand. Permstein surmised that this was indeed the case, with umpires less likely to call a pitch a strike at any height if the previous pitch was thrown at a different vertical location.

As I said up top, this all makes intuitive sense. But does it hold up to further scrutiny? The research I cited by Higuchi et al. only included six collegiate hitters and only considered fastballs. While their work was extremely thorough, its scope didn’t consider the hitter population many of us are most interested in (major league hitters) and only included fastballs at a time when pitches are leaning on breaking balls and offspeed pitches more than ever. Pemstein’s research looked at umpires, not hitters; his conclusions give us some confidence that behavior changes when pitchers vary their pitch location, but doesn’t provide insight into the strategy’s ability to flummox batters. I decided to delve into the data myself and see if there was any merit to this fundamental aspect of pitching strategy.

Using Statcast data from the past three seasons, I constructed various pitch sequence parameters to gauge the efficacy of changing the hitter’s eye level. The first parameter involved pitches that were in the strike zone, as defined by the MLB Gameday zone. Pitches in zones 1, 2, and 3 were coded as “up,” zones 7, 8, and 9 as “down,” and 4, 5, and 6 as “middle.” All other zones were considered off the plate. I focused on pitches in the strike zone because we know hitters are more likely to swing at those pitches and generally have success when they do. The in-zone swinging strike rate over this sample was 12.1%, while 28.1% of these pitches were put into play. Batters had a .349 wOBA on pitches inside this strike zone versus a .304 wOBA outside of it. Any degradation in performance on pitches inside the zone would be a real value-add for pitchers. Read the rest of this entry »


Alex Reyes and Accepting High-Leverage Walks

On July 20, the Cardinals dropped a game to the Cubs despite going into the ninth inning with a 6–1 lead. Based on Greg Stoll’s win expectancy calculator, when the home team is winning by five runs in the top of the ninth, that’s a victory 99.7% of the time. The Cardinals acted accordingly, bringing in veteran journeyman Luis Garcia for his 2021 debut. This was mop-up duty … until it was not.

Garcia struck out Patrick Wisdom to start the inning, but he was able to reach first base on a dropped third strike. Nico Hoerner followed Wisdom with a single, and Jake Marisnick walked. The odds were still in the Cardinals’ favor; the win expectancy calculator gives the home team in this spot (up five, no outs and the bases loaded) a 97.2% chance of pulling it out. Nevertheless, manager Mike Shildt felt the heat enough to bring in his closer, Alex Reyes. But things did not go as planned. Reyes went walk, strikeout, walk, single, double; a 6–1 lead had turned into a 7–6 deficit in the blink of an eye.

The double did the most damage, but the walks are a theme with Reyes. The surface-level numbers are fantastic; dig one step deeper, and things look a little concerning. On the season, he has posted a 29.3% strikeout rate but also a 19.2% walk rate, leading to a 1.38 WHIP (league average is 1.29) and a 1.53 K/BB ratio that’s about 41% worse than the average pitcher. Reyes’ FIP is 3.68 despite the issues with walks, a testament to his strikeout prowess (led by a slider, curveball, and changeup that generate whiff rates of 46.4%, 57.9%, and 40.0%, respectively, per Baseball Savant) and his ability to induce groundballs with his bowling-ball sinker.

Still though, that walk rate is an issue, but what I want to do here is assuage some of the concerns and help reinforce a point made by Baseball Prospectus’ Jonathan Judge on Twitter just last week: that often a walk or hit-by-pitch is the next best outcome after a strikeout (compared to a ball in play). He noted that while Reyes is toeing the proverbial walk rate line, he has the tools to make that extreme profile work, especially with his ability to generate groundballs with his sinker.

Read the rest of this entry »


Aaron Bummer Has an Amazing Pitch but It Is Not the One You Think

What is the first thing that comes to mind when you think about Aaron Bummer? It’s an odd question I know. For many, the answer might not be a whole lot besides the fact that he has an amusing name. He is a reliever, after all; given his role, he’s not the most recognizable player. For the initiated, however, the first quality that comes to mind at the mere mention of Bummer is likely his supreme ability to generate groundballs. Bummer’s has been in the majors since 2017; in five seasons, he has posted groundball rates of 54.4%, 61.2%, 72.1%, 68.4% (I will note he only threw 9.1 innings in 2020), and 73.7%. Over that time frame, he ranks fourth in groundball rate among all pitchers who have tossed at least 50 innings.

The leading culprit behind his prolific groundball rates is his sinker. Sinkers have sharp downward movement that fade away from a pitcher’s glove-side. The downward movement, coupled with the pitch generally being lower in the zone, prevents hitters from squaring up the ball, instead impacting the upper-half, driving the ball into the dirt. This season, the average groundball rate for a sinker sits at 56.4% compared to 41.7% for all other pitch types. And Bummer has a great sinker, one that inspired a post from Devan Fink on these very pages last February. Devan demonstrated with a tidy model that Bummer’s sinker is an elite blend of velocity and arm-side and vertical movement, the perfect recipe for inducing piles of groundballs from the opposition. And Bummer’s sinker has remained excellent; in 2021, the pitch has a laughable 82.4% groundball rate. The pitch is so effective that it inspired its own profile from The Athletic’s James Fegan, which included an amusing story of Bummer picking up the pitch after watching Zack Britton pitch while the former dined at an Applebee’s.

Overall, Bummer has been an excellent reliever throughout his major league career. The White Sox signed him to a five-year contract prior to the 2020 season, with two club options tacked on to the end that can keep him on the South Side until 2026. Given the volatility of relievers, that’s quite the endorsement of Bummer’s skills and I find it difficult to fault Chicago for doing so. He has a career 3.23 ERA, a figure 26% better than league average when you consider the difficult confines of his home park. The park-adjusted FIP is just as impressive, sitting at 23% better than league average over 161.2 career innings. Read the rest of this entry »