Aaron Bummer Has an Amazing Pitch but It Is Not the One You Think
What is the first thing that comes to mind when you think about Aaron Bummer? It’s an odd question I know. For many, the answer might not be a whole lot besides the fact that he has an amusing name. He is a reliever, after all; given his role, he’s not the most recognizable player. For the initiated, however, the first quality that comes to mind at the mere mention of Bummer is likely his supreme ability to generate groundballs. Bummer’s has been in the majors since 2017; in five seasons, he has posted groundball rates of 54.4%, 61.2%, 72.1%, 68.4% (I will note he only threw 9.1 innings in 2020), and 73.7%. Over that time frame, he ranks fourth in groundball rate among all pitchers who have tossed at least 50 innings.
The leading culprit behind his prolific groundball rates is his sinker. Sinkers have sharp downward movement that fade away from a pitcher’s glove-side. The downward movement, coupled with the pitch generally being lower in the zone, prevents hitters from squaring up the ball, instead impacting the upper-half, driving the ball into the dirt. This season, the average groundball rate for a sinker sits at 56.4% compared to 41.7% for all other pitch types. And Bummer has a great sinker, one that inspired a post from Devan Fink on these very pages last February. Devan demonstrated with a tidy model that Bummer’s sinker is an elite blend of velocity and arm-side and vertical movement, the perfect recipe for inducing piles of groundballs from the opposition. And Bummer’s sinker has remained excellent; in 2021, the pitch has a laughable 82.4% groundball rate. The pitch is so effective that it inspired its own profile from The Athletic’s James Fegan, which included an amusing story of Bummer picking up the pitch after watching Zack Britton pitch while the former dined at an Applebee’s.
Overall, Bummer has been an excellent reliever throughout his major league career. The White Sox signed him to a five-year contract prior to the 2020 season, with two club options tacked on to the end that can keep him on the South Side until 2026. Given the volatility of relievers, that’s quite the endorsement of Bummer’s skills and I find it difficult to fault Chicago for doing so. He has a career 3.23 ERA, a figure 26% better than league average when you consider the difficult confines of his home park. The park-adjusted FIP is just as impressive, sitting at 23% better than league average over 161.2 career innings.
Clearly Bummer is a great pitcher with a groundball gambit that is almost unrivaled by any of his peers. But this shrouds a new phenomenon: he is punching hitters out at a much higher rate in recent seasons. From 2017-19, Bummer posted a 22.5% strikeout rate. In 2020-21, that is all the way up to 32.6%, a 44.8% increase relative to his previous rate. To explain that spike, we cannot turn to the sinker. Bummer’s sinker has a 22.0% whiff rate and 8.0% swinging strike rate in 2021, which in the context of the league is solid (league-wide rates are 15.4% and 7.0%, respectively), but would not seem to be the reason he is putting away so many more batters via the strikeout. That is where his slider comes into play.
Bummer’s slider has been among the best in baseball this year, with a swinging strike rate bested only by Jacob deGrom’s among pitchers who have thrown the pitch at least 100 times:
| Name | Team | SwStr% |
|---|---|---|
| Jacob deGrom | NYM | 35.0 |
| Aaron Bummer | CWS | 32.5 |
| Liam Hendriks | CWS | 30.5 |
| Josh Hader | MIL | 28.7 |
| Josh Taylor | BOS | 28.0 |
| Rex Brothers | CHC | 27.9 |
| Clayton Kershaw | LAD | 27.6 |
| Brooks Raley | HOU | 27.3 |
| Corbin Burnes | MIL | 27.1 |
| Ryan Tepera | CHC | 27.1 |
Those are some impressive names: the aforementioned deGrom, Liam Hendriks (fresh off his own massive payday by reliever standards), Josh Hader, Clayton Kershaw, and Corbin Burnes. Bummer has obviously thrown his slider less than those more-heralded starting pitchers, so you can argue the success with the slider is less impressive. Nevertheless, this is vaunted company. Dig a few steps deeper and Bummer’s success with the slider becomes more confounding with additional context. Here is the same leaderboard, with an extra measure tacked on:
| Name | Team | Zone% | SwStr% |
|---|---|---|---|
| Jacob deGrom | NYM | 30.6 | 35.0 |
| Aaron Bummer | CWS | 26.7 | 32.5 |
| Liam Hendriks | CWS | 35.5 | 30.5 |
| Josh Hader | MIL | 40.6 | 28.7 |
| Josh Taylor | BOS | 44.1 | 28.0 |
| Rex Brothers | CHC | 29.5 | 27.9 |
| Clayton Kershaw | LAD | 47.9 | 27.6 |
| Brooks Raley | HOU | 43.8 | 27.3 |
| Corbin Burnes | MIL | 37.5 | 27.1 |
| Ryan Tepera | CHC | 42.5 | 27.1 |
Bummer gets whiff on almost a third of his total sliders, while throwing the pitch in the strike zone only 26.7% of the time. The only other pitcher on this list to get more whiffs than pitches thrown in the zone is deGrom. In fact, Bummer’s zone rate with the slider is the lowest of all pitchers in the cohort and not by an insignificant amount:
| Name | Team | Zone% | SwStr% |
|---|---|---|---|
| Aaron Bummer | CWS | 26.7 | 32.5 |
| Sonny Gray | CIN | 27.9 | 14.5 |
| Trevor Williams | CHC | 28.0 | 19.3 |
| Rex Brothers | CHC | 29.5 | 27.9 |
| Will Smith | ATL | 30.5 | 24.3 |
| Jacob deGrom | NYM | 30.6 | 35.0 |
| Tony Gonsolin | LAD | 30.6 | 14.8 |
| Triston McKenzie | CLE | 31.2 | 21.5 |
| Michael Pineda | MIN | 31.3 | 20.5 |
| Tim Mayza | TOR | 31.4 | 16.9 |
In what is perhaps the most baffling tidbit of all, opposing batters cannot seem to stop swinging at it!
| Name | Team | Zone% | Swing% | Chase% |
|---|---|---|---|---|
| Aaron Bummer | CWS | 26.7 | 55.0 | 52.3 |
| Sonny Gray | CIN | 27.9 | 36.0 | 29.0 |
| Trevor Williams | CHC | 28.0 | 42.0 | 33.3 |
| Rex Brothers | CHC | 29.5 | 50.5 | 41.1 |
| Will Smith | ATL | 30.5 | 51.3 | 42.7 |
| Jacob deGrom | NYM | 30.6 | 60.1 | 52.5 |
| Tony Gonsolin | LAD | 30.6 | 37.0 | 20.0 |
| Triston McKenzie | CLE | 31.2 | 36.8 | 30.3 |
| Michael Pineda | MIN | 31.3 | 54.2 | 44.6 |
| Tim Mayza | TOR | 31.4 | 47.5 | 32.1 |
Only deGrom has posted higher swing rates and chase rates on the slider among the slider zone rate laggards. Let me emphasize the absurdity of what is going on with Bummer, his slider, and the opposition. Hitters are swinging at more than double the pitches that end up in the zone. The league average zone and swing rates are about 49% and 46%, respectively. Of Bummer’s sliders that end up out of the strike zone (which is the vast majority of them), batters are still swinging at 52.3%. Getting hitters to swing at pitches outside the strike zone is the most valuable outcome of a pitch without considering the result of the swing. For every 100 pitches a hitter swings at out of the strike zone, the pitcher gains about expected 5.5 runs (based on 2021 data). With his slider alone, Bummer has garnered 10.1 expected runs in his favor per 100 out of zone sliders, about a full win’s worth of run expectancy.
In terms of physical characteristics, the slider also displays notable attributes. Bummer gets a ton of sweep on his slider due to imparting the most efficient spin on the ball of any pitcher who has thrown at least 100 sliders:
| Name | Velo (mph) | X-Move (in) | Z-Move (in) | Spin Rate (rpm) | Spin Eff (%) | Swing% | Zone% | GB% | Chase% |
|---|---|---|---|---|---|---|---|---|---|
| Aaron Bummer | 59.6 | 82.9 | 16.5 | 43.4 | 100 | 74.7 | 0.0 | 100 | 99.5 |
The horizontal movement is almost at the 83rd percentile despite the pitch placing in about the 43rd percentile in spin rate. This is a function of that unparalleled spin efficiency, which is the percent of spin imparted on the ball that is transverse (i.e. subject to the Magnus force). For those who are curious, I received the code from Max Bay for this calculation, who decomposed the spin efficiency Excel workbook from Alan Nathan. I touched on the swing and chase rates, but Bummer also has the best groundball rate among all sliders (80.0% of all batted balls against).
Bummer has not been afraid to break out the slider against batters of either handedness. His overall usage of the pitch is 25.5%, 25.3% against righties and 25.8% against lefties. About two thirds of his pitches to any batter are sinkers and the rest of the time he sprinkles in a cutter. Bummer leans heavily on the slider with two strikes, part of the reason he has been so prolific in generating swings, but also rarely throws it in the zone:
| Pitch | 0-0 | 0-1 | 0-2 | 1-0 | 1-1 | 1-2 | 2-1 | 2-2 | 2-0 | 3-0 | 3-1 | 3-2 |
|---|---|---|---|---|---|---|---|---|---|---|---|---|
| FC | 14.3 | 23.4 | 6.2 | 5.5 | 5.0 | 2.1 | 15.4 | 2.1 | 0.0 | 0.0 | 0.0 | 0.0 |
| SI | 81.2 | 51.6 | 9.4 | 89.1 | 75.0 | 20.8 | 76.9 | 42.6 | 100 | 100 | 100 | 78.9 |
| SL | 4.5 | 25.0 | 84.4 | 5.5 | 20.0 | 77.1 | 7.7 | 55.3 | 0.0 | 0.0 | 0.0 | 21.1 |
| Player | 0-0 | 0-1 | 0-2 | 1-0 | 1-1 | 1-2 | 2-1 | 2-2 | 3-2 | 2-0 | 3-0 | 3-1 |
|---|---|---|---|---|---|---|---|---|---|---|---|---|
| Aaron Bummer | 40.0 | 43.8 | 25.9 | 66.7 | 44.4 | 18.2 | 100 | 12.5 | 0 | NA | NA | NA |
| Rest of Majors | 49.1 | 41.9 | 29.2 | 51.6 | 47.4 | 34.2 | 51.8 | 42.9 | 52.4 | 51.9 | 57.4 | 55.4 |
Compared to the rest of the league, Bummer gets about 11% more chases with the slider in 0-2 counts, 34% more chases in 1-2 counts, 12% more in 2-2 counts, and an astounding 102.4% more chases in 3-2 counts. The degree to which Bummer’s slider is an outlier is almost incomprehensible. There is a seemingly endless number of statistical oddities associated with Bummer’s slider.
To contextualize how much of an outlier the pitch is in one tidy analysis, I will turn to a tool I used in my piece on Emmanuel Clase’s cutter: principal component analysis. For those who missed the piece, I described it as follows:
“Principal component analysis is a method by which an analyst can take columns of numeric data and squeeze it down to strip out any collinearities, parsing through complicated relationships between parameters. It is often used to reduce the dimensionality of large datasets when feeding that data into predictive models, but it can also be leveraged for exploring a dataset and visualizing outliers in that dataset. The first two dimensions (i.e. the variable outputs from the principal component analysis) account for the most variance in the dataset.”
This time I took the bevy of slider characteristics I showed in the table with Bummer’s percentile rankings and threw them in a PCA themed blender for all pitchers with at least a 20% swinging strike rate for their sliders (I had to cut down the number of pitchers to make a future chart legible). Here is how the data with reduced dimensionality would appear on a two-dimensional map of the first two principal components:

I added the standard deviation of spin efficiency to incorporate how consistent a pitcher was in imparting spin with his slider. As one can see, spin rate, spin efficiency and horizontal movement have a ton of collinearity, as do vertical movement, zone rate and the swing-based metrics. Now keep the above visualization in mind and check out where Bummer places when compared to his pitching brethren (you may need to view the image in a new tab):
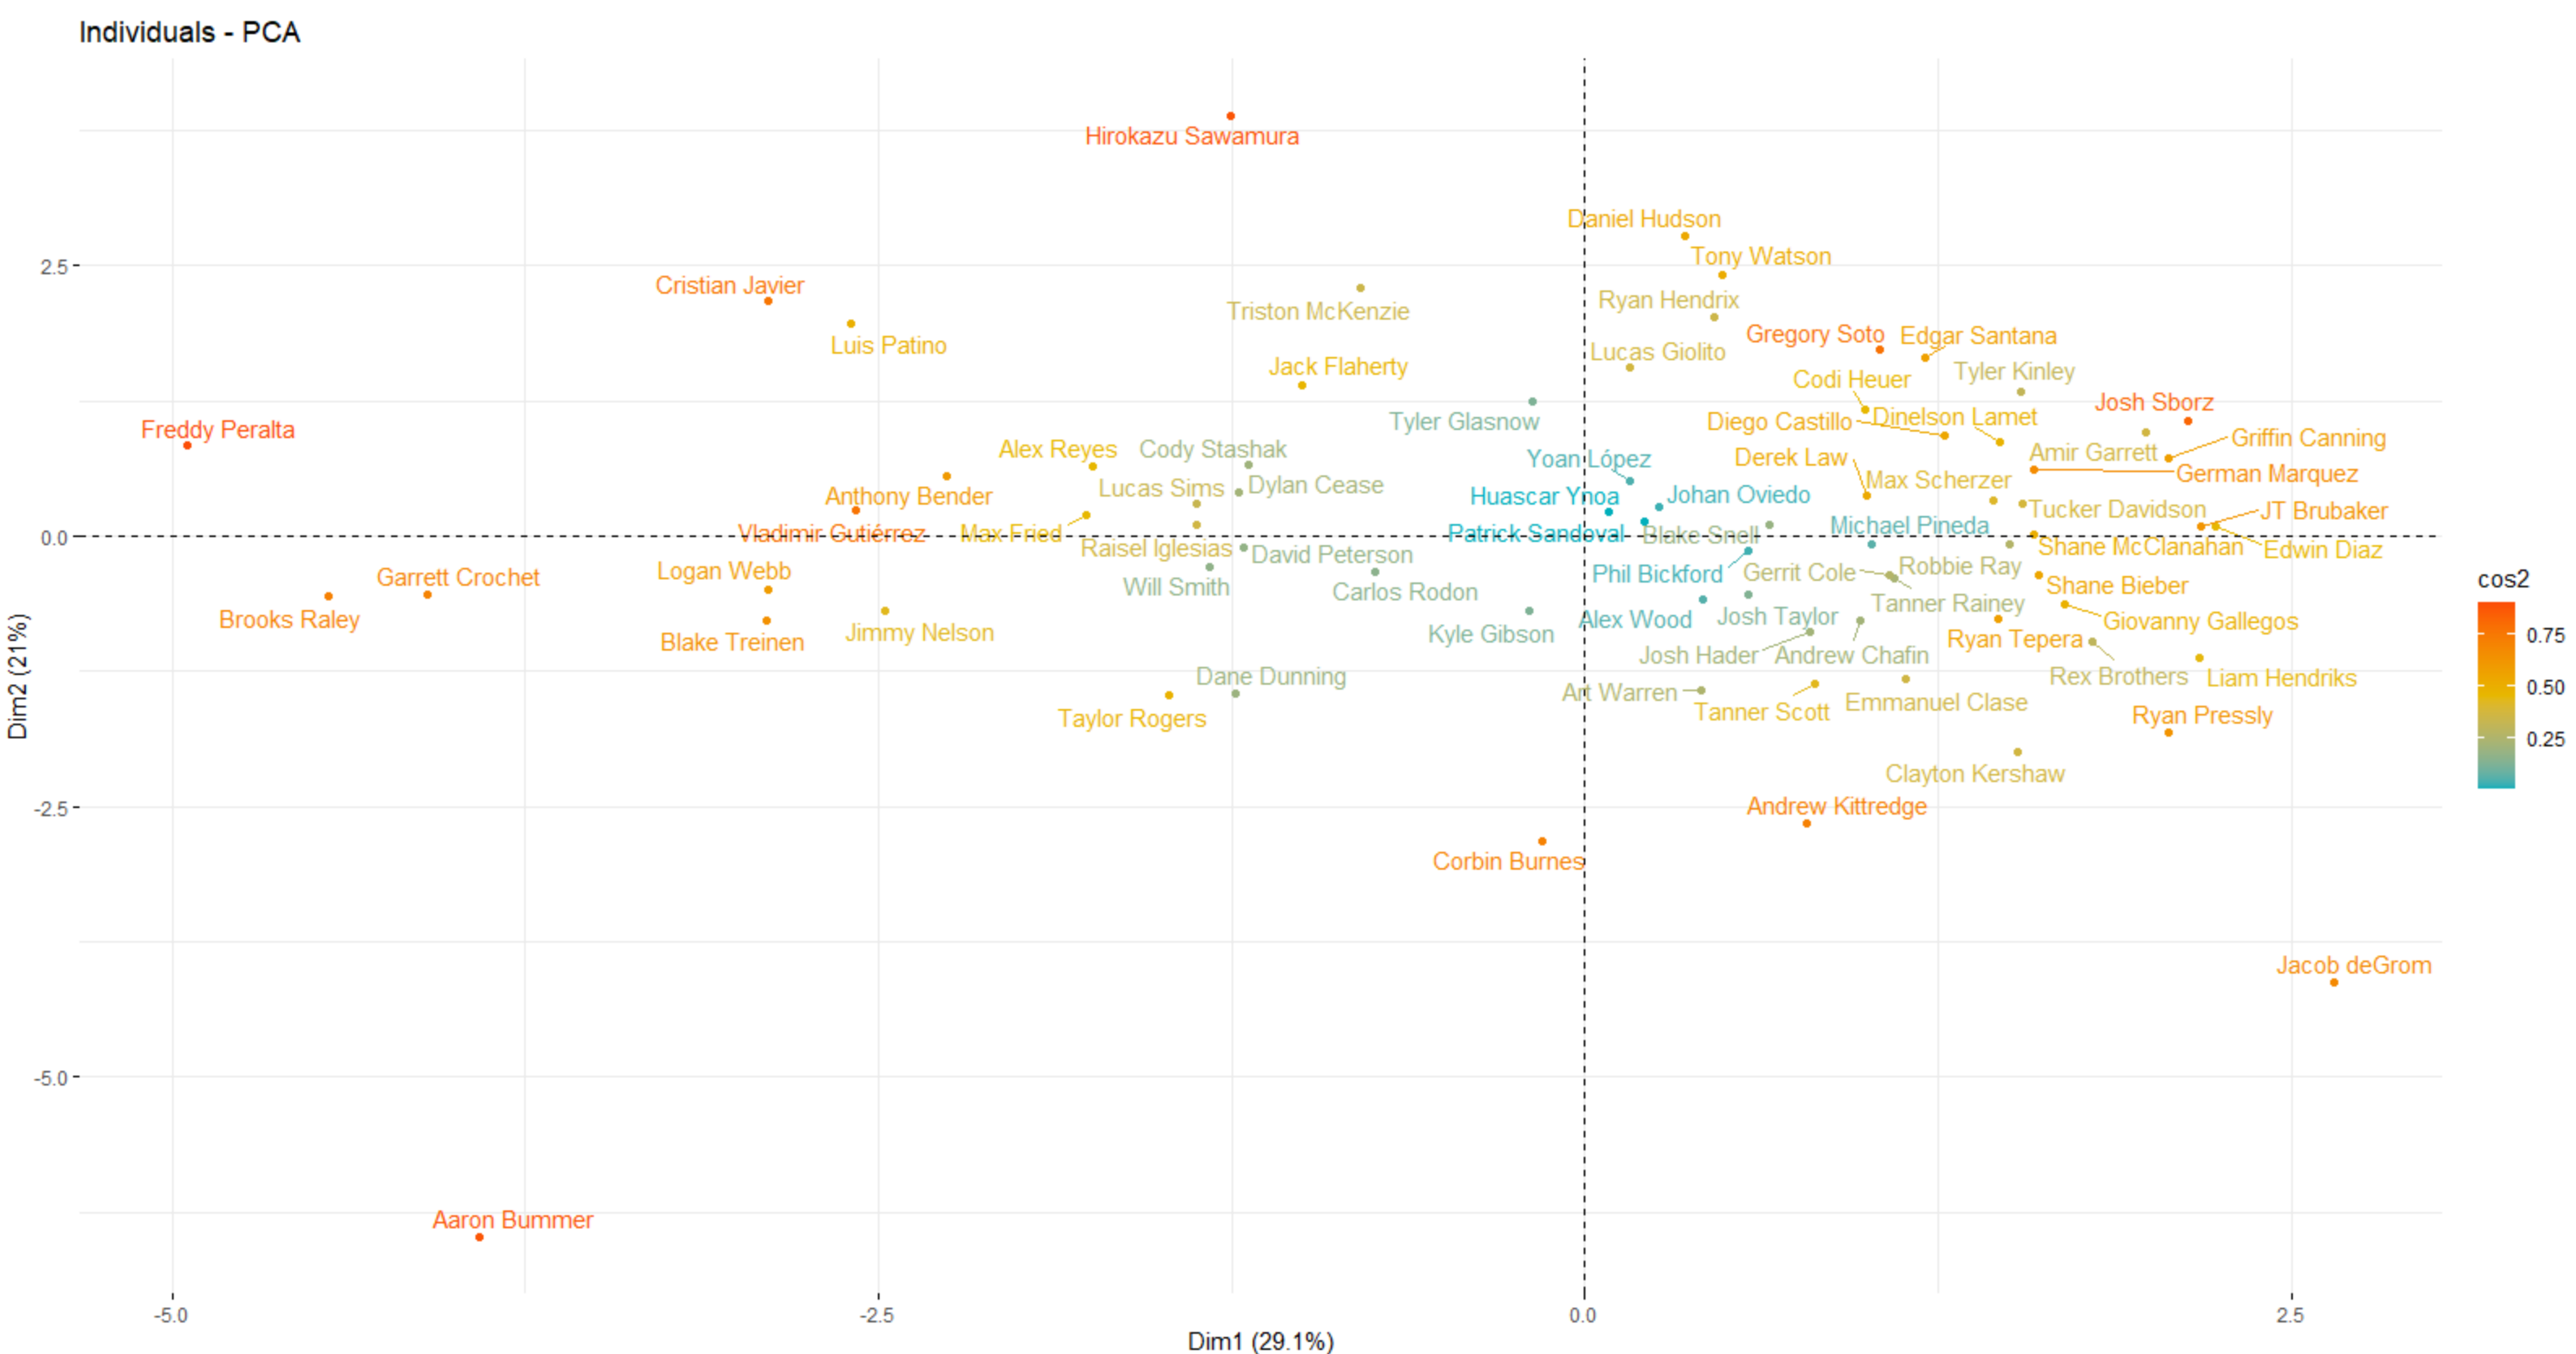
I mean, to the degree to which a principal component analysis can be funny (which, to be clear, is low), this is hilarious. There is no one slider in the realm of Bummer’s. The swing-based statistics are most like deGrom’s and Burnes’ but when you also consider the shape, Bummer is peerless.
The natural question surrounding all of this is that of sustainability. Can Bummer really continue to get batters to swing at more than half of his sliders and chase more than half of his sliders outside of the strike zone when he throws the pitch in the zone less than 27% of the time? The short answer is sort of, but not to this degree.
I queried every season in the Statcast era where a pitcher threw his slider at least 100 times before and after the start of July (I figured the time cutoff was close enough to where we are in the calendar now and it was easy to code). I looked at pitchers who threw their sliders in the strike zone at most 30% of the time before July. This consisted of 24 pitcher seasons. From July onward, they threw their sliders in the strike zone 6.6 percentage points more than before with a corresponding increase in swing rate of 2.0 percentage points. So, batters actually swung more, but when you account for how much more often they threw in the strike zone, I would say hitters became more patient. Oddly enough, the chase rate only shifted by a few hundredths of a percentage point, which bodes well for Bummer. And finally, these pitches lose about a tick (0.9 percentage points) on their swinging strike rate after July, which makes sense given a higher proportion of swings are coming on pitches in the zone after July.
Bummer has become more than just a groundball pitcher. He has parleyed his excellent sinker with an even more devastating slider to become a premier strikeout artist from the left side. The combination of a bowling sinker leading to groundballs and a sweeping slider that hitters cannot seem to help themselves from swinging at has turned him in to one of the best relievers in the majors and a key cog in a club with World Series aspirations. As the calendar turns to October, the White Sox will look to make a deep playoff run and one of the keys will be shutting down the opposition in high-leverage spots. Aaron Bummer will be among those who take the mound in those spots. Chances are, you will see him strike out a few high-profile hitters with a slider way out of the strike zone.
Carmen is a part-time contributor to FanGraphs. An engineer by education and trade, he spends too much of his free time thinking about baseball.
Bummer previously used a ‘cutter’ to complement the sinker. The problem with his arsenal is that his stuff moves maybe too much— while guys are getting horrible outcomes when they do swing, he’s had walk issues this season and last, up to over 5 BB/9 this year. If that improves, Bummer could put up a really notable reliever season.