Author Archive

American League First Basemen Aren’t Good

Debates about All-Star selections are generally pretty fleeting. The selections are announced, there’s maybe a week’s worth of complaints, then the game, then the sport is overwhelmed by the trade deadline and ensuing pennant races. That said, one of the complaints that pops up is that every team gets an All-Star and more deserving players are left home while less-deserving players on bad teams are selected for the game. This year, Salvador Perez might be one such selection. Perhaps Yan Gomes might have been more worthy. It isn’t just teams needing to send at least one player that can result in potentially deserving candidates failing to make the squad. The nature of the game itself, pitting the American League against the National League, brings about a similar issue.

Take Mitch Moreland, for example. Moreland has a 134 wRC+ and a solid 1.5 WAR in 269 plate appearances on the season. He’s arguably the best first baseman in the American League this year and therefore deserving of his place at the All-Star Game. On the other side of the coin, here are the top qualified first basemen in baseball this season ranked by WAR.

Best First Basemen of the First Half
Name Team PA HR wRC+ WAR
Freddie Freeman Braves 399 16 152 3.6
Paul Goldschmidt D-backs 394 20 148 3.3
Brandon Belt Giants 323 13 146 3.0
Jesus Aguilar Brewers 285 23 162 2.8
Matt Carpenter Cardinals 356 17 137 2.8
Joey Votto Reds 398 9 140 2.7
Cody Bellinger Dodgers 364 17 119 2.0
Matt Olson Athletics 373 19 117 1.7
Carlos Santana Phillies 381 14 114 1.3
Jose Martinez Cardinals 339 13 129 1.1

Freddie Freeman is having a great year, with Paul Goldschmidt, Brandon Belt, Jesus Aguilar, Matt Carpenter, and Joey Votto all relatively close. We could remove Carpenter given that he’s started more games at third base, but it doesn’t change the overriding theme of National League superiority at first base. Of those top five players, just two have been named to the All-Star Game. Jose Abreu is a good player having a bad year and was voted in the by the fans. Moreland isn’t even on this list because he hasn’t qualified for the batting title because he was splitting time with Hanley Ramirez early on and gets some days off against lefties.

The only AL player on the list above is Matt Olson. The A’s first baseman has a 117 wRC+, which is solid, but it is lower than the average of all NL first basemen this season. The list of first basemen in the AL only includes two players (three if you count Niko Goodrum) on pace for above-average seasons.

AL First Basemen
Name Team PA HR wRC+ WAR WAR/600 PA
Matt Olson Athletics 373 19 117 1.7 2.7
Mitch Moreland Red Sox 269 11 134 1.5 3.3
C.J. Cron Rays 351 17 119 1.1 1.9
Justin Smoak Blue Jays 340 12 123 0.9 1.6
Niko Goodrum Tigers 256 8 112 0.9 2.1
Yonder Alonso Indians 315 13 107 0.9 1.7
Yulieski Gurriel Astros 310 6 116 0.8 1.5
Ronald Guzman Rangers 228 8 104 0.7 1.8
Joey Gallo Rangers 345 21 95 0.6 1.0
John Hicks Tigers 248 8 109 0.6 1.5
Joe Mauer Twins 251 2 100 0.4 1.0
Jose Abreu White Sox 378 12 105 0.2 0.3
Ryon Healy Mariners 295 18 104 -0.1 -0.2
Logan Morrison Twins 291 10 77 -0.3 -0.6
Albert Pujols Angels 355 13 89 -0.3 -0.5
Luis Valbuena Angels 254 9 67 -0.4 -0.9
Neil Walker Yankees 202 2 51 -0.8 -2.4
Chris Davis Orioles 300 9 38 -2.0 -4.0

As a whole, first basemen are having their worst season in the American League in more than 50 seasons.

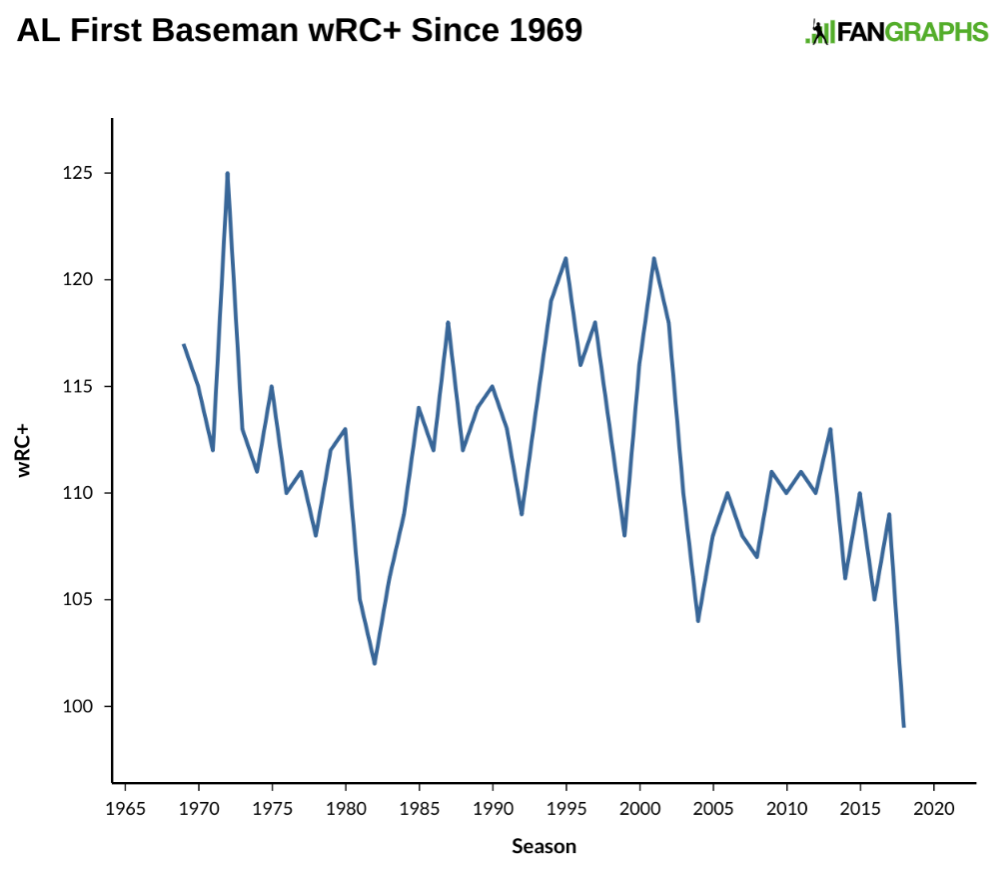
The 99 wRC+ for AL first basemen is perfectly acceptable as an average offensive player, but because first base is generally the easiest position to play on the diamond, the standards are generally higher for the bat. American League first basemen haven’t finished a season below average at the plate since 1957, and the only other time it has happened in the last 100 years was in the 1948 season. As the graph above shows, they are generally comfortably above average, with only the 1982 season getting close. As the season wears on, first basemen should start performing a bit better than they have, but right now they are nowhere close to the top of the pecking order by position.

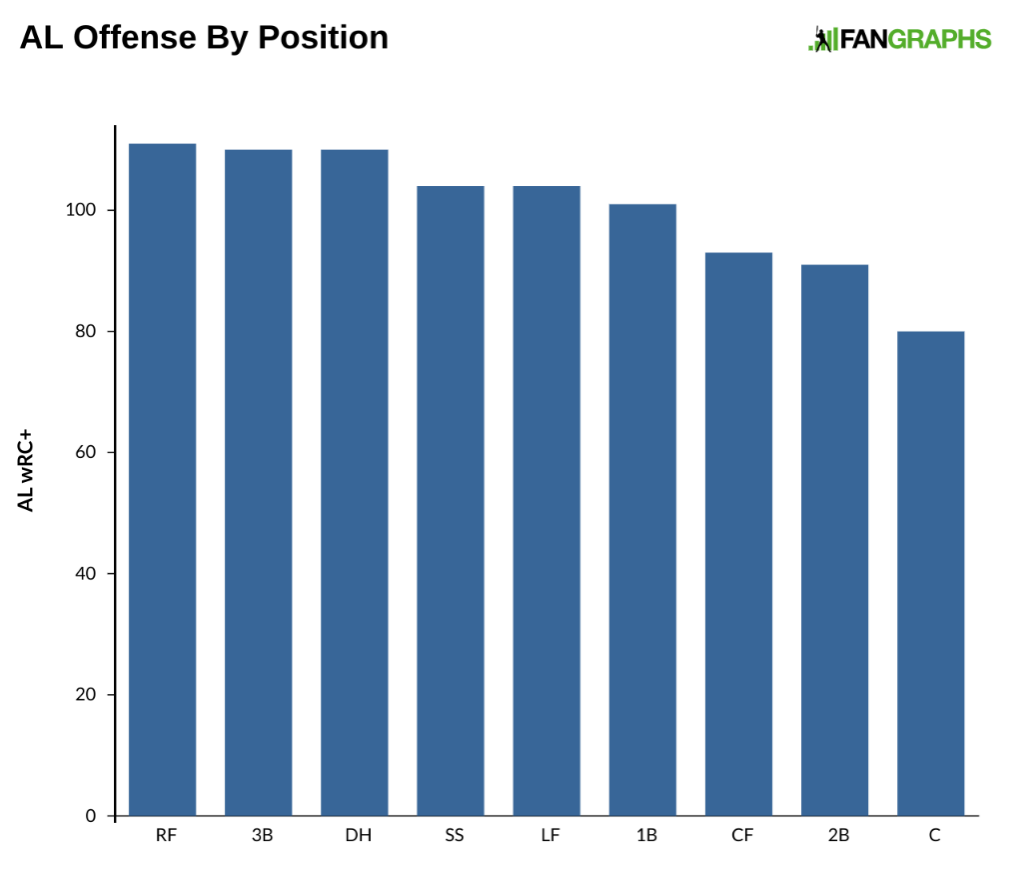
First basemen are actually in the bottom half of the league. The caliber of shortstop play is tremendous and third basemen are doing great as well, but first basemen really shouldn’t be this bad. It’s clearly not an MLB-wide issue, as their NL brethren are having no such problem carrying up the average enough to be pretty close to historical norms. It might be fun to lay the blame on Chris Davis, but first basemen would still be only slightly above average on the season without Davis’ contributions, if you want to call them that.

I checked among the designated hitters to see if the league was missing some good ex-first basemen that might be skewing the results, but all the top DHs this season — J.D. Martinez, Nelson Cruz, Shin-Soo Choo, Giancarlo Stanton, and Khris Davis — are converted outfielders. The converted first basemen are either barely above average (Edwin Encarnacion) or well-below (Albert Pujols, Logan Morrison). A quick look at last year’s AL first basemen shows some drain over to the NL, but mostly these are just poor performances from good players mixed in with a bunch of players not expected to do all that well.

2017 AL First Basemen
Name Team PA HR wRC+ WAR
Jose Abreu White Sox 675 33 138 4.2
Eric Hosmer Royals 671 25 135 4.1
Justin Smoak Blue Jays 637 38 132 3.5
Logan Morrison Rays 601 38 130 3.2
Carlos Santana Indians 667 23 117 3.0
Joey Gallo Rangers 532 41 123 3.0
Yonder Alonso – – – 521 28 132 2.4
Joe Mauer Twins 597 7 116 2.2
Chase Headley Yankees 586 12 104 1.9
Yulieski Gurriel Astros 564 18 118 1.7
Trey Mancini Orioles 586 24 117 1.7

Hosmer and Santana are now in the NL, though Hosmer isn’t playing all that well. Smoak is having a decent season, but the rest of the players are not, nor are they expected to do well the rest of the year. A quick look at our projections will tell you, it isn’t just first-half performance that seems to indicate the balance of power is in the NL, as our best estimate of talent says the same thing.

First Baseman Projected wOBA
Name Team PA wOBA
Joey Votto Reds 288 .395
Freddie Freeman Braves 293 .392
Paul Goldschmidt D-backs 288 .386
Anthony Rizzo Cubs 294 .375
Brandon Belt Giants 242 .363
Matt Carpenter Cardinals 284 .362
Eric Thames Brewers 241 .361
Carlos Santana Phillies 282 .360
Cody Bellinger Dodgers 268 .357
Steve Pearce Red Sox 76 .353
Jose Abreu White Sox 283 .351
Justin Smoak Blue Jays 290 .347
Matt Olson Athletics 279 .345
Jose Martinez Cardinals 284 .345
Matt Adams Nationals 80 .343
Yonder Alonso Indians 290 .343
Joey Gallo Rangers 266 .342
Jesus Aguilar Brewers 241 .342
Justin Bour Marlins 259 .341
Mitch Moreland Red Sox 239 .338
Blue=NL, Red=AL

American League first basemen aren’t always going to be this bad, but they have been so far this season. This is just a weird time in the cycle for the position, probably not helped by the lack of competition for playoff spots in the league compared to the NL. Many might be up in arms over Jesus Aguilar or Brandon Belt not making the All-Star team. It isn’t that they aren’t deserving of a spot as one of the top-60 or so players in baseball, or one of the top six players at their position. They just happen to play in the wrong league.


The Royals Should Trade Whit Merrifield

What does Whit Merrifield see in the gauzy mists of his future?
(Photo: Minda Haas Kuhlmann)

Whit Merrifield is a pretty good baseball player. Despite not debuting in the majors until his age-27 campaign and recording 1,700 roughly average plate appearances in Double-A and Triple-A before that, Merrifield has now produced two seasons’ worth of above-average offense at the major-league level. His 5.3 WAR ranks seventh among all second baseman since the start of last season. The 120 wRC+ he’s recorded this year is surpassed only by the marks produced by Jose Altuve and Jed Lowrie among AL second baseman. And while that’s his primary position, he has also played first base, center field, and right field this year and does have some experience at third base and left field, as well.

That combination of offensive skill and defensive flexibility makes Merrifield the sort of player who can fit on a number of clubs. It’s also what makes him appealing as a possible trade-deadline target for contenders. The Royals have a piece from which other clubs should benefit. They should make every effort to find a deal that makes sense.

Merrifield’s appeal isn’t limited to his performance. Because of his late start as a major leaguer, he won’t even be eligible for arbitration until 2020 and won’t be a free agent until after the 2022 season. Those extra years typically add considerable weight to trade value, allowing clubs to avoid wading out into the expensive free-agent waters.

Also due to Merrifield’s late start, however, the prospect of his cost-controlled years is a bit different than for other, similarly experienced (or inexperienced) players. While his league-minimum salaries for this year and next are appealing, Merrifield is likely to have entered his decline phase for the last three of his cost-controlled seasons. Cost-controlled seasons can be a great benefit to a team, but most of that theoretical benefit is based on a player still in his prime and potentially even improving. Players can get better in their early 30s — Jeff Kent and Daniel Murphy come to mind as prominent examples of second basemen alone — but age-related decline is the rule not the exception.

To get a sense of how Merrifield might age, I looked for second baseman since 1995 at 28 and 29 years old with a WAR between 5.0 and 8.0 and age-29 WAR between 2.5 and 5.0. Note that this analysis doesn’t account for the fact that Merrifield was a mostly mediocre minor leaguer, but instead focuses on his good run over the last two years.

At age 30, the 12 players who fit the above criteria averaged a solid 107 wRC+ and 2.8 WAR. At age 31, they experienced a typical move downward, to a 103 wRC+ and 2.2 WAR. By age 32, only half the players recorded more than 2.0 WAR and, at age 33, the only players to surpassed the 1.5 WAR threshold were Kent, Ray Durham, and Eric Young.

Read the rest of this entry »


Has Ditching the Sinker Worked for Pitchers?

Earlier this year, Travis Sawchik urged baseball fans to go see the two-seamer before it’s gone. A year ago, Alex Stumpf discussed the death of the sinker. Over the years, pitchers have chosen to de-emphasize a sinking fastball, instead opting for breaking pitches and four-seamers. The sinker has never been a swing-and-miss pitch, and as pitchers have gotten better, they’ve been more able to utilize offerings more likely to lead to a strikeout. While the change has been a gradual one overall, there are a certain number of pitchers every season who make dramatic changes to contribute to the downward trend.

Last season, 55 of the 134 pitchers with at least 100 innings threw a sinker at least 25% of the time. This season, the number of pitchers throwing a sinker that often has dropped by nine percentage points, pretty clear evidence of the sinker decline. Let’s focus in on the sinkerballers from a year ago. This season, 36 of the 55 sinker-throwers from a year ago have pitched at least 50 innings this season. Nearly half of those pitchers have dropped their sinker use by at least four percentage points and nearly one quarter have dropped usage by more than 10 percentage points.

Read the rest of this entry »


Did Jon Gray Deserve His Demotion to the Minors?

In one sense, Jon Gray’s 2018 season has been pretty successful. He’s struck out 29% of the batters he’s faced this year, for example, which ranks 12th among 90 qualified starters. His walk rate, at 7%, sits in the top third for starters. His home-run rate of 1.1 per nine innings is right in the middle of the pack among that sample, too, as are his 92 innings.

That’s he’s done of his work at elevation in Colorado makes those numbers even more impressive. His 3.07 FIP has produced a 2.5 WAR, one of the top 15 figures in baseball. Unfortunately, the Rockies haven’t received the benefit of that good pitching. In fact, Gray’s 5.77 ERA ranks 88th out 90 starters. The massive difference between his ERA and FIP would represent the largest such disparity in baseball history, and it was of sufficient concern to the Rockies to send Gray to Triple-A.

Not too long ago, Jay Jaffe wrote a piece on Jon Lester, whose season was also busting historical norms. Lester’s ERA was significantly lower than his FIP. So far this season, Gray is Lester’s opposite. The graph below shows every pitcher’s FIP and ERA this season.

You can see Jon Lester over there on the left on his own. If you go to the right, you can see Jon Gray with nobody even close to him. It should be evident that, in the middle, most players are reasonably close when it comes to ERA and FIP. The average differential per player 0.53. Of the 88 ERA and FIP pairs in this sample, 77 are within one run. So far this season, Gray’s 2.69 ERA-FIP is roughly double the player closest to him, as the table below shows.

Biggest ERA-FIP Gaps, 2018
Name Team ERA FIP E-F
Jon Gray Rockies 5.77 3.08 2.69
Jason Hammel Royals 5.56 4.20 1.37
Lance Lynn Twins 5.49 4.37 1.12
Sonny Gray Yankees 5.44 4.39 1.05
Nick Pivetta Phillies 4.71 3.68 1.03
Luke Weaver Cardinals 5.16 4.22 0.93
Vince Velasquez Phillies 4.69 3.81 0.87
Luis Castillo Reds 5.85 5.03 0.82
Carlos Carrasco Indians 4.24 3.42 0.82
Zack Wheeler Mets 4.47 3.66 0.80
Qualified starting pitchers.

That isn’t just remarkable for this season. Since 1901, here are the biggest differences among qualified pitchers.

Largest ERA-FIP Since 1901
Name Team Season ERA FIP E-F
Jon Gray Rockies 2018 5.77 3.08 2.69
Jack Knott Browns 1936 7.29 5.16 2.12
George Caster Athletics 1940 6.56 4.52 2.04
Hub Pruett Phillies 1927 6.05 4.11 1.94
Chris Bosio Brewers 1987 5.24 3.38 1.86
John Burkett Rangers 1998 5.68 3.89 1.78
Bert Blyleven Twins 1988 5.43 3.66 1.77
Joe Oeschger Braves 1923 5.68 3.91 1.77
Ernie Wingard Browns 1927 6.56 4.80 1.76
Bobo Newsom – – – 1942 4.73 2.99 1.74
Ricky Nolasco Marlins 2009 5.06 3.35 1.71
Early Wynn Senators 1942 5.12 3.42 1.70
Jack Lamabe Red Sox 1964 5.89 4.21 1.68
Rick Wise Phillies 1968 4.55 2.89 1.66
Pol Perritt Cardinals 1913 5.25 3.59 1.66
Qualified starting pitchers.

There are a few Hall of Famers on that list in Blyleven and Wynn, but nobody comes close to what Gray has done thus far. Just to get a few more familiar names, here’s the same list since 1995.

Largest ERA-FIP Since 1995
Name Team Season ERA FIP E-F
Jon Gray Rockies 2018 5.77 3.08 2.69
John Burkett Rangers 1998 5.68 3.89 1.78
Ricky Nolasco Marlins 2009 5.06 3.35 1.71
Jaime Navarro White Sox 1997 5.79 4.21 1.59
Jose Mercedes Orioles 2001 5.82 4.32 1.51
LaTroy Hawkins Twins 1999 6.66 5.16 1.50
Edinson Volquez – – – 2013 5.71 4.24 1.47
Nate Robertson Tigers 2008 6.35 4.99 1.36
Derek Lowe Braves 2011 5.05 3.70 1.35
Clay Buchholz Red Sox 2014 5.34 4.01 1.33
Jose Jimenez Cardinals 1999 5.85 4.53 1.32
Zack Greinke Royals 2005 5.80 4.49 1.31
Mike Oquist Athletics 1998 6.22 4.93 1.30
Qualified starting pitchers.

There are some good pitchers on this list, too, including Zack Greinke. The odds are against Gray maintaining such a high difference. With half a season to go, Gray’s ERA is likely to be considerably closer to his FIP moving forward. If, the rest of the way, Gray’s FIP is one run lower than his ERA like it was in 2016, his ERA will end up right around Chris Bosio’s 1.86 number from 1988. If Gray’s ERA is half a run higher than his FIP like it was last year, he’ll end up with something close to Jaime Navarro’s 1.59 from 1997 and not even crack the top-15 all-time.

As we are getting close to the All-Star Break, it might be useful to take a look at the biggest half-season differences from our splits leaderboards, which go back to 2002. Here are the biggest first-half differences for pitchers with at least 70 first-half innings.

Largest ERA-FIP by Half Since 2002
Name Team Season 1st Half IP 1st Half ERA 1st Half FIP 1st Half ERA-FIP
Glendon Rusch MIL 2003 82.1 8.09 4.38 3.71
Jon Gray COL 2018 92.0 5.77 3.08 2.69
Tim Lincecum SFG 2012 96.2 6.42 4.01 2.42
Ubaldo Jimenez BAL 2016 79.1 7.03 4.63 2.40
Zack Greinke MIL 2011 74.1 5.45 3.05 2.40
Colby Lewis TEX 2014 84.0 6.54 4.17 2.37
Ricky Nolasco FLA 2009 90.2 5.76 3.56 2.20
Jake Arrieta BAL 2012 101.1 6.13 4.04 2.09
Edwin Jackson TBD 2007 74.1 7.26 5.19 2.07
John Lackey BOS 2011 79.0 6.84 4.84 2.00
Manny Parra MIL 2009 71.2 6.78 4.80 1.98
Ryan Dempster CIN 2003 96.0 6.75 4.78 1.97
Sidney Ponson BAL 2004 113.0 6.29 4.35 1.94
Edinson Volquez SDP 2013 109.2 5.74 3.85 1.89
AVERAGE 89.0 6.54 4.28 2.26
Min. 70 IP

That was quite a performance from Glendon Rusch. He would actually go on to have a couple productive seasons as a Cubs swingman, but 2003 might have soured the Brewers on his future. Scanning the list for similar performances to Gray, another Brewer, Zach Greinke, sticks out with a near-identical FIP to Gray this season. As the average indicates, we have roughly average to maybe below-average pitchers by FIP accompanied by horrendous ERAs. The next table shows how those players performed in the second half.

Second-Half Performance for Largest ERA-FIP
Name Team Season 1st Half FIP 1st Half ERA-FIP 2nd Half IP 2nd Half ERA 2nd Half FIP 2nd Half ERA-FIP
Glendon Rusch MIL 2003 4.38 3.71 18.0 4.00 2.14 1.86
Tim Lincecum SFG 2012 4.01 2.42 89.1 3.83 4.36 -0.53
Ubaldo Jimenez BAL 2016 4.63 2.40 52.2 2.39 3.60 -1.21
Zack Greinke MIL 2011 3.05 2.40 97.1 2.59 2.92 -0.33
Colby Lewis TEX 2014 4.17 2.37 86.1 3.86 4.75 -0.89
Ricky Nolasco FLA 2009 3.56 2.20 94.1 4.39 3.15 1.24
Jake Arrieta BAL 2012 4.04 2.09 0.0 0.00
Edwin Jackson TBD 2007 5.19 2.07 86.1 4.48 4.62 -0.14
John Lackey BOS 2011 4.84 2.00 81.0 6.00 4.58 1.42
Manny Parra MIL 2009 4.80 1.98 68.1 5.93 4.96 0.97
Ryan Dempster CIN 2003 4.78 1.97 16.2 6.48 6.63 -0.15
Sidney Ponson BAL 2004 4.35 1.94 102.2 4.21 4.54 -0.33
Edinson Volquez SDP 2013 3.85 1.89 59.2 5.73 4.98 0.75
AVERAGE 4.28 2.26 66.0 4.49 4.27 0.20
Min. 70 IP.

As we might expect, the players’ first-half FIPs line up pretty well with their second-half FIPs. What’s interesting is that the second-half ERAs also line up pretty well with the FIPs from both the first and second halves. While this is what we would expect to see, it’s nice to have it show up so neatly.

One problem the above doesn’t solve is why Gray’s FIP, specfically, is so much lower than his ERA. A portion of the responsibility goes to his home park. Pitchers routinely post higher ERAs than FIPs in Coors Field because BABIP is a lot higher in Coors Field. Balls in play are not incorporated into FIP, so larger swings, like the one we see at Coors Field, are going to drive up ERA a bit. That only explains a very small portion of Gray’s differential, though. For the rest, please see the graph below depicting BABIP and left-on-base percentages for all qualified starting pitchers.

Previous research indicates that a vast majority of the difference between FIP and ERA is due to two factors, the two stats seen in the table above: BABIP and LOB%. Gray is the worst in both, about 50 points clear in BABIP and with few peers in LOB% this season.

A really poor BABIP might be an indicator that Gray is no longer an MLB-caliber pitcher. The rest of his stats say otherwise, however. Per Baseball Savant, his expected BABIP is about 50 points lower than his actual figure. As league-wide expected BABIP is about 20 points higher than actual BABIP, even once you factor in Coors Field, Gray’s BABIP is about 50 points too high based on the quality of contact, leaving the rest to luck and defense.

As for left-on-base percentage, if it were really high, we might think that perhaps Gray has trouble pitching with runners on base and that Gray’s 1.91 FIP with bases empty compared to 4.67 with runners on — and his .274 xwOBA with bases empty compared to .334 with runners on — speaks to the same issue. However, the latter number is roughly average for the league regarding xwOBA and pretty close to average for FIP once Coors Field is factored in. Jeff Zimmerman theorized that the issue might be pitching meatballs behind in the count, but even Gray’s numbers behind in the count are similar to an average pitcher in those situations. His velocity has been down in his last few starts. Ben Lindbergh noted the absence of competitive pitches from Gray this season. However, none of those theories explains a league-worst left-on-base rate or the massively high BABIP. The Rockies would have to keep Gray in Triple-A the rest of the season to game his service time, so that is an unlikely motivation, although if he hits the disabled list in the minors he would not accrue MLB service time like he would if he were DL’d now and something more serious was discovered.

Jon Gray is performing historically so far, but not in the way he would like. Now he’s pitching in a city he’d probably prefer not to. Based on the past history of others, as well as himself, there seems to be a pretty good chance — absent injury — that his ERA is going to be headed downward soon even if the big-league Rockies won’t be seeing the benefit of that downturn at the moment.


This Might Not Be the Angels’ Year

In terms of playoff odds, Mike Trout gives the Angels a pretty good head start over the rest of the field every season. Where Los Angeles has had trouble over the last few years, however, is surrounding Trout with enough talent to make the postseason. They tried spending big, bringing in Josh Hamilton, Albert Pujols, and C.J. Wilson and extending Jered Weaver. That netted them exactly one playoff appearance, in 2014, when they were swept in three games. They’ve slowed down spending a bit in recent years, but made a savvy trade to bring Andrelton Simmons aboard, brought in Justin Upton and signed him to an extension, jumped on Ian Kinsler in a trade, signed Zack Cozart, and then lucked out in the Shohei Ohtani sweepstakes.

Despite what appears to be a collection of good moves, the results are still lacking. Now, news that Cozart will miss the rest of the season diminishes the Angels’ chances even further.

At the moment, there are only seven teams with at least a 5% chance at the playoffs in the American League. In the National League, there are nine teams with a similar chance. A week ago that number was 11 (sorry, Pirates and Rockies), and two weeks ago it was 12 (sorry, Mets). The National League looks very competitive this season, with a bunch of teams in the hunt and no single club possessing more than a 90% playoff probability. The American League, on the other hand, looks like this:

Four of the five playoff spots appear to be locked up, with the Mariners currently looking likely to take the final one. The pennant race is not without intrigue — the Yankees and Red Sox will battle to avoid a one-and-done Wild Card round — but Cleveland looks to be running away with the AL Central, and unless the Mariners have another gear, the Astros are going to take the West. As for the non-Yankees/Red Sox Wild Card, the Mariners have a seven-game edge over the Athletics and a nine-game lead over the Angels. If the Mariners win half the rest of their games, the Angels would need to win 50 to catch them. That’s 62% of their remaining dates, close to a 100-win pace over the course of the rest of the season.

Read the rest of this entry »


Offseason Spending on Relievers Isn’t Working Out

While this past winter moved slowly for a number of free agents, the offseason’s available relievers actually found work pretty quickly. By the time the calendar turned, 13 relief pitchers had received multi-year contracts worth more than $10 million, totaling more than $250 million overall. Addison Reed and Greg Holland would later ink deals for more than $10 million, as well. Much has been made of the fiscal restraint exercised by teams this past winter, but teams didn’t really apply that same sort of caution to reliever deals. Perhaps they should have.

In total, there were 30 deals in excess of $1 million dollars signed by relief pitchers this past offseason. With half the season having passed, it seems like an opportune moment to review how those deals are working out for the players and their clubs. Because of how relievers are typically utilized, we are necessarily dealing with small sample sizes, but that’s also just how things operate with relievers: the difference between a good and bad season might be a few rough innings.

The graph below shows WAR and the amount of guaranteed money the player signed for in the offseason.

Teams would hope that the trendline here slopes up and to the right. That would suggest a general correlation between the money received by a player and his on-field production. The graph above, however, doesn’t look anything like that. Indeed, if a slope exists at all, it goes down and to the right. And even if we omit the Rockies from it — they were responsible for the winter’s three biggest relief contracts — this graph would still pretty much look like a jumbled mess. Seven of the 11 players with more than 0.5 WAR this season signed contracts for less than $10 million total. Of the 13 relievers at replacement level or below, eight received eight-figure guarantees. There appears to be little rhyme or reason at all when it comes to money and performance.

Perhaps the total money skews things somehow. To see if that’s the case, here’s a similar graph, except with average annual value instead of total money.

Still nothing, right? It appears that way.

Read the rest of this entry »


Goldschmidt, Trout, and the Greatest Weeks of the Century

One week’s worth of at-bats isn’t going to tell you a lot about a player. Hitters can look very good or very bad for entire weeks or even months, and it doesn’t necessarily represent their talent level or tell you a whole lot about it. For example, on April 9, Shin-Soo Choo began what has been thus far the worst week of the entire season. He came to the plate 29 times and got one hit, a single, which was good for a -70 wRC+. However, on the season, he has a 134 wRC+, which is not too far from his career line. Didi Gregorius had a 336 wRC+ the second week of the season and a -66 wRC+ the second week of May. Crazy things can happen in 20-30 plate appearances, and two of the craziest stretches of this century happened in the past two weeks.

You’ve probably heard that Mike Trout has been on a roll lately. That last statement has almost always been true for the past seven seasons, but it was particularly true last week. From June 11 to June 17, Trout came to the plate 28 times. He reached base via a hit 13 times, including four homers and a double. He was walked on seven occasions and was hit by a pitch once. He struck out five times. That leaves just two occasions where Trout made contact with the ball and got out. Once he hit a sacrifice fly and once he grounded into a double play. He was not named the American League Player of the Week.

That Trout was not named Player of the Week is a surprise, but sometimes consistent greatness doesn’t get rewarded. What’s more surprising is that Trout’s week wasn’t the best offensive week of the season. More specifically, it was not even the best offensive performance this month. That honor goes to Paul Goldschmidt one week earlier. From June 4 through June 10, Goldschmidt came to the plate 29 times. He reached base via a hit 16 times, including four homers, one triple, and six doubles. He also walked three times and was hit by a pitch. He struck out four times and made an out on a ball in play six times. His 455 wRC+ narrowly edged out Trout’s 439 in a week’s time.

Read the rest of this entry »


What a Smaller Strike Zone Can Do for Pace of Play

Last week, I discussed the consequences of an expanded strike zone on the game, finding that it leads to more strikeouts and fewer balls in play. While some have suggested that a larger zone — by inviting more swings from batters — might actually result in an uptick in batted balls, the observed results don’t support that hypothesis. Whatever gains a larger zone creates in terms of swing rate, they’re negated by an increase both in whiff rate and called strikes, leading to more strikeouts overall.

What that post addressed was what would happen if the strike zone got bigger. This post attempts to answer a similar question — namely, what would happen if the strike zone got smaller?

In order to test the effects of a shrinking strike zone, it’s necessary first to identify an actual instance in which the strike zone has gotten smaller. Fortunately, such an instance exists, thanks again to the research of Jon Roegele, who produced this visual in his piece on the strike zone last year.

That’s the 2007 strike zone on the left and 2017 zone on the right. As you can see, the outside edge to lefties used to be called a lot more frequently than it is now. The bottom of the zone has gotten larger for both lefties and righties (a point addressed in my last post), and the result has been a smaller strike zone for lefties than their right-handed counterparts.

Read the rest of this entry »


What Was Marcell Ozuna Thinking?

With two outs in the bottom of the 10th inning on Monday, the Cardinals found themselves up by one run. Matt Bowman, the Cardinals pitcher, put himself in a little bit of trouble when Rhys Hoskins hit a single and then advanced to second on a groundout. Cardinals manager Mike Matheny put Bowman in considerably more trouble with the dubious decision to walk Carlos Santana and put the winning run on base in order to try for the double play. Bowman did not get the double play, instead striking out Jesmuel Valentin. That brings us to Aaron Altherr, the game’s final batter.

The win-expectancy chart provides a pretty good idea of what happened on that play.


Source: FanGraphs

If the graph doesn’t help enough, here’s a small clip of what transpired.

Marcell Ozuna dove for the ball and, by missing the catch, allowed Hoskins and Santana to score and win the game for the Phillies. Mike Matheny defended the aggressive play, because that’s what a manager is supposed to do. That doesn’t prevent us from asking the question, though: just how badly did Ozuna screw up by trying to dive for a catch he wouldn’t end up making?

Read the rest of this entry »


Jason Heyward’s Latest Change Is Making a Difference

One could argue that, during the 2015-16 offseason, Jason Heyward was my hill. If that’s the case, I am now mostly dead. After producing almost six wins in his final campaign with the Cardinals, the outfielder recorded just a lone win in each of his first two seasons with Chicago.

I say mostly dead, though, because Heyward’s bat is showing some signs of life: since coming off the disabled list a month ago, he’s hitting .307/.347/.489 with a 124 wRC+. While that represents a hot streak for the Cubs version of Heyward, it pretty closely approximates what the team probably expected from Heyward when they signed him. Whatever the case, it is the best run he has produced since the joining the team.

Heyward’s swing changes have been frequent over the past few years. He has altered his mechanics nearly every season of his career. The Cubs hoped to unlock more power out of Heyward after he posted a 121 wRC+ for the Cardinals in a 2015 campaign during which he took a bunch of walks, limited his strikeouts, ran the bases well, and exhibited slightly below-average power. The Cubs weren’t wrong to try and unearth that version of Heyward. With his defense, baserunning, batting eye, and contact skills, the addition of a bit more power might have made Heyward an MVP candidate.

Read the rest of this entry »