Author Archive

The Cubs Survived the World Series Hangover

Tonight, the Chicago Cubs begin their attempt to become the first team to repeat as champions since the New York Yankees won three in a row from 1998 to 2000. Since free agency really took hold about 40 years ago, the only other team to win consecutive titles has been Toronto in 1992 and 1993. Since integration, the A’s, Blue Jays, Reds, and Yankees are the only franchises to repeat — and the runs by Cincinnati, Oakland, and (in one case) New York all occurred in the 1970s. While parity seemingly drives the game, a repeat isn’t impossible, and the Cubs have passed the all-important first step of making the playoffs.

That’s not to say it was easy. The Cubs dug themselves a hole early this season, going 43-45 before the All-Star break, about eight wins shy of where the projections thought they’d be at that point. In the second half, however, they produced a 49-25 record, about six wins better than the projections called for. In the end, the club fell just a few games short of their preseason forecasts and made the playoffs without much trouble.

As I wrote in September, it’s hard to characterize this Cubs team as one that’s underachieved. While some have attributed the club’s early-season difficulties to a “hangover” effect from last year’s championship, there’s not much evidence that the club actually underperformed reasonable expectations, receiving strong campaigns from a number of their stars and good production from unexpected sources. There’s also little evidence that World Series hangovers exist in the first place.

More on that second point in a moment. First, let’s consider the team’s most important players. We begin with Kris Bryant. The Cubs’ third baseman might not be clutch, but he recorded his third consecutive season of six wins or better, finishing sixth in the majors by WAR. And about his clutch performance: while it might be fair to say he hasn’t been clutch, that’s obvious different than being clutch. Keep in mind that the 150 wRC+ Bryant has recorded in low- and medium-leverage situations has occurred over 1,801 plate appearances; the 87 wRC+ he’s produced in high-leverage situations, meanwhile, is the result of just 213 plate appearances.

A sample of 213 PAs is obviously subject to considerable variation. For example, did you notice when, in the 197 regular-season plate appearances between September 2 of last year and April 23 of this one, that Bryant recorded an 82 wRC+? Probably not. (Especially since he recorded a 148 wRC+ in the middle of it during last year’s postseason.) Those 197 PA where Bryant wasn’t so good obviously don’t represent his real talent level. They occurred over an interval of two different seasons and he actually played well in the middle of that span. So naturally, if those somehwat disjointed 200-or-so plate appearances don’t reflect the real Bryant, it’s possible that the other 200-or-so high-leverage plate appearances — spread out over three years and inclusive only of regular-season play — likely don’t, either. Probably best not to make a big deal over them.

Read the rest of this entry »


Players to Root for in the Playoffs

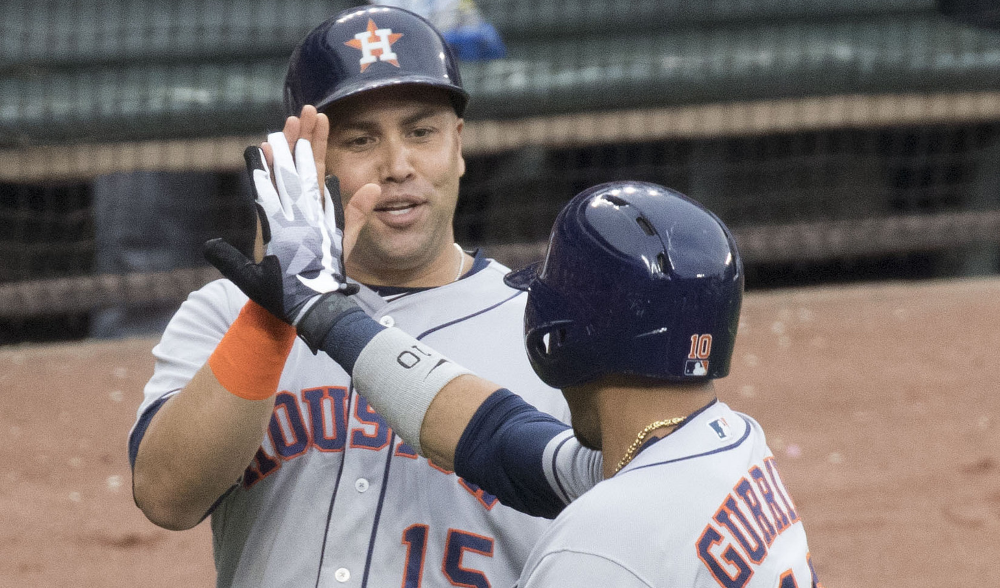
No player in the postseason has more career wins without a title than Carlos Beltran.
(Photo: Keith Allison)

For fans of 10 (and soon to be eight) teams, finding a club for which to root in the playoffs presents little difficulty: just keep doing what you’ve been doing for the last six months. For the rest of us, though, manufacturing some interest in a team or two can be a useful device for cultivating drama in the postseason.

There are a few ways to go about this, of course. For some, the solution is just as simple as rooting against a rival. For others, supporting a team with lengthy curse or championship drought — like the Red Sox or Cubs in recent years or Cleveland, still, this season — might make sense. Backing an underdog is always popular, obviously, as is pulling for all the small-market teams to beat the larger-market ones. There’s no wrong way to do this. What I’d like to discuss here is another alternative, though — namely, rooting for a specific player.

Perhaps you’ve been already been doing this in some capacity. There’s a player who maybe used to play for your favorite team or one whom you always wished would wear your team’s uniform. For me, the easy answer in year’s past has been Adrian Beltre. He’s a future Hall of Famer and a joy to watch. Add in that he was oh-so-close to a title in 2011, and it’s easy to actively support a scenario in which Beltre finally gets a ring. The Rangers failed to qualify for the playoffs this year, though, so rooting for Beltre isn’t an option.

While the Rangers third baseman will be absent from the postseason, there are a handful of other future Hall of Famers who have yet to win a World Series title and will be playing games that count this October.

Read the rest of this entry »


What Statcast Says About the National League Cy Young

Over in the American League, there’s a clear two-horse race between Chris Sale and Corey Kluber for the Cy Young Award. Both are head and shoulders above the rest of the league and both have very strong cases for the honor, depending on what metrics you prefer.

Over in the National League, that isn’t quite the case. Max Scherzer is the clear front-runner at this point, with a host of other pitchers behind him all trying to make an argument why they might have had better seasons. Clayton Kershaw has a lower ERA. Zack Greinke pitches in a much tougher park. Teammate Stephen Strasburg has a lower FIP.

Those are just the stats that measure outcomes, though. Let’s see what Statcast has to say about the sort of contact the other candidates are allowing to see if anybody has a real case against Scherzer.

Read the rest of this entry »


How 2017 Compares to the Steroid Era: Part II

Yesterday, I looked at how one of the last seasons of the steroid era (2002) compares to the present one in terms of home runs, total offense, and overall value by position. To summarize the findings of that post briefly: while corner outfielders account for less production now than they did in 2002, infielders and catchers are now responsible for more of it. Moreover, players at the top of the home-run leaderboards now are accounting for a lower percentage of total league-wide homers than in the steroid era. There’s a more even distribution of homers, in other words.

Read the rest of this entry »


How 2017 Compares to the Steroid Era: Part I

Infielders account for a greater percentage of homers now than in 2017. (Photo: Ryan Claussen)

The 2017 season has seen offensive levels rise to a height unmatched in major-league baseball for quite some time. Overall this year, teams are averaging 4.65 runs per game, the highest mark since 2007 — though not quite the five runs per game teams averaged in 1999 and 2000. Most of the offensive increase can be traced to a juiced ball. There’s also been a lot of talk about the role of a fly-ball revolution of some sort or another in the establishment of a new league-wide seasonal home-run record.

An increase in PED use has now been raised as an issue, as well. MLB has administered both PED testing and PED-related suspensions since 2004; both have existed in the minors since 2001. Even with those measures in place, however, power continues to be associated with steroid use, and unfounded rumors have hounded the authors of every breakout season over the last decade. With the rise of power in recent years, the whole league is under suspicion. But how similar is this version of the league to the one now known as the “steroid era”? Let’s take a look at what the latter actually looked like and how it compares to now.

Our split tools are very expansive going back to 2002. This is convenient because 2002 was the last season that lacked PED testing of any kind. It might not have been quite the height of that period now regarded as the “steroid era” — that was probably 1999 and 2000 — but the league looked quite different before testing and suspensions were permitted.

Read the rest of this entry »


What Strikeouts Have Taken from Baseball

It shouldn’t be news that strikeouts have increased at a pretty alarming pace over the last decade. From the end of the last strike through 2007, the league-wide strikeout rate was pretty steady, averaging 16.7%. That is, roughly one in every six plate appearances ended in a strikeout. Over the last decade, the average has reached nearly 20%, including a high of 21.6% this year. Now, more than one in every five plate appearances ends in a strikeout. A strikeout is now 30% more likely than it was a little over a decade ago.

This is a problem with many possible solutions: raising the bottom of the strike zone; lowering the mound; or, my personal favorite, expanding the league. This piece isn’t prescriptive, however. The focus of this piece is to show exactly what the strikeout has replaced, and it isn’t actually all bad.

Because I started this piece by doing some research on the home-run record, we will focus here on the year 2000 as it compares to the present. That season represents what was probably the height of the PED era; it was also the season responsible for the league-wide high in home runs until this year. Because the power numbers between the two periods are similar, a comparison of the seasons creates an interesting vantage point from which to view the role of the strikeout.

Generally, we imagine that players have to sacrifice contact for power. It’s notable, then, that the power numbers of today are equivalent those of the 2000 season even though players are striking out 30% more often now than they did back then. To provide some background, here are some standard numbers from 2000 and 2017.

Comparing 2000 and 2017
Season G PA HR BB% K% ISO BABIP AVG OBP SLG wOBA
2000 62083 190261 5693 9.6 % 16.5 % .167 .300 .270 .345 .437 .341
2017 54957 173900 5753 8.5 % 21.6 % .172 .300 .255 .325 .427 .321

As the 20-point difference in wOBA illustrates, overall offensive levels were higher back in 2000. The ISO and BABIP figures are all roughly similar. When a batter hits a ball in play, that batted ball is just as likely to become a hit as it was before. When it lands fair, it’s leading to roughly the same amount of extra bases. All that’s basically the same.

In terms of differences, one finds that this year’s walk rate is a bit lower than in 2000. That has some influence on run scoring, but not at all to the same degree that the increase in strikeout rate has. In effect, 5% of potentially positive plate appearances have been turned into strikeouts. That’s significant. However, while the main complaint about strikeouts is that they lead to fewer balls in play, it isn’t accurate to suggest that every extra strikeout has actually had that effect.

Read the rest of this entry »


Congratulations, Reds, You’ve Done It Again!

In 2015, the Reds finally commenced their transition from contender to rebuilder. During that season, the club began handing playing time to a number of young players, with rookie pitchers accounting for more than two-thirds of the team’s starts. Last season, they followed up that effort with another round of rookie pitchers — a group which, in this case, accounted for one-third of Cincinnati’s starts. As I noted at the beginning of the season, the Reds became just one of a handful of clubs in history to allocate at least half of their starts to rookies in one year and then to follow up that effort by starting rookies in another 50 games the next season.

It’s my duty to inform you that the Reds are at it again — and this time, they’ve left all the other franchises in the dust.

For a little league-wide perspective, here’s the number of rookie starters each team has used over the past three seasons. If a pitcher was a rookie in 2016 but didn’t exhaust his eligibility and pitched again in 2017, that’s counted just once in the numbers below.

Read the rest of this entry »


Mike Trout’s Never Won a Playoff Game and It’s Weird

Mike Trout can do everything. Almost. (Photo: Keith Allison)

In one form or another, the majority of posts at this site are based on some type of leaderboard. Highest average velocity among qualified pitchers, lowest ground-ball rate among qualified batters: these are the sort of distinctions that attract the attention both of writers and readers — and even illustrate the game’s trends towards one pole or another.

Generally speaking, when Mike Trout appears on a leaderboard at FanGraphs, it’s because he’s exerted his excellence in yet another way. Currently, for example, Trout possesses the top batting line among all active players and also the second-most baserunning runs among active players and the second-highest WAR total among all major-league batters ever through age 25.

One capacity in which Trout hasn’t been able to exert his excellence, however, is team success. During his time in Anaheim, Trout has made the playoffs on just one occasion. It was in 2014, and his Angels were swept out of the playoffs promptly. The Angels have had some decent seasons during Trout’s career — they won 89 in 2012, 85 in 2015, and they also currently have a winning record. Odds are, however, that Trout is about to finish his sixth full season as the best player in baseball, and he’s never won a single game in the playoffs. That’s odd.

We know that baseball is a team sport, and even when one-third of teams make the playoffs every year, one player can’t do it alone. Every player is very much reliant on his team. Even Mike Trout.

If it seems unusual that a player of Trout’s stature has failed to win even a single postseason game, that’s because it is. To provide a little context before taking a more historic approach, below is a table featuring the best position players by WAR since Trout exhausted his rookie eligibility in 2012. I’ve also included the total number of postseason games each player has won during that time.

MLBs Best WAR with Playoff Wins Since 2012
Name PA WAR Playoff Wins
Mike Trout 3883 52.9 0
Josh Donaldson 3522 36.5 14
Joey Votto 3504 31.7 2
Andrew McCutchen 3969 31.6 3
Buster Posey 3582 31.3 25
Adrian Beltre 3578 31.2 1
Paul Goldschmidt 3804 31.0 0
Robinson Cano 4033 29.8 3
Miguel Cabrera 3741 28.0 12
Bryce Harper 3242 27.9 5
Manny Machado 3326 26.5 3
Giancarlo Stanton 3072 26.4 0
Jose Altuve 4038 25.5 3
Kyle Seager 3972 25.5 0
Freddie Freeman 3595 24.7 1
Anthony Rizzo 3702 24.4 15
Dustin Pedroia 3517 23.8 11
Jason Heyward 3391 23.6 13
Matt Carpenter 3584 23.2 20
Evan Longoria 3698 23.0 2
Among Position Players

This is one of the few bad leaderboards on which Trout’s name appears. Since becoming an MLB regular in 2012, Trout has recorded double the WAR of all but 10 players. Of those 10 players, Paul Goldschmidt is the only one (besides Trout) not to win a playoff game. Arizona will get an opportunity this season to address that issue — and, of course, Goldschmidt himself recorded two playoff with the Diamondbacks in 2011. Of the top-20 position players since 2012, the only others not to win a playoff game are Giancarlo Stanton and Kyle Seager. With expanded playoffs, good players generally get opportunities to appear on a winning club at some point, and reaching a playoff series generally means winning a playoff game.

Read the rest of this entry »


Defense and Contact and the American League Cy Young

There are five spots on a Cy Young ballot. This season, in the American League, only the first two are going to matter. Last year, Justin Verlander received the most first-place votes, with 14, but he was ranked second on just two ballots. Rick Porcello, meanwhile, received 18 second-place votes in addition to his eight at the top spot. Porcello ended up the winner.

This year, Chris Sale and Corey Kluber are likely to occupy the top two spots on every ballot, and whoever receives more first-place will probably take the award. The pair have produced very similar statistical records this year, so voters will have to split hairs to decide which of the two is more deserving. Let’s begin splitting some of those hairs right now, examining defense, contact quality, various sorts of WAR, and how they all influence each other when it comes to the two best pitchers in the American League.

To provide an initial tale of the tape of sorts, here are a few numbers with which most readers will be pretty familiar.

American League Cy Young: Corey Kluber v Chris Sale
Metric Chris Sale Corey Kluber
IP 195.2 184.2
K% 35.9% 34.6%
BB% 4.9% 4.8%
HR/9 0.83 0.97
BABIP .298 .264
ERA 2.76 2.44
FIP 2.20 2.55
WAR 7.8 6.5

The strikeout and walk numbers are pretty equivalent. Sale has the edge in homers and innings, leading to a lower FIP and therefore WAR. Kluber has a much lower BABIP, which helps him lead in ERA. If you want to factor for league and park, we can do that. Sale’s FIP- is 50 to Kluber’s 57, and Sale’s ERA- is 61 to Kluber’s 54. Part of Kluber’s ERA advantage comes from that BABIP. He also has an 81.6% left-on-base percentage compared to Sale’s 76.7%, though, so part of the advantage is simply due to sequencing.

Read the rest of this entry »


Are the Cubs Underachieving?

While the rotation has underperformed, the Cubs are mostly as advertised. (Photo: Keith Allison)

All things being equal, the Chicago Cubs find themselves in a very good position at the moment. They’re three games ahead of the Cardinals and 2.5 ahead of the Brewers in the NL Central. And while 11 of their final 17 games feature either St. Louis or Milwaukee, our playoff odds give Chicago an 87.5% chance of qualifying for the postseason, with the club avoiding the Wild Card game in almost every scenario. Last year’s World Champions, it appears, will have an opportunity to defend their title.

Yet the season seems slightly disappointing. The Cubs are likely headed to 88-90 wins instead of the 95-96 for which they were projected at the beginning of year — and well short of the 103 victories they recorded last season when they clinched the division on September 15. Given the expectations, it’s fair to wonder not only if the Cubs are underachieving but also, further, if we could have seen this coming.

Heading into the season, the Cubs were projected for around 49 WAR. Simply adding that total to the 47 or so wins a replacement-level team should garner gives you 96 wins. Right now, the Cubs are “on pace” for 88 wins. The FanGraphs model calls for 89 wins because it integrates projections (which are generally strong for Cubs players). In either case, though, Chicago will almost certainly fall short of their preseason forecast.

Let’s try and figure out where those eight wins (or, really, seven wins because 10% of the season remains) went. We can start by simply consulting the BaseRuns standing, which indicate that the Cubs would have 82 (and not 79) wins right now if the sequencing of all their hits and homers and outs was more evenly distributed. So of those seven aforementioned wins, we can account for three of them right away — unless we somehow believe that this Cubs team, composed mostly of players who won three playoff series last year, is fundamentally “unclutch,” that is. But that’s unlikely.

So, based on performance, the Cubs are at 81 wins instead of 85, essentially within 5% of their projection from the beginning of the season. That seems pretty good, not really the look of an underachiever.

Read the rest of this entry »