Author Archive

2017 Positional Power Rankings: Bullpen (#16-30)

The positional power rankings continue. If you’ve come across the 16th- through 30th-ranked bullpens by accident or are otherwise unfamiliar with these power rankings, feel free to read Dave Cameron’s introduction. If you’re interested in any other positional rankings, use the links above this paragraph. For the start of the relief-pitcher portion, read on.

The graph below contains half the major-league teams. If you don’t see your favorite team below, congratulations: you cheer for a club that ranks in the top half of baseball when it comes to relievers. Those teams will be covered in short order, and if there’s a link at the beginning of this post to them, that means they’ve already been published.

While this post covers the bottom half of the rankings, the first few teams included here are extremely close to the teams just ahead of them, and there are a few bullpens whose projections potentially underrate them. Add in some reliever volatility and random fluctuation, and we could see a number of these clubs among the league’s top 10 at the end of the year.

A note: while you won’t find Andrew Miller’s club here, you’ll find his name invoked with some frequency. There’s been a lot of talk in recent years about deploying elite relievers in non-traditional but high-leverage situations. Cleveland’s use of Andrew Miller in last year’s postseason is about the purest expression of this concept in some time. While that sort of usage isn’t sustainable over the course of a full regular season, there are times when it represents the best option for a team.

To that end, I’ve provided a rating (out of 10) of every team’s capacity to use a reliever in these non-traditional situation. I refer to this as the Andrew Miller Situation Scale. The ratings are subjective and somewhat arbitrary, but tend to be higher for clubs whose best reliever isn’t also their closer. Secondary considerations include the club’s motivations for using the strategy (if it’s financially motivated, for example) as well as the actual quality of both the “elite” reliever and closer. Basically, the higher the number, the more the situation resembles an Andrew Miller situation.

Name IP K/9 BB/9 HR/9 BABIP LOB% ERA FIP WAR
Roberto Osuna   65.0 10.3 2.3 1.1 .297 77.8 % 3.13 3.34 1.5
Jason Grilli 65.0 10.9 3.8 1.3 .305 76.4 % 3.82 3.92 0.6
Joseph Biagini 55.0 8.0 2.8 1.0 .314 73.4 % 3.89 3.96 0.4
J.P. Howell 55.0 7.4 3.4 0.9 .316 74.0 % 3.90 4.04 0.2
Joe Smith 45.0 7.8 2.9 1.0 .306 73.9 % 3.77 4.07 0.2
Aaron Loup 40.0 8.6 3.1 1.0 .309 74.1 % 3.76 3.94 0.2
Ryan Tepera 35.0 8.7 3.5 1.1 .309 73.8 % 3.99 4.13 0.0
Danny Barnes 30.0 9.8 2.4 1.1 .311 74.3 % 3.63 3.55 0.2
Christopher Smith 25.0 8.3 4.2 1.3 .324 69.1 % 5.10 4.74 0.0
Bo Schultz 20.0 6.9 3.1 1.3 .305 70.5 % 4.57 4.54 0.0
Matt Dermody 15.0 6.5 2.5 1.2 .313 69.1 % 4.59 4.37 0.0
Mat Latos 10.0 6.6 3.0 1.3 .309 70.2 % 4.77 4.69 0.0
Glenn Sparkman   10.0 7.6 2.5 1.4 .312 71.1 % 4.47 4.43 0.0
The Others 15.0 8.3 4.2 1.3 .324 69.1 % 5.10 4.74 0.0
Total 485.0 8.7 3.1 1.1 .310 73.7 % 3.93 4.00 3.3

The list of relief pitchers with a better projection than Roberto Osuna isn’t long. None of the other pitchers I’m covering today are superior, in fact, and he ranks 10th overall. Osuna is just 22 years old and is entering his third MLB season. He struck out nearly 30% of batters and walked just 5% last season, and led American League relievers with a 21% infield-fly rate. The Blue Jays rank this low not because of Osuna, but because of the rest of the pen.

Read the rest of this entry »


Yoan Moncada Deserves the Kris Bryant Treatment a Year Early

Two seasons ago, Kris Bryant was regarded by many as the top prospect in all of baseball. After having dominated all levels of the minors, he appeared to be a candidate to begin the season on the Cubs’ 25-man roster. The conditions were nearly ideal. Not only had Bryant proven himself in the minors, but the club possessed no one of consequence to start at third. Furthermore, the Cubs intended to contend in the NL Central.

Despite all the arguments in favor of Bryant breaking camp with the Cubs, he was sent to Iowa. He waited a week and a half, at which point the team called him up. He proceeded to have a great season. By waiting to promote him, though — a decision that wasn’t without some controversy — the Cubs ensured that Bryant wouldn’t be a free agent until after 2021 instead of 2020.

The Chicago White Sox’ Yoan Moncada, named the top prospect in baseball recently by Eric Longenhagen, deserves (and doesn’t deserve) the same fate. Allow me to explain.

The Chicago Cubs “generously” gave Kris Bryant a $1 million dollar salary this season when they could have given him close to half, but that is nothing compared to the potentially tens of millions of dollars they stand to gain by having Bryant’s services in 2021. One year of a great player in his prime — and Bryant will be 29 years old in 2021 — is incredibly valuable. The cost of six wins on the free-agent market is roughly $50 million. Such a large figure might seem improbable at first: no players receive $50 million salaries and some six-win players (David Price and Max Scherzer, for example) do hit free agency. However, those players sign multi-year deals, often receiving the same salary in Year One as Year Seven despite the fact that expected production in that first season greatly exceeds that of the latter years of a contract. The production and salary are expected to average out by the end of a deal, with overpayments in later years compensating for underpayments in the earlier ones. The point here — and one that makes sense even in the absence of the math — is that one extra year of a player’s services can be incredibly valuable.

As for what such a young and talented player deserves in terms of compensation, there are a lot of ways to attack the concept. Kris Bryant deserved to be on the Opening Day roster in 2015 due to his play. Unfortunately, that play — and the promise it suggested — rendered Bryant too valuable for the Cubs not to manipulate his service time. Therefore, they waited those 10 days.

That isn’t a great system. It creates disincentives, even if very small, to putting the best team on the field. But it’s the system under which MLB is operating presently. And it matters right now because of Yoan Moncada.

Read the rest of this entry »


White Sox Hope to Hit It Big with Tim Anderson Contract

Tim Anderson and the Chicago White Sox have agreed to an extension that will pay the young shortstop $25 million over six years and which includes two team options that could double the amount of the contract.

The deal is both big and small. It’s the largest contract ever given to an MLB player with less than a year of service time. So that’s significant. On the other hand, the contract also figures to pay Anderson an average annual value that equates to an amount less than deals signed this winter by Boone Logan and Mitch Moreland. If Anderson doesn’t progress as a major-league player and is out of the league in a couple years, he’ll have at least made $25 million — a substantial figure, in other words. If Anderson is good, then the White Sox will have themselves a huge bargain.

Contracts like Anderson’s aren’t very common. While extensions are signed with some frequency by players who’ve recorded a year-plus of service time — and occur with similar frequency for players at each year of service time until free agency — that’s not the case for players like Anderson, who have little experience in the majors.

Consider: since 2010, there have been 143 extensions of three or more years given to players who’ve recorded less than six years of service time, per MLB Trade Rumors. Of those deals, Tim Anderson’s is just the fifth signed by a player with less than a year of service time. That’s a rarity, as the graph below reveals.

As to why these contract extensions are so rare, one likely explanation is the lack of incentive for a team to pursue a deal any earlier. While extensions such as these can certainly represent bargains for team — and while teams certainly like bargains — clubs can frequently secure players for similar terms after a year or two of play. That allows them to gather more information about the player in question.

Read the rest of this entry »


2017 Positional Power Rankings: Second Base

Welcome to Day Three of the 2017 Positional Power Rankings from FanGraphs. For some background on how these posts work, read the introductory post by Dave Cameron. Click on the links above to examine other positions.

The rankings below come from the FanGraphs Depth Chart projections. While the projections spit out specific numbers, these projections are estimates and teams that are within a few tenths of a win of each other have similar forecasts for the season. While I didn’t create the projections, the commentary is my own.

Last season was marked by a surge of offense throughout baseball, and this was very much the case for second basemen, who posted one of the greatest seasons of all time for the position. While it might be tempting to point to some sort of emerging group of players set to change the way we think about the position, the evidence doesn’t support that hypothesis. Of the top-eight players, only Jose Altuve will play this season under the age of 30, with many of the best already in their mid-30s. Jose Altuve is the exception, not the rule, as the young star has a sizable lead over his competitors at second.
This is the first time in half a decade that the team with Robinson Cano isn’t atop this list. Cano didn’t stumble far and other aging vets fall in line behind him. As far as the order in which clubs appear here, there could be a shakeup before the year is out. A couple teams near the top might be shopping their second basemen if they fall out of contention. If you’re looking for a team to rise, look to the south side of Chicago, where the best prospect in baseball could get his first real shot at a starting job later this season.

Name PA AVG OBP SLG wOBA Bat BsR Fld WAR
Jose Altuve 644 .316 .366 .469 .355 19.7 0.6 -2.9 4.3
Marwin Gonzalez 35 .257 .297 .400 .301 -0.5 -0.1 0.1 0.1
Tony Kemp 21 .256 .325 .344 .297 -0.4 0.0 0.0 0.0
Total 700 .311 .361 .462 .350 18.9 0.5 -2.8 4.4

For the last four years, the team that employed Robinson Cano occupied the top spot in these rankings. The reign that moved from New York to Seattle is no more. Jose Altuve, who is not tall, has the best projection for a second baseman by a quite a bit this year. In 2014 and 2015, Altuve had a 130 wRC+ based almost entirely on contact that stayed in the yard. His walk rate was under 5% and his .129 ISO — based on a large collection of doubles rather than homers. Last season, he kept roughly the same rate of doubles (42) and triples (5), but hit 24 homers and increased his walk rate by 70% without striking out more. The result was a 150 wRC+, good for eighth in all of baseball last season.

Read the rest of this entry »


The Best One-Two Punch in Baseball

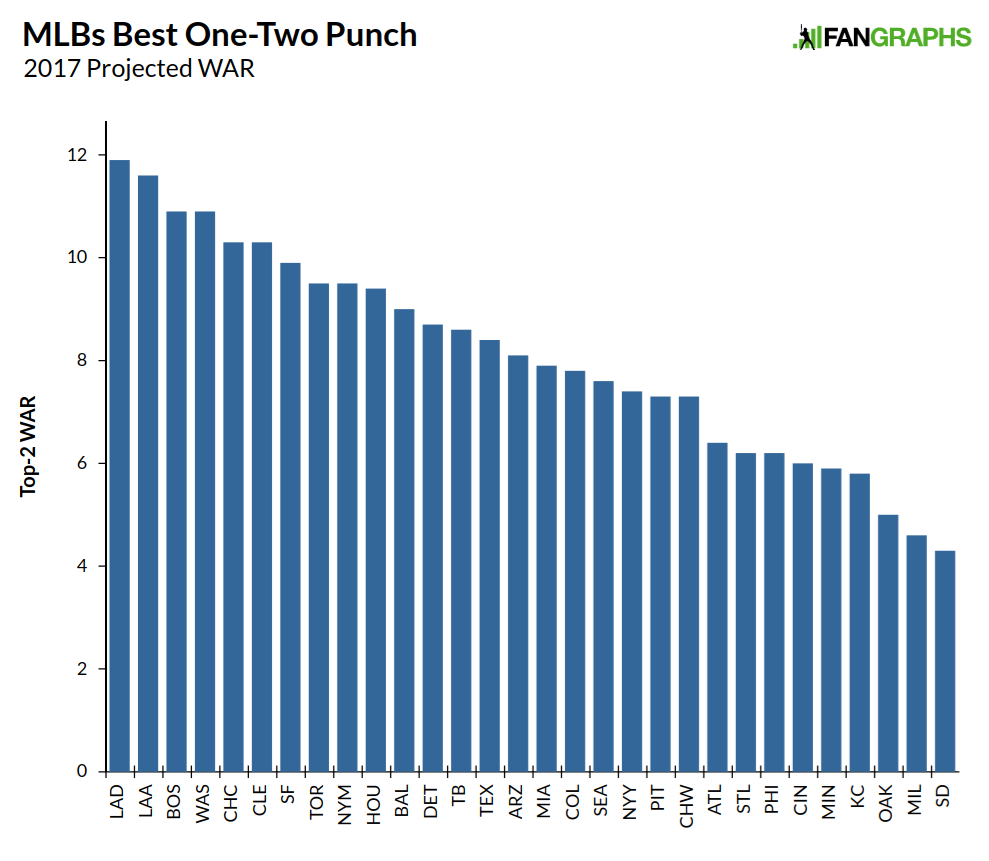
Mike Trout plus almost anybody else seems like a fair answer to the question of which team has the best 1-2 punch in baseball. I probably wouldn’t fault anyone who was willing to trade their best two players for just one Mike Trout, even if it was just for this season. Looking at the question a little more objectively, however — with this year’s projections — reveals that Mike Trout plus nobody would rank (a) in the top half of major-league teams’ best duos, but also (b) nowhere near the top. Also Trout doesn’t play with nobody, as the Angels have a few other decent players and might contend for a playoff spot if things break right.

As for the best one-two combo in terms of combined WAR, a reasonable person could make a few other reasonable guesses. Kris Bryant and Anthony Rizzo form an impressive pair. Mookie Betts and Chris Sale are fantastic for the Red Sox. And then there’s Bryce Harper and Max Scherzer, Madison Bumgarner and Buster Posey, Jose Altuve and Carlos Correa. All of those are good guesses, but it’s actually the Dodgers who occupy the top spot, with Clayton Kershaw and Corey Seager barely edging Mike Trout and the still very good Andrelton Simmons.

As great as Mike Trout is, Clayton Kershaw’s 7.4 projected WAR is less than a win from Trout’s 8.2. While the Angels’ shortstop has a good 3.4 projected WAR, Corey Seager’s 4.5 WAR makes up for the difference between Kershaw and Trout.

Read the rest of this entry »


How the Yankees Can Save Money and Sign Bryce Harper

A half-dozen years ago, the Yankees developed a plan. As a team that had consistently exceeded the luxury-tax threshold, the Yankees were paying an extra 50% on every dollar over Major League Baseball’s competitive-balance tax rate. Their financial commitments also made them ineligible to recoup some of their revenue-sharing money. As a response, the club resolved to reduce spending ahead of the 2014 season, aiming for a payroll figure below the $189-million threshold. That would reset their tax rate to less than 20% in 2015 and reduce their commitments to revenue sharing.

That never happened, though. In 2013, the team failed to make the playoffs and, despite the major gift of having Alex Rodriguez’s salary removed from the books, the plan was scrapped and a massive spending spree undertaken. Four years after the plan was discarded, the Yankees will once again have that same opportunity. This time, they’re in a much better position to execute it.

While the prospect of saving a lot of money in salaries and taxes is enticing even for a team with as much money as the Yankees, the prospect of reaching the playoffs and driving up attendance is also financially beneficial — and probably more enjoyable, too. That’s likely the logic that informed the Yankees’ offseason spree a few years ago. After the club had Alex Rodriguez’s salary removed by suspension, the team went out and signed Carlos Beltran, Jacoby Ellsbury, Brian McCann, and Masahiro Tanaka for Derek Jeter’s final year. The result: a payroll once again over $200 million. The team drew more fans, but fell a bit shy of the playoffs. They secured a Wild Card spot in 2015 but promptly lost to the Astros.

Fast forward to the present, and the Yankees once again have a payroll that will exceed $200 million by season’s end — well above the $195 million competitive-balance tax amount for this season. They also don’t have a great shot at the playoffs according to our projections, which forecast them for 79 wins and a 14% chance of qualifying for the postseason. Just how long of a rebuild the Yankees can stomach remains to be seen, but here are the contracts coming off the books next season.

Yankees Contracts Ending After 2017
Player 2017 Salary (M) Proj. WAR
CC Sabathia $25.0 1.8
Matt Holliday $13.0 1.2
Michael Pineda $7.4 3.3
Tyler Clippard $6.5 0.3
Alex Rodriguez $21.0 0.0
Total $72.5 6.6

Among the players listed here, only Pineda figures to be worth the money he’s owed this season. The departure of Tanaka might hurt, too, even with a $22 million salary attached. In 2018, the Yankees will owe Ellsbury, Tanaka, Starlin Castro, Aroldis Chapman, Brett Gardner, Chase Headley and Brian McCann (a portion of his salary with the Houston Astros) a total of $101.2 million. Raises in arbitration to players like Didi Gregorious, Dellin Betances, Aaron Hicks, Austin Romine and Adam Warren might add another $20 million. If we conservatively figure another $15 million for player benefits, that places the club’s post-2017 commitments at something like $135 million, meaning the Yankees have about $60 million to make improvements while still remaining under the competitive-balance tax.

Read the rest of this entry »


Service Time, Salaries, and the Reliance on Free Agents

It would likely surprise no one to learn that players who reach free agency are the ones who make the most money. The owners and players together have devised a system wherein players at the beginning of their careers make the league minimum, players in their next few years earn a little bit more, and players who possess six-plus years of service time… they make a ton of money. That system has made it so that clubs with greater payrolls typically employ more of this last type of player, while teams on the lower end of the spectrum rely on more minimum-salary players. Let’s examine that gap and which teams are the most reliant on free-agent veterans to fill their rosters.

To illustrate the effects of the system, let’s begin by looking at all MLB player salaries along with service time. The graph below (courtesy of Sean Dolinar) includes 750 data points, each one representing a player likely to appear on a major-league Opening Day roster. While service time is often presented as in years and days, I’ve used a slightly different format here. For the purposes of a better-looking graph, days were divided by 172 (a season’s worth of service time) to get a more accurate picture of how close each player is to having recorded another full season in the majors.

We see a great number of points clustered near the bottom left of the table. Those represent the players who’ve recorded the least service time and are (mostly as a result) also earning the least money. The few outliers on the left of the graph are composed mostly of Asian and Cuban free agents whose situations more closely resemble players with at least six years of service time. Next, there’s another cluster at Year Three. That’s when players become eligible for arbitration. Salaries rise at that point, but only a little. After that, it’s all over the place.

Read the rest of this entry »


MLB Teams With the Most Dead Money

When a team invests money in a player, the general idea is that the player in question will generate value by actually playing for the team by whom he’s been signed or acquired. Of course, that’s not always the case. There are multiple reasons why a team might end up cutting ties with a player but agree to continue paying part or all of his salary: to complete a trade that enables that club to get better prospects in return, to open a 40-man spot for a player of greater value, or to offset the salary of an overpaid player to make him more enticing in a trade.

For a club to spend money on players absent from their roster isn’t necessarily a bad thing. Last season, for example, the Cubs, Dodgers, and Indians all had more than $10 million in dead money. They clearly had no problems competing.

As for why a team would want a player so easily discarded by his original team, our old friend Moneyball covered that pretty well when it came to the A’s acquisition of David Justice:

In his prime, Justice had been the sort of sensational hitter the Oakland A’s could never have afforded to buy on the open market. They could afford him now only because no one else wanted him: the rest of baseball looked at Justice and saw a has-been. Billy Beane had cut a deal with the Yankees thtat left the A’s with Justice for one year at a salary of $3.5 million, half what they Yankees had paid him the year before. The Yankees picked up the other half. The Yankees were, in effect, paying David Justice to play against them.

It was a little more dramatic in the movie (and as Ken Davidoff mentioned to me, it was the Mets, not the Yankees), but in any event, the opportunity to potentially buy low on a player is enticing. Nor is the strategy limited merely to low budget teams taking on players from high-budget ones. All teams — or, at least, almost all teams — have a pretty good amount of money, so almost every team can afford to give up or take on a player depending on their needs. Last season, there was around $136 million in dead money on payroll. This season, that amount has doubled. In terms of teams paying the most, the Dodgers have a healthy lead, with the Padres and Yankees also devoting some payroll to players not contributing to the current club.

Read the rest of this entry »


2017 Projected Opening Day Payrolls

With free agency more or less in the books and all arbitration cases having been decided, the projected payrolls for Major League Baseball teams are becoming more clear. A few moves could occur before the start of the season — maybe some contract extensions, maybe some trades — but given the information we have, we can come pretty close to projecting Opening Day payrolls for all 30 teams.

Overall, spending has increased moderately since last season. A year ago, the average Opening Day payroll was right around $128 million, which itself represented a very small increase over 2015 despite big spending in free agency. This year, the average payroll is up to $133 million, a 4% increase despite uncertainty with the new Collective Bargaining Agreement and a weak free-agent class.

In what follows, I’ll consider the league’s payrolls in a few different ways. Salary information has been collected from Cot’s Contracts, while the equivalent of the MLB-minimum salary has been attached to open roster spots, bringing each team to 25 players. Money for players not on a club’s roster roster — as in the case of the Reds, for example, who are paying $13 million for Brandon Phillips to play in the Atlanta suburbs — is included in the payroll for the team actually paying the money.

To nobody’s surprise, the Los Angeles Dodgers have the highest payroll in baseball.

The Dodgers come in at around $235 million, which is roughly $40 million clear of the second-place Detroit Tigers. Even after accounting for the competitive-balance tax, it appears as though the Dodgers are still looking at a reduction of more than $30 million from last season. Even if they need to cut payroll more, the result should hardly be debilitating for the health of the team.

The tax amount for this season is $195 million. When you account for the $15 million or so that gets added for benefits and the rest of the 40-man roster, it would appear that the Tigers and Yankees will pay between $5 million and $10 million, the Giants will be right on the borderline, and the Red Sox might actually be under, as Allen Craig and Rusney Castillo don’t count for tax purposes.

Read the rest of this entry »


Max Scherzer and Jon Lester Have Been Free-Agent Bargains

Two years ago, Max Scherzer and Jon Lester signed deals worth a total of $365 million between them, agreements which would keep both players employed into their age-36 seasons. The accepted wisdom, dating back at least as far as Mike Hampton and Barry Zito, is that signing free-agent starting pitchers to massive contracts into their 30s is a poor idea. If early returns are any indication, last season’s deal for Zack Greinke is unlikely to serve as evidence to the contrary. David Price’s injury scare, meanwhile, provides another reminder of the risks inherent to long-term agreements with pitchers.

Not all such commitments are doomed, however. We’re just entering the third year of the contracts signed by Scherzer and Lester, for example, and so far those deals look quite good.

Two offseasons ago, Lester and Scherzer represented the only two players to receive a contract of $100 million or more. Eight other players signed for at least $50 million, though. All 10 such contracts are listed below. For each player, I’ve also provided an estimate of the value he would have been expected to provide starting with the time he signed. To calculate this estimated value, I began with each player’s WAR forecast from the 2015 FanGraphs Depth chart projections, started with $7.5 million per win, added 5% inflation per year, and applied a standard aging curve. The rightmost column indicates whether the player in question was expected to outperform or underperform the cost of his contract.

2015 Free-Agent Signings
Contract (Years, $M) Contract Value at Time Surplus/Deficit
Max Scherzer 7/210 $198.8 M -$11.2 M
Jon Lester 6/155 $146.1 M -$8.9 M
Pablo Sandoval 5/95 $127.4 M $32.4 M
Hanley Ramirez 4/88 $81.4 M -$6.6 M
Russell Martin 5/82 $109.9 M $27.9 M
James Shields 4/75 $94.4 M $19.4 M
Victor Martinez 4/68 $42.7 M -$25.3 M
Nelson Cruz 4/57 $23.8 M -$33.2 M
Ervin Santana 4/55 $16.7 M -$38.3 M
Chase Headley 4/52 $104.1 M $52.1 M

The surplus and deficit figures for individual players vary by quite a bit. Overall, however, the actual contract and value numbers are within 1% of each other.

It might be hard to believe that, at the time, projection systems were calling for Chase Headley to record $100 million in value. Remember, though, that he had averaged more than five wins over the three previous seasons and had just completed a four-WAR year. From this point, it looked like Scherzer, Lester, and Hanley Ramirez signed contracts pretty close to their expected value. The number for Scherzer is probably even closer than what we see above after accounting for his deferrals, as he makes just $15 million per season over the playing life of the contract.

Read the rest of this entry »