
The Best One-Two Punch in Baseball
Mike Trout plus almost anybody else seems like a fair answer to the question of which team has the best 1-2 punch in baseball. I probably wouldn’t fault anyone who was willing to trade their best two players for just one Mike Trout, even if it was just for this season. Looking at the question a little more objectively, however — with this year’s projections — reveals that Mike Trout plus nobody would rank (a) in the top half of major-league teams’ best duos, but also (b) nowhere near the top. Also Trout doesn’t play with nobody, as the Angels have a few other decent players and might contend for a playoff spot if things break right.
As for the best one-two combo in terms of combined WAR, a reasonable person could make a few other reasonable guesses. Kris Bryant and Anthony Rizzo form an impressive pair. Mookie Betts and Chris Sale are fantastic for the Red Sox. And then there’s Bryce Harper and Max Scherzer, Madison Bumgarner and Buster Posey, Jose Altuve and Carlos Correa. All of those are good guesses, but it’s actually the Dodgers who occupy the top spot, with Clayton Kershaw and Corey Seager barely edging Mike Trout and the still very good Andrelton Simmons.
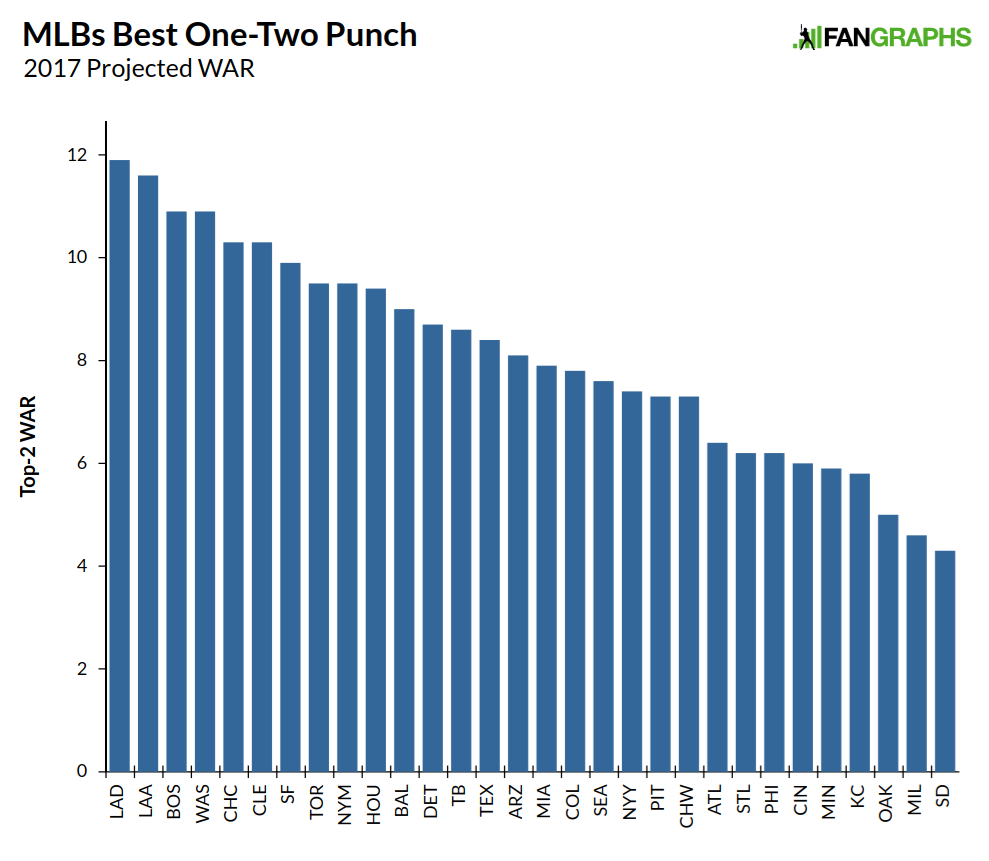
As great as Mike Trout is, Clayton Kershaw’s 7.4 projected WAR is less than a win from Trout’s 8.2. While the Angels’ shortstop has a good 3.4 projected WAR, Corey Seager’s 4.5 WAR makes up for the difference between Kershaw and Trout.
Of course, this isn’t the only way to measure these duos? We can take another crack at it using the geometric mean, where we multiply the two numbers and then take their square root. Doing this helps both to emphasize the importance of the second player and reward the relevant team for employing two of the best players in baseball as opposed to one great player and one who is merely above average.
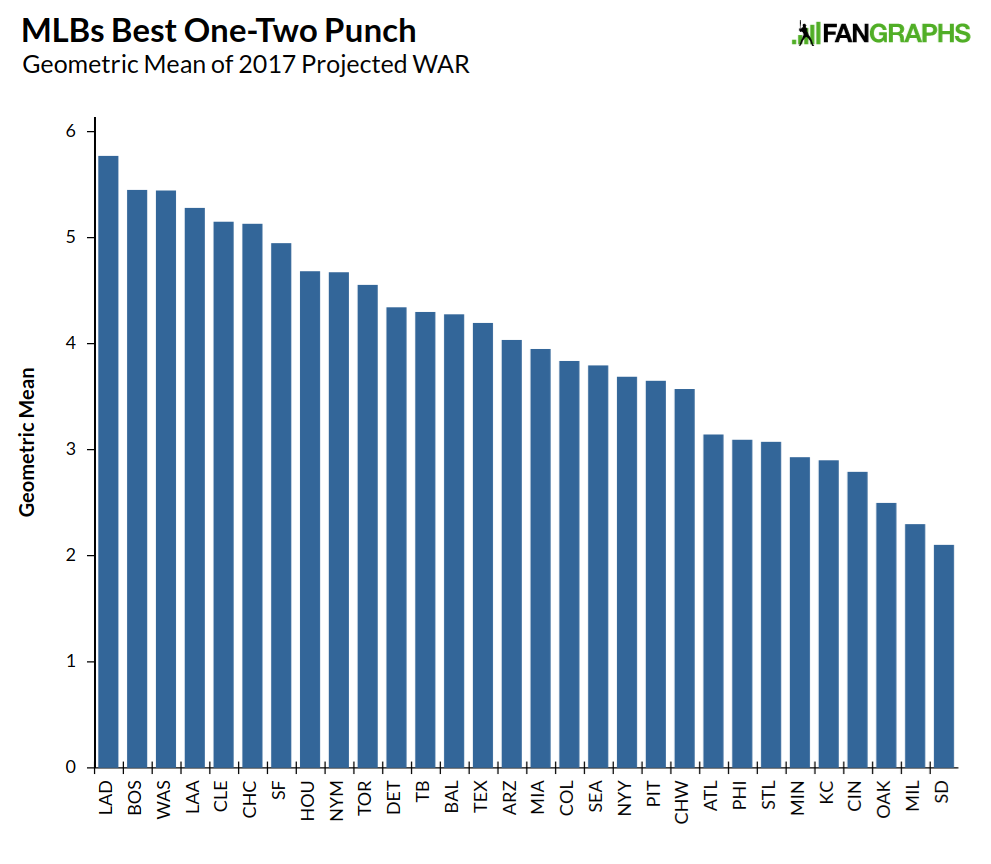
The Dodgers still occupy the top spot by this methodology, but the Red Sox and the Nationals move ahead of the Angels. In this case, having two five-win players distributes the talent more evenly. It probably isn’t a surprise, but most of the best teams in baseball are on the higher side of the chart, while most of the teams not expected to contend are on the lower side. There are 16 teams in baseball right now that possess at least a 20% chance of making the playoffs, per our odds. The top-12 teams above are in that top 16, with Texas still in the top half. Only Pittsburgh, St. Louis, and Seattle appear outside the top half of teams above and yet appear likely to contend for a playoff spot.
This information has some relevant beyond just serving as a bit of trivia. There are a couple conclusions we can glean from it. First, based on the information above, if the only thing you knew about a team was the WAR of its best two players, you would have an inside track on guessing the contenders for this season.
Second, it gives us some idea about team depth. While depth can be measured in many different ways, one of those way is to take the top-two players on every team and look at the percentage of a team’s total WAR for which those two players are responsible. This gives us a sense of the most top-heavy teams in baseball. Given that Pittsburgh, St. Louis, and Seattle don’t rate highly when it comes to the top-two rankings — and yet are nevertheless expected to contend — we would expect those teams to have a pretty low percentage of their WAR coming from their two best players. Here’s what we find.
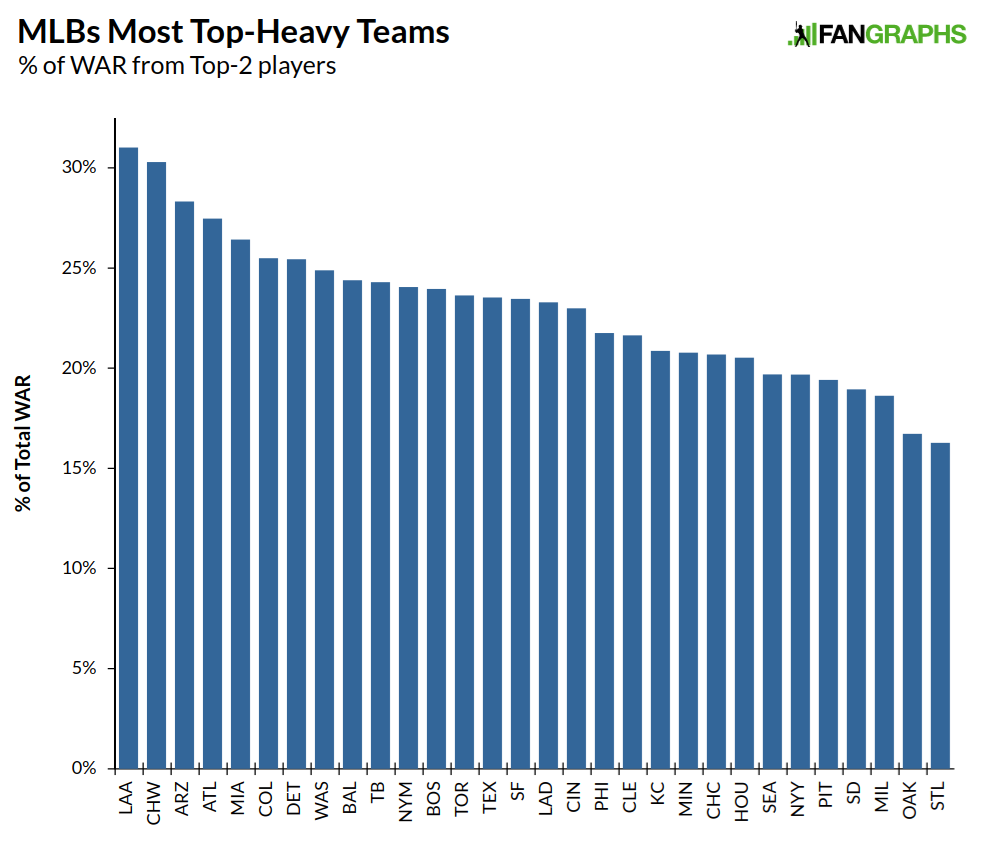
As expected, the Cardinals, Mariners, and Pirates all have a fairly low percentage. St. Louis appears at the bottom, at around 16%.
This graph also gives us an idea of which clubs are most vulnerable to injuries or poor performance from their best players. The Angels would be absolutely hopeless without Mike Trout, for example, so it isn’t really a surprise how highly ranked they are here. We saw what happened last season to the Arizona Diamondbacks without A.J. Pollock. Another injury to Pollock or star Paul Goldschmidt would torpedo whatever small chance the team has this season. The Marlins need Yelich and Stanton in the same way. The latter’s absence for part of last year hurt, and the Tigers have to have Miguel Cabrera and Justin Verlander performing well or else.
As the chart above only illustrates the best duos’ percentage of total WAR, it doesn’t reveal as much about contention. Milwaukee, Oakland and San Diego are less reliant on any one player — not because they have a lot of depth, but because they don’t have very good players. The White Sox, meanwhile, aren’t overly reliant on Jose Quintana: they’re roughly as likely to reach the postseason with him or without him, which is why he’s on trading block. The above is going to approximate how even the talent level is throughout the team compared to their best players, but doesn’t completely tell us about depth.
Let’s take some of the information above and try to measure depth one more way by removing the top-two players and seeing how the teams rank according to projected WAR if the best players are removed.

There’s a reason the Cubs, Dodgers, and Indians are supposed to be really good this year, and it isn’t just because they have great players at the top. If you took away Kershaw and Seager from the Dodgers and Bryant and Rizzo from the Cubs, they would still be among the top-10 teams in baseball — at a talent level, that is, roughly equivalent to the New York Mets. While looking at a team’s two best players will give you a decent idea on if a team will make the playoffs, removing a team’s best players and looking at what’s left shows even more. That’s why building a team is difficult, stars and scrubs is hard to pull off, and while having great players helps, having a lot of good players is better.
For reference, here is all of the above-graphed information in one chart.
| Team | Players | Top WAR | 2nd WAR | Top-2 WAR | Geometric Mean | % of Total WAR |
|---|---|---|---|---|---|---|
| Dodgers | Kershaw, Seager | 7.4 | 4.5 | 11.9 | 5.8 | 23.3% |
| Angels | Trout, Simmons | 8.2 | 3.4 | 11.6 | 5.3 | 31.0% |
| Red Sox | Sale, Betts | 5.5 | 5.4 | 10.9 | 5.4 | 24.0% |
| Nationals | Scherzer, Harper | 5.7 | 5.2 | 10.9 | 5.4 | 24.9% |
| Cubs | Bryant, RIzzo | 5.6 | 4.7 | 10.3 | 5.1 | 20.7% |
| Indians | Kluber, Lindor | 5.2 | 5.1 | 10.3 | 5.1 | 21.6% |
| Giants | Bumgarner, Posey | 5.1 | 4.8 | 9.9 | 4.9 | 23.5% |
| Blue Jays | Donaldson, Sanchez | 6.1 | 3.4 | 9.5 | 4.6 | 23.6% |
| Mets | Syndergaard, deGrom | 5.6 | 3.9 | 9.5 | 4.7 | 24.1% |
| Astros | Correa, Altuve | 5.1 | 4.3 | 9.4 | 4.7 | 20.5% |
| Orioles | Machado, Gausman | 5.9 | 3.1 | 9.0 | 4.3 | 24.4% |
| Tigers | Verlander, Cabrera | 4.6 | 4.1 | 8.7 | 4.3 | 25.4% |
| Rays | Kiermaier, Archer | 4.4 | 4.2 | 8.6 | 4.3 | 24.3% |
| Rangers | Darvish, Beltre | 4.4 | 4.0 | 8.4 | 4.2 | 23.5% |
| Diamondbacks | Goldschmidt, Pollock | 4.4 | 3.7 | 8.1 | 4.0 | 28.3% |
| Marlins | Yelich, Stanton | 4.0 | 3.9 | 7.9 | 3.9 | 26.4% |
| Rockies | Arenado, Gray | 4.6 | 3.2 | 7.8 | 3.8 | 25.5% |
| Mariners | Seager, Cano | 4.0 | 3.6 | 7.6 | 3.8 | 19.7% |
| Yankees | Tanaka, Sanchez | 4.0 | 3.4 | 7.4 | 3.7 | 19.7% |
| Pirates | Cole, McCutchen | 3.7 | 3.6 | 7.3 | 3.6 | 19.4% |
| White Sox | Quintana, Rodon | 4.4 | 2.9 | 7.3 | 3.6 | 30.3% |
| Braves | Freeman, Inciarte | 3.8 | 2.6 | 6.4 | 3.1 | 27.5% |
| Cardinals | Martinez, Carpenter | 3.5 | 2.7 | 6.2 | 3.1 | 16.3% |
| Phillies | Nola, Velasquez | 3.3 | 2.9 | 6.2 | 3.1 | 21.8% |
| Reds | Votto, DeSclafani | 4.1 | 1.9 | 6.0 | 2.8 | 23.0% |
| Twins | Dozier, Sano | 3.3 | 2.6 | 5.9 | 2.9 | 20.8% |
| Royals | Cain, Duffy | 2.9 | 2.9 | 5.8 | 2.9 | 20.9% |
| A’s | Cotton, Gray | 2.6 | 2.4 | 5.0 | 2.5 | 16.7% |
| Brewers | Davies, Guerra | 2.4 | 2.2 | 4.6 | 2.3 | 18.6% |
| Padres | Myers, Solarte | 2.6 | 1.7 | 4.3 | 2.1 | 18.9% |
Craig Edwards can be found on twitter @craigjedwards.
Cool Post!
Pretty wild that Villar or Braun aren’t top 2 for Milwaukee.
Davies 2.4
Guerra 2.2
Braun 2.0
Thames 1.8
MATT GARZA 1.5
Villar 1.3
1) Oh woe, the Brew Crew 🙁
2) That’s a lot of regression on Villar
3) That’s not starts and scrubs, that’s just scrubs
4) When Matt Garza is your 5th best player, I refer you back to #1
*When Matt Garza is PROJECTED to be your 5th best player.
I would be willing to bet anyone on the internet any amount of Adult Entertainment Credits that Matt Garza does not finish the season among the top 5 Brewers in WAR.
The youth & accompanying high variability of the Brewers roster is a reason for NO WOE from me. Santana, Broxton, Braun has the potential to be a dangerous offensive OF with Brinson waiting in the wings. Shaw, Arcia, Villar & Thames offer varying degrees of intrigue around the IF with Hernan Perez as a fun UT guy & Diaz/Erceg not all that far off.
Pitching isn’t as pretty but if Davies & Guerra can build off their 2016 success & Peralta/Nelson can get back to their past MOR form with Hader chipping in later in the season you’ve got a decent rotation.
I haven’t been as excited for a Brewers season to start since 2011.
Bless you
I agree–when you aren’t going to be good, the best thing you can do is have a huge range of outcomes, because the off chance you’ll have some guys turn into real 1st-division regulars is more important than treading water. Plus, those guys are fun! Power! Speed! Strikeouts! I love what the Brewers are doing, even if they’re going to be bad this year.
And your bet is cheating a bit. If Garza is anywhere close to the Top 5 in Brewers WAR by the all-star break he’ll be filling out the rotation for a contender.
Also, I think that there’s a decent chance that Broxton or Villar, if not both, are the best two Brewers next year. Mostly because they’re the only ones who have performed at a high level already and aren’t on the wrong side of 30.
Sort of makes you doubt the underlying program.
Cardinals are the embodiment of the anti-stars and scrubs roster construction. Solid bullpen, above average at every position, and great depth.
Thankyou, bestfaninbaseball
Kole Calhoun has had a higher WAR than Andrelton Simmons in each of the past 3 years. I would say he’s likely to beat his projection,
Just want to point out two things:
1. Seattle’s top two players from last season had 11.5 WAR. (Cano;6, Seager;5.5).
2. And for the arbitrary line-in-the-sand factoid, Seattle will have 3 players on their 2017 roster who accumulated at least 5 WAR in 2016. Only the Nationals with 3 (somehow none of them named Harper), the Dodgers with 3 (somehow none of them named Kershaw) and Red Sox with 4(!) can say the same.
Kershaw was at 6.5 WAR last year. You may have accidentally excluded him because he wasn’t qualified. However, with Kershaw, I only count three 5+ WAR players for them.
Also, last year, the Dodgers top 2 were at 14 combined. Probably every player on this list has a reasonable chance to outperform his projection. In other words, the Dodgers have the highest projected top 2 with 11.9, but there is probably greater than a 90% chance that some team’s top 2 exceed 11.9.
Yep, good catch. That should have said the Dodgers have 3 including Kershaw.
Also, completely absurd that he accumulated the highest pitcher WAR despite pitching only 149 innings. The dude is a freak.
Or Mike Trout by himself.
2. cont’d — Team’s barely missing that arbitrary boat on having three 2016 5-WAR players for the upcoming season: the Tigers (Kinsler;5.8, Verlander;5.2, Cabrera;4.9), the Giants (Crawford;5.8, Cueto;5.5, Bumgarner;4.9) and the Indians (Lindor;6.3, Kluber;5.1, Kipnis;4.8, Ramirez;4.8).
Oh and in case it wasn’t clear, the Red Sox were/are really good (Betts; 7.8, Porcello;5.2, Sale;5.2, Pedroia;5.2, Bradley Jr.;4.8, Bogaerts;4.7)
I personally don’t see Cruz or Segura dropping off the way Steamer projects, but more importantly, the Mariners simply have a solid lineup with real depth. Maybe 1B is a little vulnerable, and they could probably benefit from another LHRP, rather than depending on Miranda, Overton, or Pazos. Gallardo’s still a bit of a question mark as well, but they have plenty of fallback options for the rotation.
I keep looking at the Dodgers’ abundance of LHRP’s as well as guys like Buchter (Padres) and wonder if there might be a fit. Abreu would seemingly be available as a 1B alternative, though he doesn’t show the kind of discipline Dipoto has been zeroing in on. His price tag would be interesting.
Anyway, the point is that I see Seattle as a stronger team than they may appear on the surface. A 1-5 of Dyson, Segura, Cano, Cruz, and Seager most nights is pretty significant.
Yep, totally agree. The biggest question mark for me (where I’ll admit I’m majorly biased) is Cano. Yeah, it logically makes sense that Cano would regress based on aging curve, going from 6 WAR to 3.6 WAR according to ZiPS is awfully steep.
Then again, he did have a 2.1 win season in 2015 so…
As someone who has been watching the M’s since 1977, you know what? It’s somehow still not going to make any difference.
When I think of the phrase “1,2 punch” I think of things that are deployed in a combination that are similar. I personally think this would necessarily remove the mixture of pitchers and hitters together, since it is hard to justify some sort of combination between the two. Rizzo/Bryant and Kershaw/Hill fell more like proper combinations rather than Betts/Sale or Kershaw/Seager. After all the purpose of the 1, 2 punch is to get a couple hits in succession.
Then again, I feel like that has been explored as well.
Exactly – I logged in specifically to make this point, but I see you made it for me.
I definitely came with the same expectation, but I was pleasantly surprised to see that it wasn’t that. I disagree that it’s hard to justify defining a pitcher/hitter combination as “1, 2 punch” at all.
Kershaw mows them down in the top of the inning, Seager leads off the bottom half with an XBH if you’re talking real back to back sequences. Sale goes 8IP 0ER 10K, Betts is 3/4 with some pretty defense if you want a 1, 2 punch during a game. And like this article details, sabermetrically we have full season 1, 2 punches in terms of WAR. It’s cool to see the variety of types of 1, 2 punches.
Here is what I get for 1-2 punches, pitchers only, using Depth Charter projected fWAR:
10.2 LAD
10.1 WSN
9.6 CLE
9.5 NYM
9.4 SFG
9.3 BOS
8.6 CHC
7.6 TEX
7.5 HOU
7.3 NYY
7.3 CHW
7.3 DET
…
1-2-3
13.1 BOS
13.0 CLE
13.0 WSN
13.0 LAD
12.7 NYM
12.5 SFG
11.9 CHC
10.5 HOU
…
1-2-3-4
15.6 CLE
15.6 LAD
15.5 WSN
15.4 NYM
15.4 BOS
14.8 CHC
14.8 SFG
…
1-2-3-4-5
17.5 LAD
17.4 WSN
17.3 CLE
17.2 BOS
17.1 NYM
16.6 CHC
16.1 SFG
…
Excellent article. But with all due respect to those projections, Mike Trout has posted less than 9 WAR in one of his 5 non-rookie seasons. I’ll take the over on 8.2 WAR.
The projections basically have to somehow consider the possibility he, say, gets hurt and only (“only”) puts up 4 WAR because he misses time or plays through injury.
Basically, all these players have an “if everything goes right” talent level higher than the projection, and yet, taken on the whole, these projections will probably accurate overall.
Stated another way, Trout has a skewed distribution. His 50th percentile projection may be like 9.0 WAR, but there is more room to fall short of that than to exceed it, so a mean projection will necessarily be lower than the 50th percentile.
Yeah I get that. And I think the projections are great. But when you look at the fact that 7.4 WAR would be Kershaw’s third best season, it just seems to me that Trout’s projection skews a bit lower relative to his probable, true-talent outcome, even when considering injury and other variability. Maybe the projection system struggles to continuously project an extreme outlier even when a player has demonstrated that its his true-talent level. The fact that Kershaw is coming off of a season where he was injured for a significant amount of time and Trout isn’t only reinforces that point.
He’s bound to have a season that disappoints the crap out of all of us and only end up with 6.3 WAR.
Barring catastrophic injury or illness, not before he’s 30.
Why would it need to be catastrophic. A sore thumb that affects his grip on the bad could destroy a lot of value. There is also no reason to think he may just have an amazing year for every other player, but subpar for him, just based on chances.
Nothing is a given, even Trout.
Just to be pedantic, Trout was still a rookie in the first of those five seasons.
Rougned Odor demands to be in any discussion about a one-two punch. Especially if he’s playing the Blue Jays.
My literal first thought was “Mike Trout and someone else from the Angels.”
It’s like that bit of hockey trivia: who’s the highest-scoring set of brothers in NHL history? Wayne and Brent Gretzky. Brent had 4 points in his brief career. And they still lead the 2nd place Richard bros by 850 points.
Or the brothers with the most HR… Hank and Tommie Aaron with 768
And JC, the Cubs, Dodgers, and Indians are loaded. LOADED.
Great fun article! I’m just curious how’d the graph look if we took another arbitrary number, let’s say top 5 players for each team and if looks any different.
Or maybe another way to measure depth, what the graph would look like if we looked at the 5 worst players out of their 25.
There just isn’t going to be much of a range of outcomes for the bottom 5, because those players are widely available and if they’re more than 1 WAR players they won’t be bottom 5 to start with.
That, and middle relievers don’t generally accumulate much in the way of WAR.
Square root root for the home team…
Seems to me expanding on the above analysis, that a function of top players (however many) divided by projected playoff chances would be an interesting article. Would be some sort of team durability measure. This could be done with or without generic or assumed replacement players waiting. Just an idea, thanks for the fun read.
The title doesn’t really fit. A pitcher and hitter combination is really a one-two punch. I was expecting the team with the best #1 and #2 starters, although two consecutive batters in the lineup or the setup man + closer would also fit.