Author Archive

August Fagerstrom FanGraphs Chat — 3/29/16

11:49
august fagerstrom: Heyyo! Chat begins at noon. Soundtrack: Mogwai — Mogwai Young Team

12:02
august fagerstrom: Alright, let’s do this

12:03
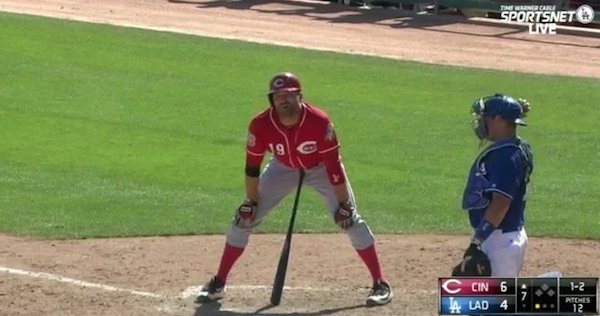
Bork: Is Joey Votto’s new uh…batting stance…the best thing ever?

12:03
august fagerstrom: Yes, yes it is.

12:04
august fagerstrom:

12:04
august fagerstrom: “I’m thinking.” is the greatest response he could’ve possibly given. I love the idea that he thinks so hard he has to bend over

Read the rest of this entry »


The Crowd: Angels Have Riskiest Roster in Baseball

Last week, I ran a little crowdsourcing project in which I asked you all to assign some made-up risk points – between one and five of them — to each and every roster in the major leagues. It was inspired by a passing comment from my weekly Tuesday chat, and it got me thinking about overall team volatility.

And, perhaps volatility is the word I should’ve used, rather than risk. I asked people to consider factors like average age of the team, proven vs. unproven players, injury risks in key contributors, and organizational depth. But risk implies you’ve got something to lose, and so even though I included a disclaimer that read, “This isn’t about how good or bad a team is. The Braves shouldn’t automatically be more risky than the Cubs just because they’re a worse baseball team. Try and think of each team’s amount of risk in a vacuum, relative to its own general skill level,” I should’ve known that, since the Braves aren’t really risking anything this year, they’d show up with a low risk rating no matter what.

So I probably screwed up my own project with a poor word choice and skewed the results a little bit, but we can still talk about some pretty interesting nuggets of information that came out of the results, and if you’re interested in reading that, well, you’ve come to the right place.

Getting back to that projected performance vs. projected team risk topic, here’s a graph plotting the two against one another:

RiskGraph1

The average risk rating was exactly 3.0. Definitely, worse teams were given lower risk ratings, and better teams were given higher risk ratings. Only three teams projected for a record better than .500 had significantly below-average risk ratings. The six worst projected teams in baseball had risk ratings barely above 2.0.

You see that dot way out on the right, though, and that’s the dot that was at the heart of this whole project. The point was to find the team you all found most risky, and no matter what the results were, there was always going to be a team. That team was the Los Angeles Angels of Anaheim, with a weighted risk rating of 4.3.

Read the rest of this entry »


2016 Positional Power Rankings: Starting Rotations (#16-30)


And now for the moment you’ve all been waiting for, the Positional Power Rankings of starting rotations before they actually get good.

SP1630

It should be noted that the Diamondbacks’ rotation at 16 really projects no differently than the Rays’ rotation at 15, which Jeff will be writing up in his More Important post on the 15 best starting rotations. Which, in fact, serves as a useful reminder that, when dealing with the 7-10 moving parts of which these rotation depth charts typically consist, the actual ranking of teams matters far less than the grouping of teams. We can be pretty certain that the No. 16-ranked Diamondbacks rotation, projected for about +13 WAR, is better than the No. 30-ranked Braves rotation, projected for just +7 WAR. It gets a little cloudier in the middle, though, and just because the A’s (+11.3 WAR) are three spots ahead of the Tigers (+11.0 WAR), that shouldn’t be taken as any kind of definitive statements of Oakland’s superiority. A guide, is how these rankings should be used.

#16 Diamondbacks


Name IP K/9 BB/9 HR/9 BABIP LOB% ERA FIP WAR
Zack Greinke 212.0 8.3 1.9 0.8 .294 76.8 % 2.91 3.20 4.6
Shelby Miller 183.0 7.5 3.1 1.0 .296 73.7 % 3.84 4.08 1.9
Patrick Corbin 160.0 7.6 2.3 0.9 .303 73.0 % 3.58 3.65 2.5
Rubby de la Rosa 141.0 7.3 3.0 1.1 .302 71.2 % 4.24 4.26 1.2
Robbie Ray 129.0 8.6 3.7 0.9 .306 72.8 % 3.86 3.89 1.7
Archie Bradley 85.0 7.5 4.5 1.0 .303 70.3 % 4.54 4.56 0.4
Zachary Godley 28.0 7.3 3.5 1.0 .301 70.8 % 4.27 4.31 0.2
Tyler Wagner 19.0 6.2 3.4 1.2 .301 70.1 % 4.67 4.75 0.1
Josh Collmenter 9.0 6.0 2.1 1.2 .292 73.3 % 3.94 4.28 0.1
Total 965.0 7.8 2.9 1.0 .300 73.2 % 3.75 3.88 12.7

So, the team that lost Zack Greinke this offseason is tied for first among projected starting rotations. The team that gained Zack Greinke is hanging around the middle of the pack. This tells us a couple useful bits of information, the first being that that Clayton Kershaw fella is quite good. Kershaw alone accounts for the same projected WAR total as Miller, Corbin, de la Rosa, Ray and Bradley combined, and the Dodgers still have other pitchers, too. As for the Diamondbacks‘ position on this power ranking, it gives us an idea as to why, even with Greinke, many are still skeptical of the organization’s position as a legitimate contender in a competitive National League.

One caveat, in the Diamondbacks’ favor: they have one of the largest differences between their projected ERA and FIP. The sixth-largest, in fact. That is to say, if these rankings were sorted in order of RA9-WAR, rather than FIP-WAR, the Diamondbacks would stand to gain more from it than most every other team. Greinke was worth 10 RA9-WAR last year, and would see his projection increase by a full win if we went with the runs-allowed model. Shelby Miller also has the early signs of being a FIP-beater, and his projection would increase by nearly a win with the RA9 model.

So maybe the top half is a bit underrated, but the bigger issue lies within the bottom half. Rubby de la Rosa is now entering year three of “maybe that 95-mph fastball will miss some bats soon!” and this could be his last chance. Nearly all of Archie Bradley’s prospect sheen has worn off, and at this point the Diamondbacks might be happy if he winds up being a serviceable fourth or fifth starter. Zack Godley had a shiny ERA last year, but still has major command issues and was a 25-year-old who started last year in High-A for a reason. The top three can go pitch for pitch with most trios in baseball — Patrick Corbin looked every bit the budding-ace of 2013 after returning from Tommy John — but if any of them suffer prolonged injury, or de la Rosa pitches his way out of the rotation, Arizona could be handing out less-than-ideal starts in the midst of their playoff hunt.

Read the rest of this entry »


Crowdsourcing Team Risk

In my Tuesday chat this week, a commenter asked me about the Mariners bullpen, which has already endured some key injuries this spring. I responded as such:

Screen Shot 2016-03-25 at 9.31.19 AM

Six of 10 worry points is more than half the worry points. I can’t say for sure even how worrisome that is, because worry points are a thing I made up at 12:27 p.m. EDT on March 22, 2016, but I can say for sure that it’s more worrisome than a team whose bullpen deserves just four out of 10 worry points.

People seemed to like the worry-points concept, and a few commenters expressed a desire for a worry-point article, with a couple even giving me ideas. I didn’t use either of those specific ideas, but the silly worry-point concept did get me thinking about team risk, and how that can influence our perception of different ballclubs before the season begins.

Like, say you’ve got two teams, each projected for 85 wins. But one of those 85-win teams has one super-elite star that comprises a bunch of their value on his own, and therefore that team is just one injury away from losing a big chunk of those projected 85 wins. And not only that, but the supporting cast around that star is littered with players over 30, guys with past injury histories, and a couple guys coming off bad seasons who are being counted on to bounce back. The other projected 85-win team, on the other hand, is pretty clean — lots of guys in their 20s, little injury history, everyone is coming off pretty standard seasons.

On pure talent, both teams are projected to be equal, but that first team has worry points through the roof. It’s easy to see where things could go wrong. The other team feels safe. This could wildly change our (sub?)conscious perceptions of these otherwise equal-looking teams.

I’m kind of thinking about the Dodgers right now, but I’m also kind of not. I’m mostly wondering what the spread is? Every team has areas of concern. Some seemingly more than others, but then at the same time, every team has guys who feel as safe as can be that will inevitably become injured or underperform this year. This game is almost impossible to predict.

This is going to be one of those posts Jeff likes to run with a bunch of polls and then a crowdsourced follow-up, because the opinions of 1,000 of you on something none of us really know about are worth more than the opinions of one of me. Who am I to assign worry points to every team in baseball? The results of this will be interesting now, and they’ll be interesting later. You’ll all put your brains together, and you’ll determine a handful of teams that seem riskier than the rest, and a handful of teams that seem safer than the rest. And at the All-Star break and at the end of the season, it will be interesting to look back and see what happened to those risks. Did the risky teams succumb and/or underperform? Did the safe teams stay clean and/or overperform? Will there even be a noticeable spread in the results of this poll? Is any one team actually riskier than another? These are all questions I can’t answer on my own, but would like to see answered. I’m thankful not only to write for an audience, but a smart and engaging audience.

Read the rest of this entry »

Aaron Sanchez’s Place in Toronto’s Rotation

Aaron Sanchez wants to be a starter. Most pitchers want to be a starter. Jesse Chavez and Gavin Floyd want to be starters, too, and they all might deserve it, which is the current conundrum in Toronto. Not that having too many qualified starters is a bad thing, per se, but it presents the team with some tough choices, choices that could complicate things down the line.

At the very least, Toronto can feel good about their depth. The top of their rotation might not match the firepower of their contending peers, but they’ll be sending two seemingly competent starters to the bullpen at the end of Spring Training, with Drew Hutchison heading to the minors as perhaps the eighth starter on the depth chart.

As I’m writing this, I’ve come upon a tweet by Jon Heyman who was present in Blue Jays camp the other day and reported that Chavez is set to the head to the bullpen, so in fact it looks like the last rotation spot is down to two. And Chavez to the pen makes sense anyway; he’s had the worst spring of the three, for what it’s worth, but more importantly, he’s done the swingman thing in the past. Each of the last two years, he’s seamlessly shuffled between relieving and starting — not something everyone can do — and so he doesn’t necessarily need to be stretched out right now to be able to contribute to the rotation later down the line. And Chavez will need to contribute to the rotation later down the line. Pitching is fickle.

So we’ve got Gavin Floyd and Aaron Sanchez, and in that same Heyman tweet I linked, he seemed to suggest Floyd has the leg up on the last spot. Sometimes with Twitter, it’s hard to tell what’s being reported and what’s being speculated, but there’s clearly some sort of sense that Floyd could be the leader in the clubhouse.

Read the rest of this entry »


The Area Where Khris Davis Became Chris Davis

Chris Davis earned a seven-year, $161 million contract with the Orioles this offseason. Khris Davis was traded to the A’s for a couple low-minors prospects. Chris Davis is a lefty, and plays first base. Khris Davis is a righty, and plays the outfield. Chris Davis has been the best power hitter in baseball. Over the last three years, his .292 isolated slugging percentage is nearly 20 points higher than the next guy, and he’s got 15 homers over runner-up Nelson Cruz. Khris Davis has been a tantalizing, yet in many ways still flawed player whose shine has somewhat faded after an explosive debut with Milwaukee in 2013.

Yet even with those flaws, namely struggles with contact ability and plate discipline, one might be surprised to learn that Davis — sorry, Khris — has also been one of the league’s most prodigious power hitters, with an ISO that ranks in the top 10 since 2013. Since Khris came on the scene, he’s hit for more power than Bryce Harper, Miguel Cabrera and Jose Abreu. Granted, injuries, defensive shortcomings and his one-dimensional nature at the plate have limited his playing time, so perhaps his power output isn’t quite as impressive as his slugging peers who have done it for longer, but he’s now batted more than 1,100 times and done so with an ISO that’s indistinguishable from Paul Goldschmidt’s. The power is real, and just last year, he took a step forward in one promising area to put his name alongside the game’s premier power hitter, the Chris with a C.

Read the rest of this entry »


August Fagerstrom FanGraphs Chat — 3/22/16

11:52
august fagerstrom: happy Tuesday!

11:52
august fagerstrom: chat soundtrack: El-P – Fantastic Damage

11:52
august fagerstrom: be back in 10!

12:06
august fagerstrom: sorry guys, need a few more minutes before I begin. will go extra today

12:14
august fagerstrom: ok! apologies. lets begin

12:16
Bork: How crushed would Cleveland be if Lebron opted out and signed somewhere else? HE UNFOLLOWED THE CAVS TWITTER!!

Read the rest of this entry »


2016 Positional Power Rankings: First Base


You know the drill by now. If you don’t know, now you know. We’ll now look at a graph of projected team WAR at first base, reflect briefly, then reflect verbosely.

Graph:

1B

To reflect briefly: It will all be over soon, Phillies fans. You’ve been great.

We’ve got four distinct tiers here. The “no worries here” tier, which features six star first baseman and a seventh star pairing, the “average-or-better” tier, which features eight solid regulars and a possibly questionable projection, the “meh” tier, which features plenty of platoons and sadness, and the “Ryan Howard” tier, which features only sadness.

To reflect verbosely:

#1 Diamondbacks


Name PA AVG OBP SLG wOBA Bat BsR Fld WAR
Paul Goldschmidt 672 .289 .399 .527 .388 34.3 1.3 7.3 5.5
Yasmany Tomas 28 .262 .298 .422 .311 -0.3 0.0 -0.3 0.0
Total 700 .288 .395 .522 .385 34.0 1.3 7.0 5.5

So you wanna build the perfect first baseman? Well of course, we start with the bat. If first basemen have one job, it’s to slug, and so our perfect first baseman’s gotta slug. Paul Goldschmidt just led all first baseman in slugging, so our first selection will be his power. But we don’t just want power, we want a keen eye and the willingness to take a walk — the kind of skills that perpetuate a high on-base percentage and feel like they’ll age well. We might be inclined to take Joey Votto’s discipline, but Goldschmidt’s actually got the exact same approach, so we’ll make it easy and take his eye, too. But we want a first baseman, not a designated hitter, and we want a first baseman who will last, so we’re gonna need some defense. Last year, Goldschmidt’s tDEF (my simple man’s go-to runs saved metric — just an average of UZR, DRS and FRAA) was +12, four runs better than any of his peers. He actually beat the first-base positional adjustment. So let’s take Goldschmidt’s glove. And because we’re greedy, we want a first baseman who can run, too, and no first baseman even come close to running like Goldschmidt.

What’s the perfect first basemen look like? Paul Goldschmidt’s bat, Paul Goldschmidt’s eye, Paul Goldschmidt’s glove and Paul Goldschmidt’s legs. Diamondbacks are doing alright here.

Read the rest of this entry »


The Troubling Derek Norris Trend

The San Diego Padres were the most active team in baseball last winter, as newly-minted general manager A.J. Preller put his mark on the franchise with a mind-numbing mass of moves that aimed to quickly turn the Padres into a contender, mostly by injecting a bevy of ever-coveted right-handed power bats into a previously punchless lineup.

The plan didn’t work, for a host of reasons neither here nor there, and now a new plan has emerged. Justin Upton walked to free agency, Craig Kimbrel was shipped off to Boston, Wil Myers got out of center field, and Preller might not be done jettisoning the very players he acquired last year, the ones who were supposed to form The Next Good Padres Team.

Last week, Evan Grant of the Dallas Morning News reported that the Texas Rangers continue to covet an upgrade at catcher, though their top target may not be Milwaukee’s Jonathan Lucroy, as previously expected, but rather Padres’ backstop Derek Norris. The Rangers like Norris because he’s cheaper than Lucroy, he’s got an extra year on his contract, and the Padres have more pieces that could be packaged together with Norris to make for a potential blockbuster deal.

While Norris may not be the same caliber player as a healthy Lucroy, he would presumably offer an upgrade over Texas incumbent Robinson Chirinos, both behind the plate and with the bat, while also providing much-needed depth. But the glove has only been a plus for one year — Norris graded as a well below-average pitch-framer before last season — and the deeper you look into the bat, the less promising it becomes. And evidently, pitchers around the league agree.

Read the rest of this entry »


Jackie Bradley’s Measured Pursuit of a Record

Even Jackie Bradley couldn’t have guessed it. Before the start of the 2014 season, the Red Sox outfielder told the Boston Herald’s Jason Mastrodonato that he wanted to steal more bases. That’s become something of a Spring Training trope over the years, but Bradley did his best to keep good on his word and went 8-for-8 in steals.

Bradley’s a former running back who certainly has the speed to steal bases at the major league level, but lacked the instincts and experience to do it at an efficient clip. He was just 31-for-49 (63%) in the minor leagues, well below the major league average success rate of 73%. He knew he had the explosiveness, likening the necessary jump of a base stealer to that of a running back accelerating to hit a hole. He just needed to get better at identifying the pitcher’s movements and understanding the profitable situations to take off.

Seems he’s done a good job. Jackie Bradley Jr. is 13-for-13 on steal attempts to begin his major league career.

It may not seem like a large number, but since the beginning of the expansion era in 1961, Bradley’s perfect 13 is tied for the 11th-longest streak to begin a career, and is halfway to the record:
Read the rest of this entry »