Author Archive

Daily Graphing – Brad Lidge

There's been a lot of talk recently about the reason for Brad Lidge's NLCS game 5 blown save. One of the most common answers to that one blown save has been, “he's overworked”. Let's see if the numbers will back it up.

Pitch

Here we have a graph of the number of pitches he's thrown comparing it towards his K/BB ratio for all of 2005 including the playoffs. There's no doubt that he has been worked harder recently than any other time this year. It also kind of looks like a higher work load does have an effect on his K/BB ratio, but to be perfectly honest, I don't think it's a whole lot to worry about. His rolling 15 game K/BB ratio has never reached a worrisome level this season.

One other thing of note is that his overall season work load is down from 1475 pitches, to 1138 pitches. If we take a look at his 2004 season, you can see that Brad Lidge has been capable of a higher sustained workload with little to no effect.

Pitch

I think Brad Lidge will be just fine going into the World Series. He has worked more than usual recently, but he's had a relatively light workload this season and chances are, game 5 was just a hiccup in what should continue to be another stellar post season for the closer.


Daily Graphing – Carlos Beltran

Bob Nightengale of USA Today is reporting that the Red Sox have offered Manny Ramirez to the Mets for Carlos Beltran. If this were to happen, talk about a blockbuster trade! Lets take a closer look at Carlos Beltran since he's coming off such a mediocre year.

There were three areas where he dropped off significantly: walks, power, and speed. The good news is it looks like he showed real improvement in his walk to strikeout ratio towards the end of the season. It's also worth noting that he was not striking out more than in previous seasons, it's that he was walking less.

BBK

The bad news is, he never showed any spikes in power for the entire season.

BBP

On 5/21 Carlos Beltran strained his right quadriceps. Then he aggravated the injury on 6/10. Finally he had his knee drained on 6/27. It's possible that this injury could have sapped his power. However, it is quite likely that this injury decreased his stolen base output. You can't accuse the Mets of holding him back either since they had the most stolen base attempts in the National League.

I think it's likely that this was just a down year for Carlos Beltran, especially with his lingering injuries. While I think it's doubtful he'll return to near 40 HR/ 40 SB form, there's a good chance that he'll rebound to at least his 2003 season.


Daily Graphing – Mulder vs. Oswalt

Tonight's NLCS game 6 matchup of Mark Mulder vs. Roy Oswalt appears to be an intriguing one. Roy Oswalt has had about as quiet a season any 20 game winner has had. He's been absolutely phenomenal and though he probably won't win the Cy Young award, he deserves to be in contention. Mark Mulder on the other hand has had another solid season winning 16 games, but how well has he really pitched?

KBB

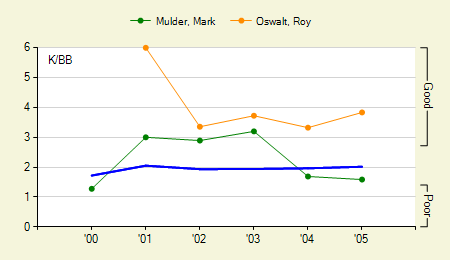
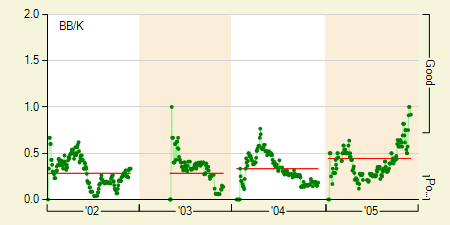
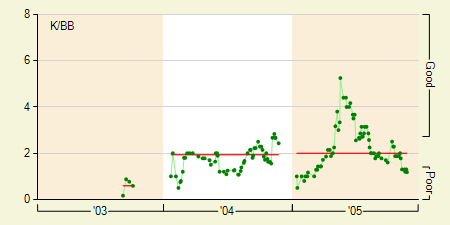
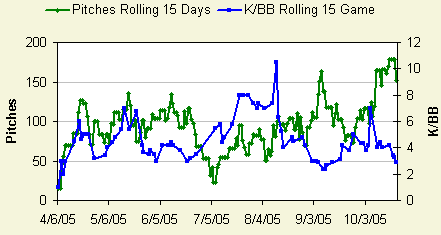
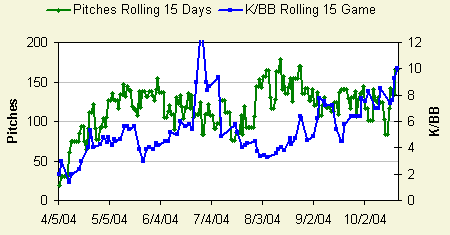
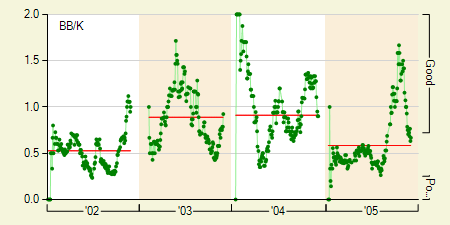
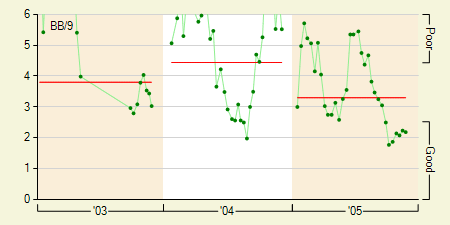
Comparing the two's strikeout to walk ratio shows there is little in common between the two pitchers. Roy Oswalt's superb 3.8 K/BB ratio (the highest of his career) shows that he has full command of the strike zone. Mark Mulder on the other hand has really dropped off in the past two years, falling to a poor 1.6 on the season. That is not the K/BB ratio of a great pitcher (let alone an average pitcher), yet Mark Mulder has a respectable ERA of 3.64 for the season.

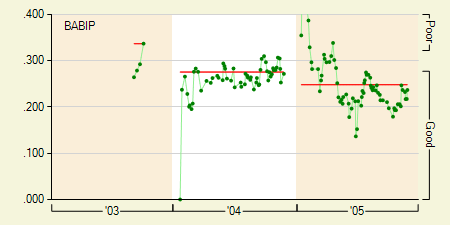
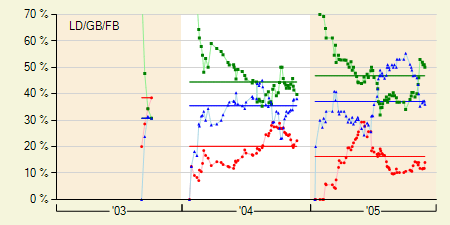
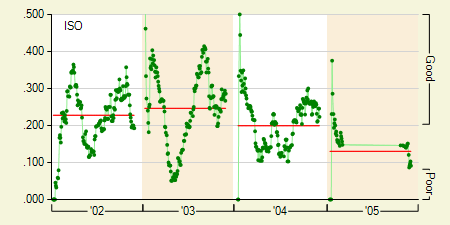
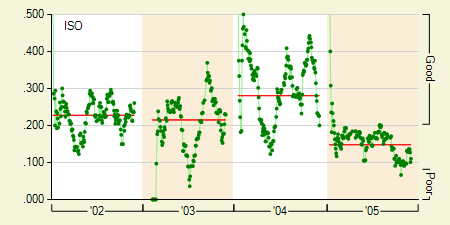
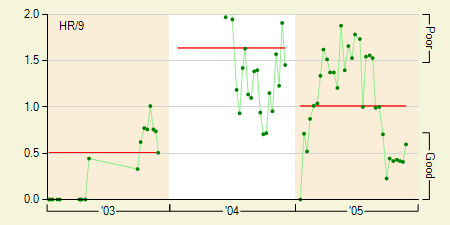
Mark Mulder's BABIP (Batting Average on Balls in Play) of .292, is a little lower than average, but in a very realistic range, so it's hard to say he's just gotten lucky. Taking a look at his Ground Ball/Fly Ball/Line Drive percentages it becomes quite clear what makes Mark Mulder successful.

LDGBFB

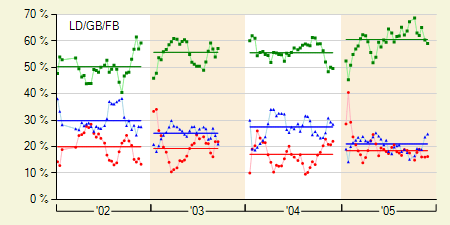
He has always been a ground ball pitcher, but he has taken it to the extreme this year. Since the damage done on ground balls is minimal, falling for extra base hits around 8% of the time, chances are any base runner isn't going to get too far. In fact, he ranks 6th highest in ground ball percentage with pitchers who pitched over 100 innings for the 2005 season. Combine 61% ground balls with the good St. Louis defense and you should have a fairly successful pitcher.

There's no doubt in my mind that I'd rather have Roy Oswalt on the mound. He has everything you look for in an true ace, and he's no slouch at inducing ground balls either.


Daily Graphing – Jose Contreras

While I was waiting for the White Sox to collapse (which never happened), Jose Contreras seemed to really figure things out by putting together 8 straight wins to finish out the season. Now usually I would take any success Jose Contreras has with a bit of skepticism. This time I think it has to be taken a little more seriously.

BB9

Taking a look at his walks per 9 innings graph, he looks to have turned a corner in his ability to throw strikes. He has been extremely inconsistent in the past but this is the lowest and longest he has kept his walks down which is extremely encouraging. The other good sign is that he seems to have learned to keep the ball in the park.

HR9

It might have taken a few years, but it seems like he is finally making good on the 4 year – $32 million dollar contract the Yankees originally gave him. With a healthy strikeout rate of around 7 K's per 9 innings, if Jose Contreras can continue to keep his walks down and the ball in the park there's no reason he won't be able to continue his success in the World Series, and next year.


Columns Section

I've added a Columns section to the site. Right now it's only going to be used for site news, but soon there will be a graph of the day column which will feature a new graph every day with additional player analysis. Hopefully this will start as soon as the World Series ends.


Using the Graphs

I've seen a few of the graphs pop up on blogs and message boards. I think this is great and please continue to use them, but there's one thing that you should know. The image links for the graphs on this site are not static (yet). Any time new data inserted into the database, the image file's date will change. This has to do with the our caching mechanism. So, if you want to use a graph, the only way to ensure that it will be permanent (for now) is to copy the image and host it somewhere else.


Some Small Changes

We've made a few small changes to the graphs. For the Daily Graphs, you will now only see the years in the range the player has played. The newer players had a lot of useless graph real estate, and there was no reason to have all the players have the same year range for the Daily Graphs. The other change was to the color of the lines on the comparison charts, which makes them a little easier to read.


Batting Average on Balls in Play

I've added Batting Average on Balls in Play (BABIP) for both batters and pitchers. This week I'm planning to upgrade the documentation by putting the glossary back up and supplying some more help on how to read the graphs.


Season Comparisons

You can now compare up to three player's season stats on one graph. You'll find this under each players “compare” tab. I'll probably begin work on comparing daily graphs a little later.

To compare Pedro Martinez, Randy Johnson, and Roger Clemens click here….


Fangraphs Launches

Welcome to fangraphs.com. We are very excited to finally launch. We have been working on this site for many months and we hope that it becomes a useful tool for baseball player analysis.

We have a lot in store for the future and plan to frequently add new features and content to the site, the first of which will be player comparisons. This will allow you to compare one stat for up to three different players on a single graph.

Please have a look around and if you have any questions or suggestions feel free to post in the forums or contact us through the use of the contact us link below.

We would also like to say thank you to Transverse Styles for the forum design, LogoWorks for the logo design, and lastly Baseball Info Solutions for being our stats provider.