Daily Graphing – Brad Lidge
There's been a lot of talk recently about the reason for Brad Lidge's NLCS game 5 blown save. One of the most common answers to that one blown save has been, “he's overworked”. Let's see if the numbers will back it up.
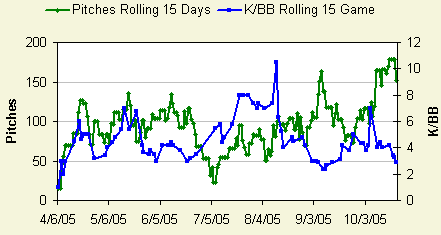
Here we have a graph of the number of pitches he's thrown comparing it towards his K/BB ratio for all of 2005 including the playoffs. There's no doubt that he has been worked harder recently than any other time this year. It also kind of looks like a higher work load does have an effect on his K/BB ratio, but to be perfectly honest, I don't think it's a whole lot to worry about. His rolling 15 game K/BB ratio has never reached a worrisome level this season.
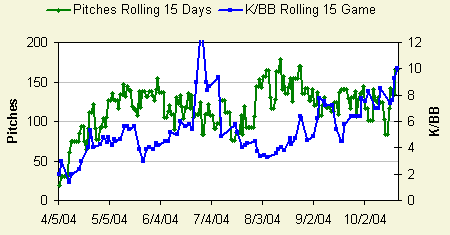
One other thing of note is that his overall season work load is down from 1475 pitches, to 1138 pitches. If we take a look at his 2004 season, you can see that Brad Lidge has been capable of a higher sustained workload with little to no effect.
I think Brad Lidge will be just fine going into the World Series. He has worked more than usual recently, but he's had a relatively light workload this season and chances are, game 5 was just a hiccup in what should continue to be another stellar post season for the closer.
David Appelman is the creator of FanGraphs.