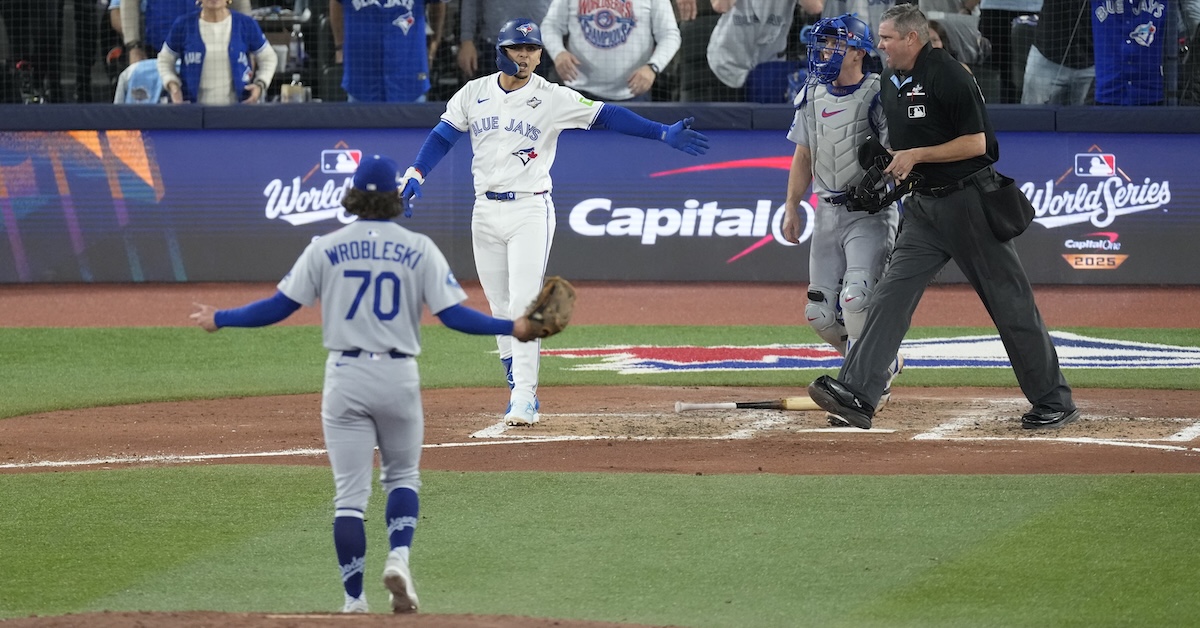
“I mean, we get that there’s extra time kind of baked in there when he’s either on the plate – when he’s either at the plate – JORDAN!”
That’s how it started. If you’ve ever wondered how a standard manager-umpire interaction goes down, well, now you know. It starts with the manager screaming the umpire’s name at the top of his lungs and waving an arm. In the bottom of the fourth inning, as John Schneider attempted to manage the Blue Jays to victory in Game 7 of the World Series while enduring an in-game interview, Justin Wrobleski started Andrés Giménez off with a fastball high and tight. It both looked and sounded like the ball might have clipped Giménez’s elbow, so midway through a measured critique of home plate umpire Jordan Baker for pausing the game while Shohei Ohtani switched from hitter mode to pitcher mode, Schneider signaled to Baker that he wanted to pause the game for a moment to check the video.
The video room told the Blue Jays not to challenge. The ball had missed Giménez. A ball and a strike later, Wrobleski lost control of yet another fastball, and Schneider once again asked Baker to pause the game. Visibly upset, the manager crossed his arms and stuck out his chin while he waited on word from the replay room. This pitch was more high than inside, and despite Giménez’s best efforts, it had once again missed him. He had tried the classic move of earning a hit-by-pitch by letting his elbow drift out over the plate in the process of turning back toward the catcher and (ostensibly) away from the pitch. Then, realizing that he’d still be a few inches shy of the ball, he just stuck his arm out artlessly. Well, it was only artless in the respect that he’d dispensed with subterfuge. The ball was slightly above his arm, so he tried to close the distance by raising first his shoulder, then his elbow, then his wrist, and finally his fingers. He was popping and locking, artfully, and when that didn’t get him high enough, he hopped a few inches into the air. Had he made contact with the ball that way, Baker would have been forced to keep him at the plate, just as James Hoye did when Aledmys Díazleaned into an inside pitch in Game 1 of the 2022 World Series. Giménez looked into the dugout with a frown, and Schneider followed suit. Read the rest of this entry »
This is the third article I’ve written about cleat cleaners. So far as I can tell, that’s three more articles than anybody else. As a result, I have spent the past two seasons completely in the tank for cleat cleaners. I’m incapable of turning on a game without assessing the situation on the mound. What color is the cleat cleaner? Can I tell which brand it is from the shape? Most importantly, how dirty is it? It’s rare to get a shot of a pitcher using the cleat cleaner, but you can still tell whether it’s being used. The evidence is right there in front of your eyes. The cleat cleaner will be filthy. The weird rubber mat that cleans cleats with cleats of its own is now staked as firmly in my heart as it is to the backslope of the pitcher’s mound.
That brings us to Monday night (and Tuesday morning). Game 3 of the World Series was a thrilling, exasperating showcase for baseball. More importantly for our purposes, it also gave the cleat cleaner a chance to shine – or to do whatever the opposite of shining is because you’re completely covered in mud – on the game’s biggest stage.
The cleat cleaner does not normally get much time in the limelight. Pitchers most often avail themselves of it right before the start of the inning. They throw their warm-up pitches, circle around to the back of the mound, take a few calming breaths, clean their spikes, then climb up to the summit and set themselves. If the broadcast has come back from commercial in time, this routine is rarely considered worth documenting. At any given time, only one shot can make it onto your television, and at least as far as directors are concerned, there’s almost always something more interesting to show than a man cleaning his shoes. Even when we do get a shot of the pitcher cleaning his cleats, we rarely see the actual cleat cleaner. The camera usually shows the pitcher from the waist up. In fact, we got one of those shots in the very first inning on Monday night. Here’s Max Scherzer using the cleat cleaner before he faces Shohei Ohtani to start the game.
Hmm. That wasn’t very satisfying, was it? As usual, you can’t see Scherzer’s feet at all. Rather than force you to take my word for it that he was using the cleat cleaner, I’ve recreated his lower half utilizing an innovative new CGI technology known as iPhone Video of Me Wearing Jeans and Baseball Cleats in My Bedroom.
Now you get it. From that shot alone, Game 3 was already a victory for all of us cleat cleaner fanatics. We actually got to see someone using the cleat cleaner during the World Series. But the cleat cleaner was just getting started. This was an 18-inning game that featured a staggering 609 total pitches. That’s not just the highest total of the season; it’s 137 pitches more than the game with the next-most pitches (Game 5 of the ALDS between the Tigers and Mariners). And each individual pitch wreaks havoc on the mound. For an example, we need look no further than the very first pitch of the game. Here’s Tyler Glasnow getting ready before he warms up for the first inning. He absolutely tears in to the mound.
The mound is made out of clay, and before every game, the grounds crew shapes and tamps it into smooth perfection, then covers it with a layer of soil conditioner. Some pitchers like the pitching rubber to be flush with the dirt, but most want to be able to wedge their cleat into a hole next to the rubber. Glasnow belongs to the latter camp, and he’s not hesitant about dredging a trench in order to get things just how he likes them. The clay goes flying every which way, and then he spanks his foot onto the mound in order to dislodge it from his cleats. All this happened before Glasnow even started his warm-up tosses. By the time the game actually started, the picture-perfect manicured mound was nothing but a cherished memory. And with every single pitch, the cleats grab some more clay and send it flying. Here’s a closeup of the very first pitch of the game. I’ve added some arrows to help you notice individual clods of mud.
You can see a small clod go flying when Glasnow raises his front foot. More clods go flying when he pushes off with his back foot. Some fall off from above when he whips it around. Others go skittering across the mound when he lands. And this is just the tabletop. We can’t see whatever destruction he causes at the front of the mound when his front foot lands. This is just one pitch, specifically the first pitch of the game, when the mound and the cleats are at their most pristine and least likely to stick. But cleats are designed to grab hold of the earth. That’s their whole job, and like so many of us, they have trouble letting go. Once there’s clay on the cleats, the remaining clay on the mound wants to stick to it too. It builds up.
If you’ve even played a game in rainy conditions, you know that it’s really uncomfortable to have your cleats fully packed with mud. It’s not just that you can’t get as much traction. It’s also that mud and clay make your shoes really heavy. You feel stuck. If you’re a pitcher, your entire delivery depends on balance, and all of a sudden, you’re trying to perform your carefully rehearsed, repeatable delivery with your balance completely out of whack. That won’t do, so you head to the cleat cleaner and make a deposit.
The cleat cleaner is exactly like the bottom of a shoe. It’s just a flat surface full of spikes designed to grab hold of big chunks of earth with maximum efficiency. If you forgot your spikes one day, you could absolutely strap the cleat cleaner to the bottom of your sneakers. It would work just fine, and you’d certainly turn some heads. When you consider the similarity between them, you realize that the relationship between the cleat cleaner and the cleat is as one-sided as you can imagine. In that sense it’s truly a selfless tool. It’s like watching a chimpanzee grooming another chimpanzee, but instead of eating the bugs it finds, it just settles them into its own fur. One day, grounds crews will invent an even bigger cleat cleaner, but until then, we get to watch the dirt build up all game long. Here’s a GIF that shows the cleat cleaner during the first pitch of every half inning during Game 3.
It sort of looks like one of those time-lapse videos of a swarm of ants devouring a piece of fruit from a nature documentary. Scherzer did a number on the cleat cleaner in the third inning, and Mason Fluharty, who replaced Scherzer in the fifth, tracked in a bunch of mud after firing his warm-up pitches. By the 15th inning or so, you can barely even see the top. It’s just a pile of mud.
It’s not just that the cleat cleaner gets completely full. Look at the havoc inflicted over the entire area. The Dodgers logo fades into nothing. Clods of clay are absolutely everywhere. That happens all over the field. Here’s a still from the 18th inning. The low angle allows you to see that the entire home plate area and much of the grass in its vicinity is covered in crumbs of mud.
After the game, the grounds crew has to remove every one of those crumbs. The home plate area and basepaths need to be perfectly smooth, and an accretion of clay would kill all the grass. They rake, they scoop with shovels, they pick them up by hand, sometimes they vacuum. And then they have to refill all the divots, which requires a tremendous amount of tamping, also by hand. It’s hard work. The tamp is a heavy tool. You raise it, you slam all that heft down into the earth, and you do it again until the ground is flat.
Brett Davis-Imagn Images
But that’s after the game. For the most part, the grounds crew just has to watch as the damage to the field that they just spent all day perfecting accumulates during the game. And this was an especially long game. For comparison, here’s a split-screen between the first pitch of the game and the 609th. On the right, you can see the few crumbs that Glasnow scattered across the top of the mound while excavating and warming up, but that’s it. The field is a lush, perfect carpet.
By the last pitch of the game, it’s a war zone. The left side of the frame is pockmarked and scarred. It’s covered in shrapnel. Every one of those little dark spots you see is a clump of clay that someone’s cleats yanked straight out of the field and then deposited elsewhere. I turned the contrast way up just to illustrate just how many of these clumps get spread out across the field over the course of the game.
It’s a whole lot, especially around the mound, because pitching deliveries are violent. They have hard starts and stops that send the clay flying all over the place. But the real dark spot is around the cleat cleaner, and by the 12th inning, I had noticed that it was in shambles. It was almost completely full of mud. I was ecstatic (and not a little sleep-deprived). The cleat cleaner was doing what so many of us try and fail to do for our whole lives. It achieved its full potential. Every once in a while, the grounds crew will come out and replace the cleat cleaner when it gets completely full, especially on a rainy day.
Scott Taetsch-Imagn Images
That didn’t happen on Monday. The cleat cleaner just kept getting more and more full. By the 14th inning, you could barely see its spikes at all. The clay was just piled on top of it. It was literally being buried. Here it is in the 17th inning. If the clay weren’t so much darker in color than the soil conditioner, you might not even know it was there. It’s just a lump of earth.
This is what it looks like when a cleat cleaner dies a hero. It’s cleat cleaner Valhalla. It was all downhill from there. Pitchers kept trying to clean their cleats, but the device was so completely buried that they tended to pick up just as much dirt as they deposited. The problem was, the game was still going on, and as it was the 17th inning of the World Series, they kind of needed to be at their best. That brings us to Will Klein.
Klein was pitching the game of his life. He threw a total of 5 1/3 major league innings during the regular season and had made just one appearance during the postseason. He had never once thrown more than three innings in a single outing over his five years in professional baseball. And on Monday, he delivered four scoreless innings of one-hit ball. It was a fairytale, except that his glass slipper was completely swamped in mud. During the 18th inning, cameras caught Klein going to the overloaded cleat cleaner three times, and because he was still slipping during his pitches, each time was a bit more violent than the next.
With two outs, after falling behind Tyler Heineman, 2-1, Klein decided that going Mortal Kombat on the helpless cleat cleaner was bringing diminishing returns. He finally gave up and went back to the old methods. As organist Dieter Ruhle played the theme from The NeverEnding Story, Dodgers ball boy Branden Vandal raced out to the mount with the trusty baseball standby of a couple of taped-together tongue depressors. The right-handed Klein cleaned off his left cleat himself, then realized there was no way to clean off his right cleat with a glove on his left hand. He handed off the tool to Vandel and leaned on the ball boy’s shoulder while the latter scraped off the accumulated clay and dirt with vigor. Klein gave Vandel a tap on the shoulder to say, “That’s clean enough,” and Vandal hustled back to the dugout. The righty retook the mound and struck out Heineman to end the frame.
Anything goes in the playoffs. Klein is a perfect example, a young player being asked to perform far beyond any reasonable expectation under the most intense pressure of his entire career. As it turns out, if the game goes long enough, the same gets asked of the cleat cleaner.
After a marathon Game 3 on Monday night (and into Tuesday morning), both the Blue Jays and the Dodgers were hoping for length from their starters in Game 4. The Dodgers looked more likely to get it. Toronto starter Shane Bieber lasted just 3 2/3 innings in Game 4 of the ALCS, his most recent start. In fact, he went more than five innings just once over his past four starts, running a 4.96 ERA over that stretch. Los Angeles starter Shohei Ohtani, well, he’s Shohei Ohtani. He had gone exactly six innings in each of his last three starts. He had allowed just three total runs over his past five appearances for an ERA of 1.01. Had Ohtani gone just six innings and no more on Tuesday night, Game 4 might have gone very differently. Instead, the Blue Jays offense exploded for four insurance runs in the seventh inning, and with a convincing 6-2 win, they pulled the World Series into a 2-2 tie.
After the prolonged weirdness of Game 3, Game 4 looked much more familiar. The starters struggled a bit early, then settled down. One team asked a little too much of its starter, then paid the price for bringing in the wrong reliever. You know, like a baseball game. The momentum certainly looked to belong to the Dodgers. They were at home, they’d won two in a row, and they had Ohtani lined up to pitch coming off some of the best performances of his unbelievable career. After a swing during Game 3 resulted in an injury that walks like an oblique strain and talks like an oblique strain and is currently being referred to as right side discomfort, the Blue Jays were without George Springer, both their leadoff man and their best hitter during the regular season. They had taxed their bullpen more thoroughly on Monday, and they had endured the psychic toll of losing that 18-inning marathon. Luckily for the Blue Jays, momentum is mostly a construct.
The Dodgers kicked off the scoring in the bottom of the second. After a one-out walk by Max Muncy, Tommy Edman ripped a single up the middle. Knowing that Daulton Varsho’s surgically repaired right arm is particularly weak, Muncy didn’t hesitate, charging around second (and nearly slipping and falling when he tried to stick the landing on a pop-up slide into third). It’s always a little bit fun to be a baserunner on the base that you’re entrusted to defend. You’re in your normal spot, but the perspective is totally different. It’s kind of like when you were a kid and your parents let you bring your sleeping bag into the living room so that you could go camping in your own house.
Sorry, where were we? The Dodgers had runners on the corners with one out, and Enrique Hernández did what Enrique Hernández does in October. He lifted a sacrifice fly into right field to give the Dodgers a 1-0 lead. The first time through the lineup, Bieber had allowed one run, one hit, and two walks. He had struck out no one. Three of the Dodgers’ seven batted balls were hard-hit.
But Ohtani was about to run into his own trouble. He only had one strikeout the first time through the lineup, and his velocity was down compared to his regular season average (though manager Dave Roberts would say during an in-game interview that Ohtani was intentionally throttling back). He hadn’t allowed much hard contact, but that changed quickly. In the top of the third, Nathan Lukes tomahawked a high fastball into right field for a one-out single. Ohtani then hung a sweeper high and right over the middle to Vladimir Guerrero Jr., who is not, strictly speaking, the kind of person to whom you want to hang a sweeper high and right over the middle. Guerrero unloaded on the cement mixer. The vicious swing sent his helmet rattling around atop his head and the baseball beyond the left field wall to give the Blue Jays a 2-1 lead:
Both pitchers started to figure it out. Ohtani allowed just one baserunner from the fourth inning to the sixth, at one point striking out four straight Blue Jays swinging. Bieber allowed just two baserunners from the third to the fourth, but he ran into trouble in the sixth. Freddie Freeman led off with a laser down the first base line that Guerrero couldn’t quite corral on the short hop. Will Smith followed up with a sharp lineout to center. After a couple hard-hit balls, manager John Schneider came out to the mound, but Bieber convinced him that at just 80 pitches, he was good to stay in the game. Teoscar Hernández immediately made him look like a liar, sending the 81st pitch into center for a line drive single. The Dodgers had runners on first and second with one out, and Schneider came back for the ball.
Left-handed rookie Mason Fluharty appeared for the third time in the series, and he slammed the door on the potential rally, inducing a fly out from Muncy and striking out Edman swinging. That closed the book on Bieber, who finished the night with one earned run over 5 1/3 innings. Despite walking three, allowing eight hard-hit balls, and striking out just three, he allowed just four hits and would end up with the win.
Ohtani’s night ended soon after Bieber’s. Varsho led off the seventh with a single to right field, and then Ernie Clement ripped a double off the wall in left center. Varsho hesitated for a moment as he rounded second base to make sure that the ball wouldn’t be caught, and ended up at third. Roberts called on Anthony Banda to get the Dodgers out of the jam. Although he’d retired 11 of the past 12 batters before the seventh inning, Ohtani’s night was over (at least, as a pitcher).
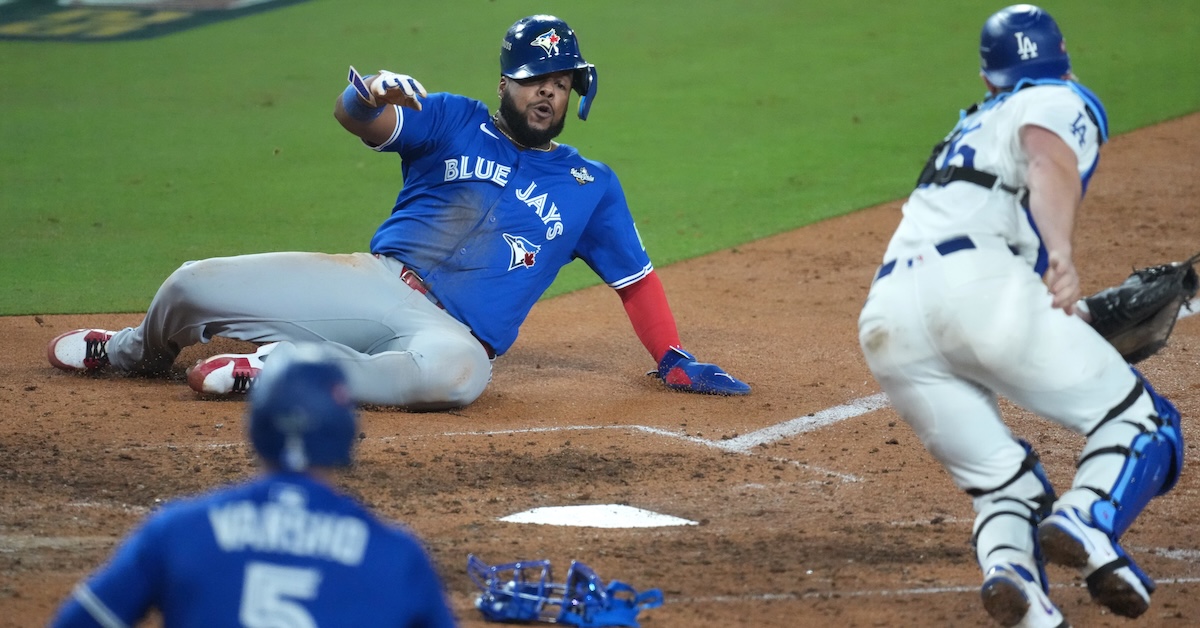
With runners on second and third and no outs, the Dodgers brought their infield in. The Blue Jays just needed to get the ball into the outfield to score a run. Andrés Giménez did just that, reaching out on a slider and dumping a single into left. The Blue Jays led 3-1 and still had runners on the corners. After Isiah Kiner-Falefa lined out (temporarily into a double play, until the call was overturned on replay), Schneider sent Ty France up to pinch-hit for the left-handed Lukes. France knocked in a run with a weak inside-out grounder to second base. That closed the book on Ohtani, who was credited with four earned runs over six innings. He struck out six, while allowing six hits and one walk. The Blue Jays had tacked on two big insurance runs to bring their lead to 4-1.
With a pair of right-handed hitters in Guerrero and Bo Bichette due up and the game threatening to get away from the Dodgers, Roberts intentionally walked Guerrero and pulled Banda. To the dismay of Dodger fans everywhere, he called upon Blake Treinen, who came into the game with a 9.00 ERA this postseason. Bichette greeted him with a rocket off the left field wall to score Giménez, and Addison Barger followed up with a single into left to score Guerrero. The haters said he couldn’t do it, and they were right. The Blue Jays led 6-1:
From there, Chris Bassitt held the Dodgers scoreless in the seventh and eighth. Louis Varland made things interesting, allowing Edman to cut the lead to 6-2 on an RBI groundout before retiring the final two Dodgers. Four Blue Jays – Guerrero, Lukes, Barger, and Clement – finished the night with two hits, while the Dodgers combined for just six hits total. They’ll still have home advantage in Game 5. With two-time Cy Young Blake Snell lined up to face rookie Trey Yesavage, they’ll have the starting pitching advantage as well. But after four games, this World Series is looking mighty even, and it’s now assured to end back in Toronto.
I honestly have no idea how many tag plays take place over the course of the average baseball game, but whatever that number may be, it felt like Game 3 of the World Series quadrupled it at the very least. We saw seven players thrown out on the bases. We saw challenges on plays at all four bases. We saw baserunning blunders, huge throws, and perfect relays. We saw aggressive sends that turned out well, and aggressive sends that led to players being thrown out at the plate by laughable margins. We saw pop-up slides that flew too close to the sun. We got a tutorial on the home plate blocking rule. We saw maybe the first ever umpire-induced pickoff. We saw the next day’s starting pitcher pull up with a leg cramp while running the bases in the bottom of the 11th inning. We saw multiple players get tagged out by a glove that caught them squarely in the Jonas Brothers. We saw the game’s 469th-fastest runner come in as a pinch-runner for the 606th-fastest runner. I could keep going.
At this point, I should mention that the litany you just read may or may not be my fault. Somewhere around the seventh inning, Meg Rowley asked me whether I might like to write about anything I’d seen during the game. I said there had been a couple interesting tag plays, so maybe it would be fun to write about them. Go back and reread the first sentence of this article. That’s when I wrote it, in the seventh inning, before like a dozen other absurd baserunning plays happened. This is how the baseball gods punish hubris, and there’s no way to delve into all these plays in one article. Even if there were, I wouldn’t be in any shape to write it, because I watched the entire 18-inning game and got like four hours of sleep last night (read: this morning). Instead, we’ll be taking a jogging tour of the tag play highlights, pointing out a few fun facts and then skating on to the next destination. Read the rest of this entry »
It has come to our attention that not all of you loved our performance during Game 2 of the World Series. This hurt us deeply, as we truly love to be loved. It has also come to our attention that some of you even blame us for the fact that the Dodgers ended up winning the game, and, well, we can’t really help you with that one. Even after much reflection and soul-searching, it’s still unclear how it could be our fault that Will Smith hit a home run 19 minutes and more than a full inning after we stopped playing. Nevertheless, all of us here at Jonas Brothers, Inc. want to make it very clear that we hear you. It had not occurred to us until our prerecorded backing track kicked in that maybe it was weird to interrupt the most important baseball game of the year for a performance that had nothing to do with baseball and little to do with anything. But we get it now. We promise to do better in the future, and we would like to explain how we found ourselves in this situation.
It’s important to understand that this is kind of a big production. We do a lot of shows. We’ve played at Rogers Centre four times now, which puts us just one behind Trey Yesavage. All those big shows require a lot of logistics. We have managers. We have handlers. We have managers for our handlers. (We call them manhandlers. It is our favorite joke.) Once you’ve gotten to the point where you’re singing into a microphone with a giant MasterCard logo on it, you’re not necessarily the one making all the decisions. The point is, we stopped asking questions a long time ago. We’ve performed at the White House Easter Egg Roll. That constituted a normal day in the life of the Jonas Brothers. Read the rest of this entry »
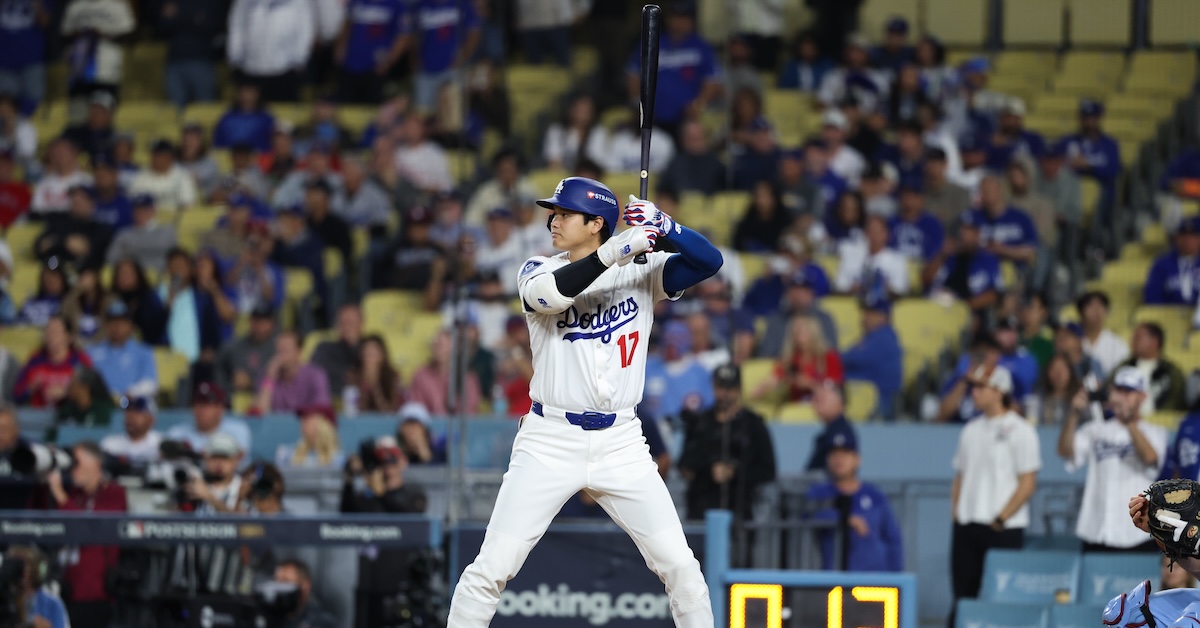
Sometimes Shohei Ohtani pulls his elbows gently to the left. He stands there at the plate still as a statue, the bat way out in front of him and his arms spread wide like they’re wrapped around an invisible trash can lid. Sometimes, every once in a while, he’ll gently rock the whole package – the elbows, the invisible trash can lid, the handle of the bat, his broad shoulders – to the left, back toward the catcher, the bat head dipping to describe a quiet circle in the air. And then he rocks the whole package to the right again, just as gently, toward the pitcher. It’s a matter of an inch or two. It’s the only sign that he’s human.
Once he’s settled into his batting stance, that little reset, rocking back and then forward like he’s absorbing a wave that no one else on the field is attuned enough to feel, is the only movement Ohtani will make. He doesn’t have a bat waggle. He doesn’t flex and unflex his fingers like Max Muncy. He doesn’t flare his back elbow like Bobby Witt Jr. He doesn’t rock his shoulders like Alex Bregman, lean back like Rowdy Tellez, twitch his hips like Juan Soto, fire his back knee toward the pitcher like Marcus Semien, or test the dirt with his front foot like Cal Raleigh. He’s a mountain, unapproachable, indecipherable. Read the rest of this entry »
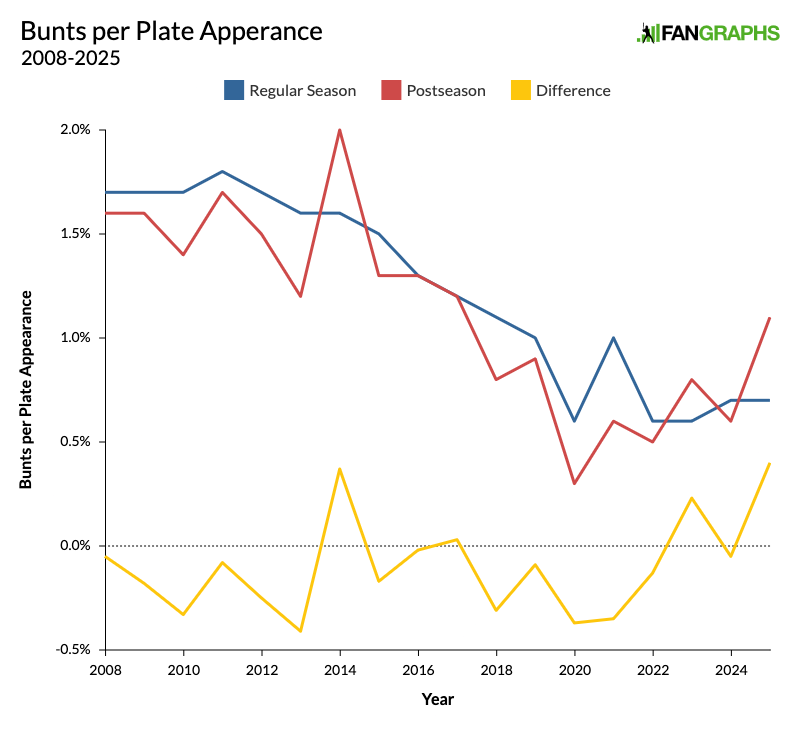
It’s alright. I’ve run the numbers, and you’re not imagining it. People really are bunting more during the playoffs. You really have been screaming “WHY ON EARTH WOULD YOU EVEN THINK ABOUT DROPPING DOWN A BUNT RIGHT NOW?” at your television more often than usual. Your neighbors have noticed. The homeowners association is going to get involved. This is an intervention.
But you’re not wrong. So far, 1.1% of all postseason plate appearances have ended with a bunt. That’s 0.4 percentage points above the regular season mark of 0.7%, an increase of 57%. It’s also the highest postseason bunt rate since 2017. Not only are we seeing more bunts than we did in the regular season, we’re seeing more postseason bunts than we have in years! That 0.4-point gap is the highest we’ve seen since at least 2008.
My job is to write about baseball, which means that in large part, my job is to generate novel circumlocutions for the word “jump.” How many times can you say that somebody’s exit velocity jumped, their whiff rate jumped, their outfield jump jumped into the 82nd percentile before your editor is tempted to bludgeon you with a thesaurus? I would prefer not to find out, as I bruise easily.
I would estimate that I write the word jump about 20 times more often than I actually jump. Nobody jumps all that much on any given day. Unless you’re at the gym, unless you’re playing sports, unless you’re a child, life just doesn’t involve much jumping. This is intentional. It is a result of the way we have structured our lives. We keep things in reach. We have downstairs neighbors. We wear complicated shoes. With the notable exception of the décor at Barnes & Noble, nearly every aspect of our lives encourages us to remain seated. Jumping in jeans is a rare occurrence. All in all, this seems like a bad thing.
Dan Hamilton-Imagn Images
Every once in a while, jumping is a matter of practicality. There’s no way I’m lugging the stepladder out from the laundry room just to get this stupid cake pan off the top shelf. I’m not tracking back five blocks just because a tiny part of this walkway is blocked by a low fence. I’ve been staring at the backs of various heads for this entire concert and I just want to get one good, unobstructed look at the band. It never occurs to us at that moment, jumping out of some mixture of desperation and exasperation, that what we’re doing could be beautiful, graceful. Read the rest of this entry »
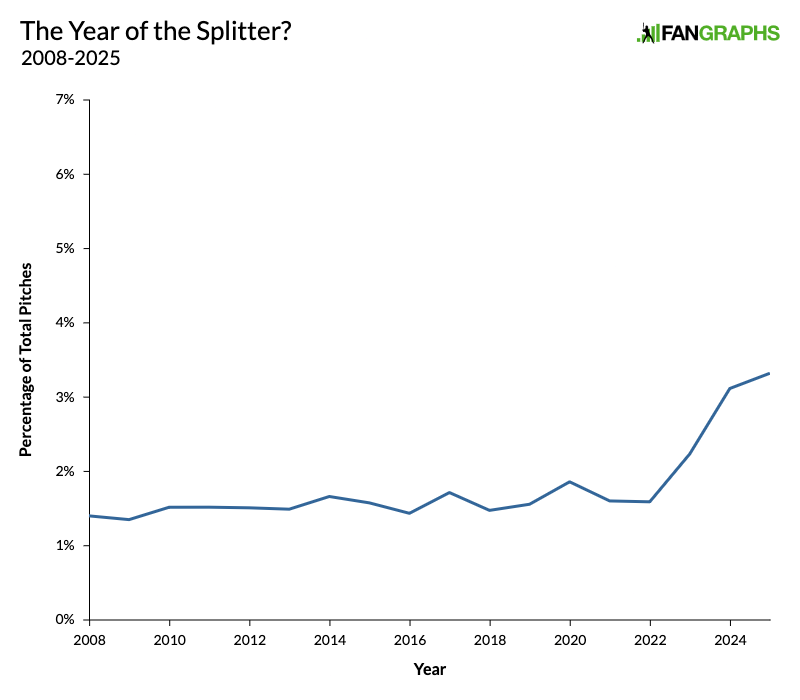
The year of the splitter has come and gone. Actually, those of us who follow these things closely know that both 2023 and 2024 were considered the years of the splitter, and then we established back in March that 2025 would be the year of the kick change. While major league pitchers ran a 3.3% splitter rate in 2025, the highest mark since the pitch tracking era started in 2008, that represented a jump of just 0.21 percentage points from 2024. It’s a difference of less than one splitter per team every three games. While the number is still going up, the big increases came in 2023 and 2024, and the pace fell off this year.
That graph makes it official. This isn’t the year of the splitter. But now let me add another line to that graph. That was the regular season. We’re in the thick of the playoffs, so let’s throw the postseason in the mix, too. If you saw that first graph and wondered why I left all that empty space at the top, well, now you know.
That’s more like it. October 2025 has seen a splitter explosion. The red line is always going to be more volatile than the blue line because the postseason is such a small sample, but even so, the playoffs have seen a 6.6% splitter rate. That’s not just the highest we’ve ever seen. It’s twice the rate for any regular season or postseason in the past 23 years. Maybe 2025 was the year of the kick change, but October 2025 is very definitely shaping up to be the month of the splitter. The playoffs aren’t even over, and we’ve already seen more splitters this October than in the postseasons of 2023 and 2024 combined. Read the rest of this entry »
The Mariners and Blue Jays came into Game 5 of the American League Championship Series knowing a five-hour flight lay in their future. What they didn’t know was which team would have a happy flight from Seattle to Toronto and which team would spend the time in the air stewing. It took a long while to figure it out. It wasn’t until the eighth inning that Seattle third baseman Eugenio Suárez finally decided to take matters into his own hands. With a two-homer, five-RBI performance, including a go-ahead grand slam in that decisive frame, Suárez powered the Mariners to a 6-2 win. They now have a 3-2 lead in the series, leaving them one win from the first World Series appearance in franchise history. They will no doubt slumber peacefully as they wing their way to Toronto for Game 6 on Sunday.
Both managers were looking to mix things up on Friday. Toronto’s John Schneider mentioned in both the pregame and postgame press conferences that he wanted to avoid the familiarity penalty by making sure his relievers didn’t face the same batters over and over again. On the other side, Dan Wilson rejiggered his lineup with the goal of “just kind of jumbling it up and creating a different look.” He moved Julio Rodríguez into the leadoff spot, dropped the struggling Randy Arozarena to fifth, kept Cal Raleigh in the two-hole, and pushed Jorge Polanco and Josh Naylor up to third and fourth. Suárez, struggling just as badly as Arozarena with a .162 batting average in the postseason, stayed in the sixth spot.
Friday’s contest featured a pitching rematch of Game 1 between Kevin Gausman and Bryce Miller, when the two starters combined for just three earned runs over a combined 11 2/3 innings. They allowed even fewer runs on Friday. Their two approaches couldn’t have been different. Gausman avoided the top half of the zone at all costs, looking to induce chases on splitters that dived below the zone and earn called strikes on four-seamers that held their plane. Miller threw some splitters of his own, but he attacked with fastballs at and above the top of the zone. He also pitched with abandon. With ace Bryan Woo in the bullpen ready to pitch for the first time since September 19 due to pectoral inflammation, Miller emptied the tank. Both his fastballs averaged roughly 2 mph above their regular season marks. The starters picked up right where they left off in Game 1, facing four hitters apiece in the first inning and pitching around doubles to the opposing lineup’s big star. Miller touched 98 mph, struck out two and gave up a double to Vladimir Guerrero Jr., while Gausman rode his trademark splitter and allowed his own double to Raleigh. Read the rest of this entry »