
This Is How You Earn (Or Lose) One Fielding Run
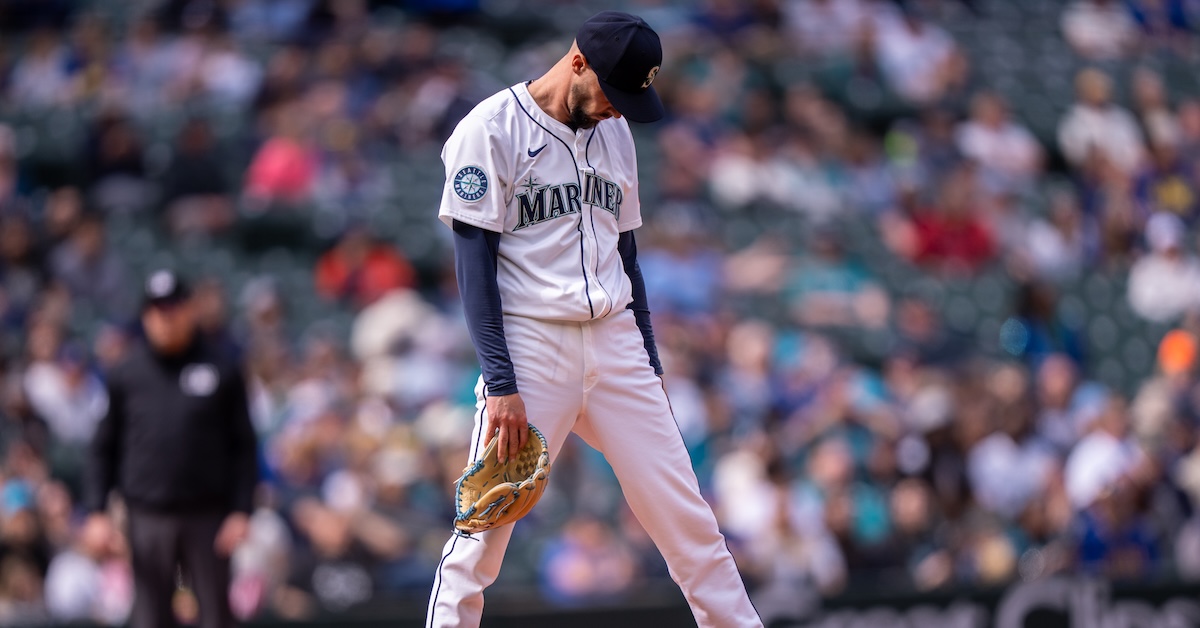
It’s April, which means that here at FanGraphs we’re contractually forbidden from overreacting to small sample sizes. Overreacting to defensive metrics, which require especially large samples before they stabilize, is an even graver offense, grounds for a written reprimand and public shaming. According to Statcast’s Fielding Run Values, the best non-catcher was worth 16 runs on defense last year. On the other hand, according to Weighted Runs Above Average, the best hitter in baseball was worth 93.8 runs. The sample sizes on defense are a lot smaller and most of the chances are routine, which limits the impact even the best or worst defender can have on the game. However, we’re not forbidden from having fun. Although the small sample sizes make it dangerous for us to draw sweeping conclusions, they make it easy for us to get granular, and nothing says fun like statistical granularity. Today, we’re looking for one thing in particular: specific moments in which we can see a player’s defensive metrics jump or fall by an integer in real time.
Oneil Cruz has already been the most impactful defender according to DRS, racking up a shocking -8 runs over 126 1/3 innings. How did he fall into this abyss? You’d have to dig through every play he’s made this season. It would take a whole article. Maybe I will write that article soon enough, but for now, I’m interested in the other side of the spectrum. Welcome, once again, to Small Sample Size Theater.
On March 31, the White Sox shut out the Twins, 9-0, behind six no-hit innings from Martín Pérez. In the top of the ninth, Rocco Baldelli moved Edouard Julien from second base to shortstop. Julien had never before played shortstop, either professionally or in college. Utilityman Willi Castro was on the mound lobbing in eephuses at 34 mph. Whatever lies beyond garbage time, that’s where this last half inning was taking place. The baseball played in this garbage void did not matter, but nobody told DRS or FRV, and naturally, the ball found Julien. Brooks Baldwin ripped a low line drive back up the middle, right where Julien was stationed (presumably because nobody told those little positioning cards about the garbage void either):
Julien speared a big hop and spun to throw, but for some reason, he was in no hurry at all. Perhaps because he was accustomed to the extra time afforded from the second base position, he took three extra steps, then double-clutched, delaying the throw by roughly six-tenths of a second. Maybe he expected Baldwin to be coasting down the line, but he turned what should have been an extremely comfortable play into a bang-bang play and an infield single. With that, he became the only player in baseball so far to be credited with costing his team a fielding run in just one measly inning at a position.
Will Julien ever play shortstop again? If he does, it probably won’t be for much longer than he did on March 31. He was the fourth-string shortstop in this game, and he was only there because the third-string shortstop was on the mound. If he never goes back, that -1 will be next to his name at shortstop for as long as we’re around to document such things. Officially, it gets marked down as a demerit to his range going left while playing shortstop, but really, that -1 is for dillydallying. This is what -1 OAA looks like:
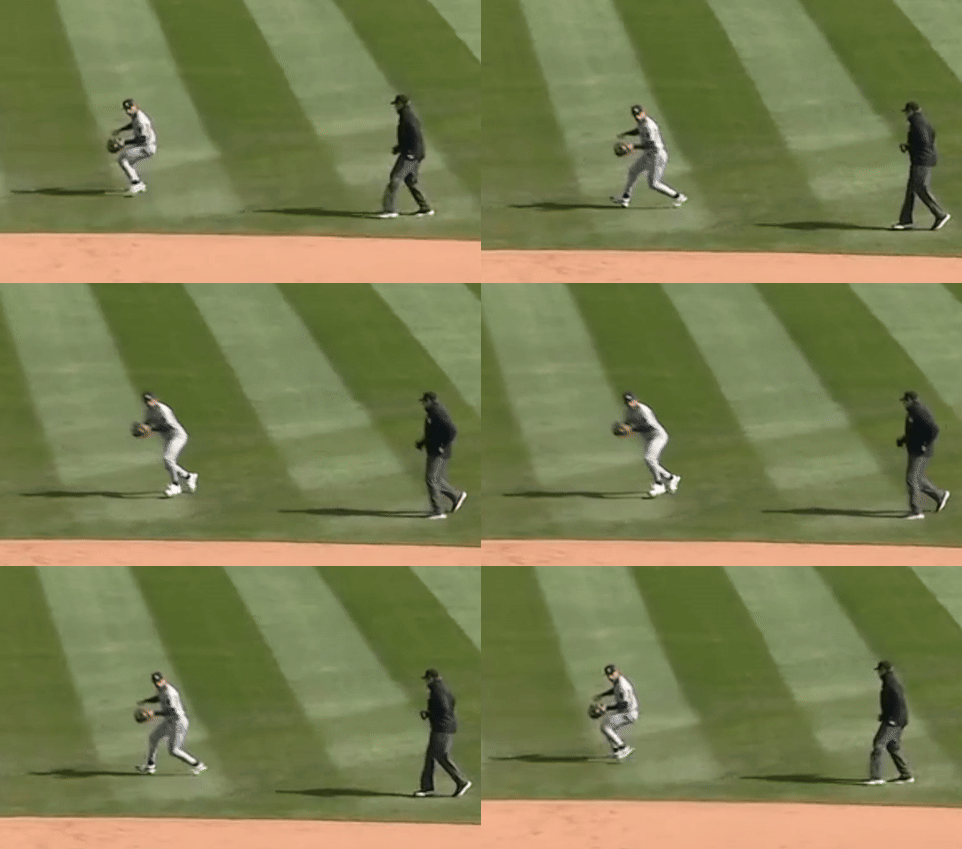
As it turns out, -1 OAA looks a lot like doing some sort of synchronized dance with a very spry umpire.
On the other end of the spectrum, Angels pitcher Caden Dana earned 1 DRS on the one ball that was hit in his direction even though he didn’t field it. Dana made just one appearance this season before being sent back down to Triple-A, allowing three earned runs in three innings of work, but saving one with the glove, according to DRS. As with Julien, one solitary hard-hit ball back up the middle was the fulcrum around which he turned from an average defender to a saver of defensive runs. Truthfully, the play might have saved two.
On April 4, with two outs in the bottom of the inning, Dana hit the outside corner with a fastball to Nolan Jones. Jones hit a very sharp comebacker that may well have been ticketed for center field, scoring the runners on second and third. Instead, Baseball Reference’s description of the play reads “Groundout: P-2B-1B (P’s Left).”
The funny thing is that deflecting a ball like that just as often – maybe even more often – helps the batter rather than the pitcher, because by the time the pitcher redirects the ball, the fielders are already breaking hard toward its original destination and it’s hard to change directions that quickly. Pitchers are often instructed to avoid making that kind of desperate stab as the ball, both because it could hurt the team and because it could hurt their fragile human bodies, which don’t react well to baseballs. In this instance, however, Dana’s reflexes were the only thing keeping his ERA in the single digits. It’s never a great sign when you’re a right-handed pitcher whose left arm is your greatest asset.
Pitcher Casey Lawrence found that out firsthand. Just like Dana, Lawrence induced a comebacker with two men on, and just like Dana, he stabbed at the ball and ended up deflecting it toward the second base position with his glove. Unlike Dana, he deflected the ball away from his second baseman rather than toward him, loading the bases:
Sometimes the ball really doesn’t bounce your way. Lawrence deflected the ball to the exact spot where the second baseman would normally be standing, but because world baseball pulling champion Isaac Paredes was at the plate, the whole infield was shifted around to the left side. Lawrence wasn’t charged with an error, but the play did earn him -1 DRS and cost the Mariners one actual run. The next batter would knock in another run on a sacrifice fly, and in the following inning, Lawrence would also allow a run on a wild pitch.
Texas’ Ezequiel Duran holds the distinction of earning 1 DRS in the shortest amount of time at any one position, though I’m not totally convinced he earned it. Duran took over second base for the Rangers in the bottom of the seventh on April 7, and he touched the ball twice during his two innings there. He started a double play on a tailor-made chopper and he caught an underhand toss on the world’s easiest 5-4 fielder’s choice:
The timing was a moderately tight on the double play, but I tend to think an average second baseman should be expected to make that play with ease. I’m sure Sports Info Solutions has solid reasoning behind its criteria for these sorts of plays, but that’s got to be one of the easier runs Duran has ever been credited with saving.
On the other hand, Romy Gonzalez very much earned the demerit he received on the one ball hit to him during his three innings as a third baseman. With a runner on first, he got a beautiful chopper for a double play ball and gave his rookie second baseman a gnarly feed. Had Kristian Campbell somehow been able to change directions and actually get in position to catch this ball, Masyn Winn’s slide might have broken him cleanly in half:
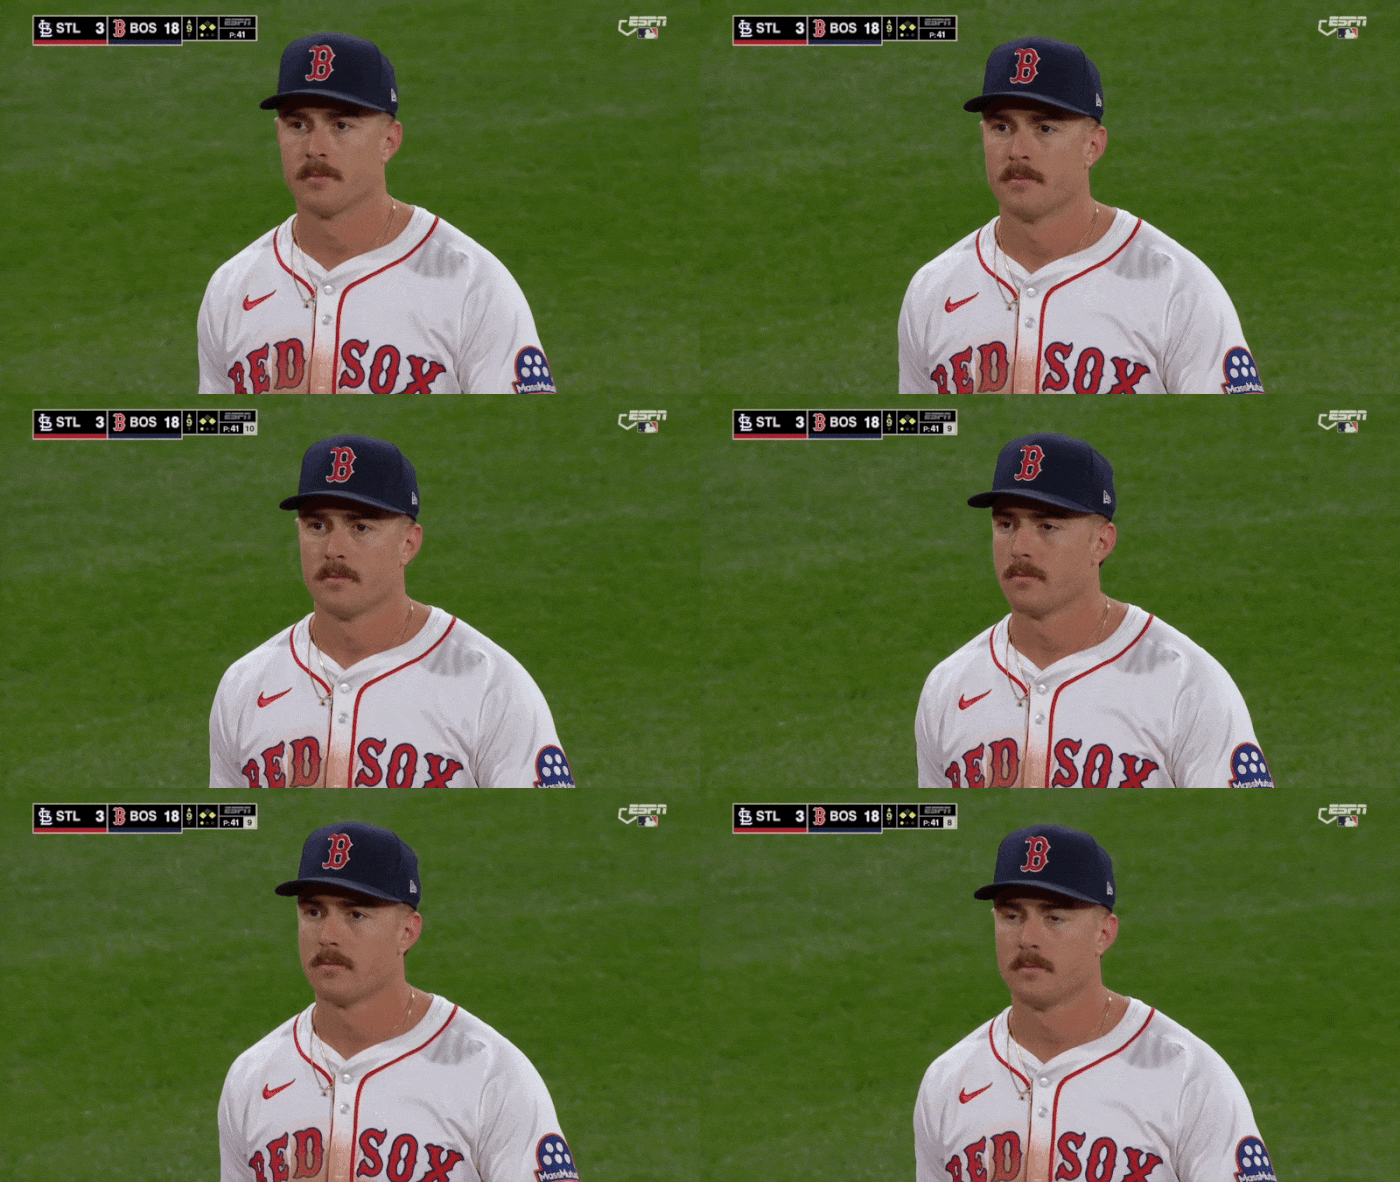
Gonzalez was one of just two players to earn the full trifecta. In his three innings at third base, he is credited with -1 DRS, -1 OAA, and -1 FRV, not to mention an error (which I suppose makes it a quadrifecta). Any time you’re making this face on national television, something has terribly gone wrong:
The other player to earn the trifecta in just three innings at one position was Nick Maton, who simply booted a routine grounder, the only ball hit in his direction during his three innings at second base.
The last player is the toughest case. Jose Iglesias has been a dependable utility infielder for years, but a rash of injuries in San Diego forced him into the outfield for the first time in his 20-year career as a professional. On April 8, he spent two innings in left field and the ball found him five different times. Two were just singles that landed well in front of him, but according to Baseball Savant’s catch probability ratings, the other balls were one-star, two-star, and four-star opportunities. That’s just not fair. So far this season, just under 19% of all outfield chances have been difficult enough to earn a star from Statcast. In just three innings, Iglesias was at 100%. It wasn’t necessarily pretty, but he handled the one- and two-star catches:
Those balls had catch probabilities of 95% and 90%, respectively, and Iglesias even made sure to throw to the right base to keep the trail runner from tagging up on the second one.
The four-star ball was a different story. It had just a 25% catch probability. When you combine those three numbers, that means the average player would have been expected to make 70% of those plays, and Iglesias did just that, catching 67% of them. He may not have looked the part, but across three chances, he played like an average left fielder. As such, Iglesias’s two innings in left didn’t hurt OAA or FRV. However, his ugly angle cost him -1 DRS. The ball really does find you:
I might object to docking Iglesias on this play, or even overall. I’m not positive that even a good angle would have allowed him to stop that ball from reaching the wall, but here he is with a -1 next to his name all the same. As the season goes on, most of these players will get more chances to stack up bigger and better numbers, but for now, the short samples allow us to pinpoint the exact moment when they turned from average defenders into something else entirely. Everyone gets a fresh start as a league average performer in every category, then we get to work dicing things up and apportioning fractions of credit a million different ways. Here in the early going, small samples and aggressive rounding allow us to see the tiny building blocks that will eventually stack up to an entire season.
Davy Andrews is a Brooklyn-based musician and a writer at FanGraphs. He can be found on Bluesky @davyandrewsdavy.bsky.social.
First off, terrific article that both was informative and had me cracking up. Second off, this does not inspire much confidence in DRS. It just seems pretty arbitrary and error-prone in comparison with OAA.
Hi Jimmy, thanks so much for reading! I certainly didn’t mean to pick on DRS. I think it’s tremendously valuable, and the fact that it sometimes differs from other major metrics like FRV and DRP, both in the way it’s tabulated and the actual results, is often a good thing. Defense is often hard to quantify. Any metric is going to have its own biases and blind spots, so it can help to have a range of perspectives.
Fair enough – thanks!
I beg to differ Dave, defense isn’t often hard to quantify, it is always hard to quantify and the various systems prove, beyond any reasonable doubt, that as long as different measuring systems continue to produce dramatically different results all are subject to significant doubt as to their value.
This is a totally unsound argument. There is an infinite number of possible wrong quantifications of anything you want to measure. This implies nothing about the existence of a right quantification.
There may very well be a right quantification but the fact remains that it hasn’t been found yet and until it is shown that there is something resembling strong corroboration between the various conflicting systems presently available I see no reason to accept any of them.
Here is a hypothetical situation. We want to know the answer to “what is 2 plus 2?” We have four candidate answers generated by four different models. The candidate answers are 17, banana, 4.01, and 500. In this situation, is it a good idea to reject all the candidates because they don’t correlate well with each other?
I don’t understand how Julien gets docked 1 run for a play that resulted in a runner reaching first. That seems too sensitive. What’s the linear weight of a single?
The difference between an out and a single is like 0.75 runs (per FG guts right now an out is -0.242 runs and a single is 0.458 runs). For infielder OAA, each out is worth 0.75 runs saved. In the outfield it is 0.9 runs. Julien got -1 OAA on that play, which would be -0.75 runs, that seems correct.
Appreciate the value added. Thanks.
Thanks. But why does it round off? Why isn’t -0.75 simply -0.75?
Also I think -0.75 would be the lower bound? So it’s only that low if there was 100% expectation of an out, right? I suppose it was pretty close to that here.
I now realize I was misreading. OAA is just outs and not runs. He lost one OAA, which is just three quarters of a run (not exactly what the headline implies, but ok). So that tracks. …if the play is rated at about 100% expectation of an out.
In the Astros-Mariners game you state this:
“Lawrence wasn’t charged with an error, but the play did earn him -1 DRS and cost the Angels one actual run.”
I know the Angels aren’t really a good team but to give up a run in a game they aren’t playing in – that’s amazing!
Hands down, the best correction I’ve ever received. Thank you!
This would actually explain a lot about the Angels. They are probably giving up a lot of runs in games they aren’t playing in. Can these be quantified?
I’m not sure iglesias should have caught that last ball, but he should definitely been at the wall sooner, allowing for a quicker relay and theoretically catching the runner at home who barely scored even with the inefficient route.
Yeah. I’m not sure how, or even whether, DRS (or other defensive stats) account for playing the carom off the wall, but I agree it’s a big part of the eye test for whether outfielders know what they’re doing — especially outfielders who need to compensate for their limited range.
OAA certainly doesn’t explicitly and their ARM value only does so implicitly, best as I can figure.
Well, I think he just lost another defensive run, as he JUST lost a popup in the sun, 1st inning Wednesday
I had collected some Statcast data to see how many balls were hit to each fielding location and generated success probability buckets. For context, I used the Fangraphs innings played a position and limited to 900 innings as a cutoff and then went and collected data on that player at specifically that position. Positions that have more platooning / subs will have less innings played overall with this approach.
Unsure of a way to put a table in Fangrahps (would appreciate somehow explaining if it exists). Take this CSV data and put it into Sheets or Excel and use data to columsn with separator ,
Position,Total Att.,Innings,Att. / 9,Success Rate,Att. 0–10%,Att. 10-20%,Att. 20-30%,Att. 30-40%,Att. 40-50%,Att. 50-60%,Att. 60-70%,Att. 70-80%,Att. 80-90%,Att. 90-100%
1B,5349,19802.7,2.43,73%,14.5%,2.7%,0.6%,3.7%,0.7%,1.1%,0.9%,1.7%,30.6%,43.5%
2B,7158,17483.0,3.68,75%,16.6%,1.1%,1.0%,1.0%,1.0%,1.5%,2.0%,3.2%,13.5%,59.1%
3B,5321,15873.7,3.02,73%,16.6%,1.3%,1.3%,1.4%,1.0%,1.7%,2.2%,4.7%,21.1%,48.7%
SS,9655,22595.3,3.85,75%,15.1%,1.3%,1.0%,1.3%,1.3%,1.9%,2.9%,5.5%,14.8%,54.8%
LF,3168,12246.7,2.33,87%,4.2%,1.8%,1.4%,1.4%,1.6%,1.8%,1.7%,3.1%,4.9%,78.0%
CF,5656,17516.3,2.91,93%,2.7%,1.2%,1.2%,1.2%,1.5%,1.5%,1.8%,3.2%,4.6%,81.1%
RF,2733,10703.7,2.30,87%,3.5%,1.7%,1.6%,1.2%,1.5%,1.6%,1.7%,2.9%,5.1%,79.3%
Sum,39040,116221.3,3.02,80%,12.0%,1.5%,1.1%,1.6%,1.2%,1.6%,2.0%,3.7%,14.6%,60.6%
Hoping this is a user friendly output but I don’t know without a preview
| Position | Total Att. | Innings | Att. / 9 | Success Rate | Att. 0–10% | Att. 10–20% | Att. 20–30% | Att. 30–40% | Att. 40–50% | Att. 50–60% | Att. 60–70% | Att. 70–80% | Att. 80–90% | Att. 90–100% |
|———-|————|———-|———-|—————|————-|—————|—————|—————|—————|—————|—————|—————|—————|—————-|
| 1B | 5349 | 19802.7 | 2.43 | 73% | 14.5% | 2.7% | 0.6% | 3.7% | 0.7% | 1.1% | 0.9% | 1.7% | 30.6% | 43.5% |
| 2B | 7158 | 17483.0 | 3.68 | 75% | 16.6% | 1.1% | 1.0% | 1.0% | 1.0% | 1.5% | 2.0% | 3.2% | 13.5% | 59.1% |
| 3B | 5321 | 15873.7 | 3.02 | 73% | 16.6% | 1.3% | 1.3% | 1.4% | 1.0% | 1.7% | 2.2% | 4.7% | 21.1% | 48.7% |
| SS | 9655 | 22595.3 | 3.85 | 75% | 15.1% | 1.3% | 1.0% | 1.3% | 1.3% | 1.9% | 2.9% | 5.5% | 14.8% | 54.8% |
| LF | 3168 | 12246.7 | 2.33 | 87% | 4.2% | 1.8% | 1.4% | 1.4% | 1.6% | 1.8% | 1.7% | 3.1% | 4.9% | 78.0% |
| CF | 5656 | 17516.3 | 2.91 | 93% | 2.7% | 1.2% | 1.2% | 1.2% | 1.5% | 1.5% | 1.8% | 3.2% | 4.6% | 81.1% |
| RF | 2733 | 10703.7 | 2.30 | 87% | 3.5% | 1.7% | 1.6% | 1.2% | 1.5% | 1.6% | 1.7% | 2.9% | 5.1% | 79.3% |
| Sum | 39040 | 116221.3 | 3.02 | 80% | 12.0% | 1.5% | 1.1% | 1.6% | 1.2% | 1.6% | 2.0% | 3.7% | 14.6% | 60.6% |
Some of my takeaways
– SS lead the way in opportunities per game, but 2B is right behind and I wonder if 2B defense is undervalued- Not 100% if Statcast is accurately putting the plays into the right success rate bucket as seems like there simply would have to be more 50/50 plays- Almost everything is routine or not playable overall, but OF in particular has everything as routine- CF specifically has a high routine and success rate. Likely due to the quality of the players out there being higher than the corners- At least from this output from statcast, you want a really steady reliable defender making the 70%+ success plays rather than a flashy player who makes mistakes but converts some of those 50 / 50 plays. Sheer volume of making 80% plays every time will accumulate more value than a handful of 50 / 50 plays- Not shown in the data as it is simply opportunities and success buckets, but OF plays have higher costs associated with them
Fangraphs formatting drives me crazy, so editing that to try to get actual bullets to show up made it worse
IIRC, Bill James in his Win Shares book (and likely elsewhere) talked about the idea of “elective” plays. Functionally, these are plays where 2 or more different fielders could make a play. I think the easiest example to understand are routine (high angle) fly balls hit towards the gaps. Generally, that deference would be to the CFer. Some of the “take it yourself/toss to the base” plays in the IF are like that, but many times the decision there is dictated by context.
Also, simply put, because of the general shape of ballparks, the space designated as “CF” is going to be larger than the corners.
What’s interesting to me is how many more attempts and many fewer “easy” attempts LF sees versus RF. LF is generally seen as a “hide-a-guy” position, but the data makes intuitive sense, as pulling the baseball –especially in the air — is increasingly valued, and there are simply more RHB than LHB. That would lead to more and harder chances — pulled balls are generally hit harder.
My takeaway here is that context matters a ton but isn’t factored into most metrics. Joulien playing out of position in garbage time with a position player on the mound shouldn’t crater his defensive value, nor should Dana get a gold star because he booted a ball he probably should have avoided. With the number of eyes on games these days, I hope the future brings some form of situational context into the metrics.
This is great
Looking forward to “Edouard Julien, Are You Playing Short Again,” the follow up to Davy’s previous hit single.
Looking forward to the Oneil Cruz article! Cruz has been doing a lot of unprecedented things, but not in a good way. It wouldn’t show up in this article but yesterday he managed to get Tommy Pham to ground into a 7-3 putout (Pham is his teammate) by not realizing that Pham’s line drive had been trapped and retreating to first, leaving Pham to stand there looking frustrated while the first baseman forced him out.
This honestly might be a play where the first baseman, Nathaniel Lowe, could be docked a defensive run–he stepped on first and tagged Cruz, who was safe because he was on the bag and no longer forced. If he’d done it the other way around I think it’s a double play.
Can you do this with baserunning too? I believe Brandon Marsh in particular lost a good deal of BsR from a pickoff/rundown.