Author Archive

Together Forever: Baseball’s Longest-Tenured Teammates

The postseason lends itself to all sorts of narratives. There are team triumphs and individual stories, but this postseason features something special you might not have noticed: a few teammates who have been playing together for nine seasons or more. When Adam Wainwright took the mound for his Game 3 start against the Braves and threw a first pitch sinker to battery mate Yadier Molina (Ronald Acuna Jr. would foul that first pitch off, but ultimately strike out swinging), it was hard to forget that this may well be Wainwright’s final season, marking the end of a career during which so many of the right-handers best moments have come with Molina behind the plate. That first pitch got me thinking: which playoff teammates have been together the longest?

To answer that question, I turned to the game logs here at FanGraphs to find the first day both teammates appeared in a game together at the major league level. I also looked at how many total games each pair has appeared in together, which includes pinch-hit appearances, pitching in relief, and defensive substitutions. This does not include any time spent on the Injured List and only includes games in which both teammates made an appearance. I excluded the postseason for parity; the data is updated through the end of the 2019 season. So, before the Dodgers and the Nationals and the Cardinals and the Braves play their Game 5’s, let’s take a look at the longest-tenured teammates we can watch this October.

No. 5: Freddie Freeman and Julio Teheran

Debut as Teammates: May 7, 2011

Kicking off our list is the pitcher/first baseman duo for the Braves. These two have been staples in Atlanta for several years now; this year Julio Teheran became the only pitcher in Braves’ franchise history to start six consecutive Opening Days. Freddie Freeman has been at first base for all of them.

Teheran was initially left off the Braves’ Division Series roster but when Chris Martin suffered an oblique injury, Teheran took his place. Now both he and Freeman are trying to push Atlanta into the Championship Series for the first time since 2001, though they’re likely both hoping for better individual performances in Game 5; Freeman, perhaps still hampered by an elbow injury, is slashing just .125/.222/.313 with a 38 wRC+ in 18 postseason plate appearances, while Teheran took the loss in Game 4 after giving up a walk-off sacrifice fly to Yadier Molina that scored Kolten Wong.

Total regular season games together: 200 Read the rest of this entry »


Jamming at the Plate: Baseball Players and Their Walk-up Songs

I was a Nationals season-plan holder for two years, and amid all the wins and losses, one thing in the game remained a constant delight: walk-up songs. Music is an integral part of a baseball game; it’s played between at-bats, after a run is scored, and also between innings. However, the best tunes are always chosen by the players themselves. A walk-up song is a crucial decision, one that could follow a player throughout the season. It should be a jam that both hypes them up and won’t be annoying when played three or more times a day.

Go to any ballgame and you will hear a dozen different walk-up songs, spanning musical genres from reggaeton to pop to metal. I remembered a wide variety of music from my days at Nats Park, and it got me wondering whether that variety was reflected throughout the rest of baseball. I decided to do an analysis of player walk-up songs, building off a similar “study” conducted by Meg Rowley in 2016, back when she was at Baseball Prospectus. MLB maintains a database of players’ chosen walk-up music. Using that, I was able to break players’ selections down by genre. Does the league as a whole demonstrate the same musical range the Nats do?

MLB Walk-Up Songs by Genre
Genre # of Songs % of Total
Rap/Hip Hop 271 29%
Rock 154 17%
Latin Pop/Fusion 139 15%
Country 71 8%
Pop 78 8%
Reggaeton 71 8%
Dance/Electronic 34 4%
Other 41 4%
Christian 24 3%
Metal/Metalcore 27 3%
House 11 1%

It does! The top genre is rap/hip-hop, while house music rounds out the bottom with 11 songs. Those listed under “other” include salsa, classical, and soundtrack music.

Now, let’s talk country. Only 8% of walk-up songs are country tunes. “Burning Man” by Dierks Bentley is the most popular, but that’s not the interesting thing about this list. When I think of hype-up music, there are several country artists who have appropriate jams. You could go with Carrie Underwood or Dolly Parton or Rascal Flatts. (Don’t laugh — I know you sing along to “Life is a Highway” any time you hear it.) I want to know why five players needed a hype song and ended up with Johnny Cash. Read the rest of this entry »


A Modern History of Self-Inflicted Baseball Injuries

In Pride and Prejudice, Jane Austen wrote, “Angry people are not always wise.” While Jane never saw a professional baseball game, her words still have relevance to the sport. Angry baseball players sometimes make stupid choices without considering the consequences of those actions. Recently, Cardinals prospect Alex Reyes broke a finger punching a wall in frustration. It turns out this has happened more than a few times in the last 15 years. These injuries are never caused by anger at other people; it is always frustration over their own mistakes. There’s that old adage about Hall of Fame hitters failing 70% of the time; these guys are humans first, baseball players second. In this case, there are three types of failure: the immediate, the prolonged, and the sort that we can laugh at.

Some of these self-inflicted injuries happen in the heat of a single moment. For example, Troy Tulowitzki smashed his bat in 2008 after being pulled from a game in the seventh inning. The bat shattered on the ground and sliced open his right palm. He required 16 stitches, but fortunately for Tulo, there was no damage to any tendons or nerves so he was only out for a couple weeks. Immediately seeing the error of his ways, he said, “This one’s kind of a stupid injury that I could have prevented.”

That is a pretty common theme; no player actually thinks what they are doing is a good idea. In 2010, Yankees starter A.J. Burnett cut open his hands as he “took his frustration out on a clubhouse door.” He allowed three runs in the second inning of a game and sustained significant cuts on his palms. He tried to pitch the following inning but was pulled because he was ineffective. Burnett was apologetic and admitted it could have been a more costly moment. He said, “I’m human, I’m not the first person to snap, I didn’t break anything. I will make my next start.”

In July of 2012, Ryan Sweeney of the Red Sox punched a door “a little bit.” He had been robbed of a hit, capping an 0-4 day at the plate, and punched a door in frustration. Sweeney missed nearly four weeks; his teammate, Aaron Cook, gave him a pair of boxing gloves for use in future fits of rage. Read the rest of this entry »


(Re)introducing a New Stat: Runs Matted In

Runs Batted In is not the most reliable measure of a player’s offensive contribution in baseball. It isn’t particularly fair to evaluate a hitter based on how many players get on base in front of him. As the great William Shakespeare once wrote, “Some are born great, some achieve greatness, and some have runners in scoring position thrust upon them.” However, RBI has given rise to one under-appreciated stat. From 2013-2016, three of the most RBI-happy hitters on the St. Louis Cardinals roster were named Matt, namely Adams, Carpenter, Holliday. This led to the creation of an unofficial fan stat known as RMI (Runs Matted In), or runs batted in by players named Matt. Having enjoyed the RMI years in St. Louis, I thought I’d check in on baseball’s various Matts, and see how they stack up in 2019.

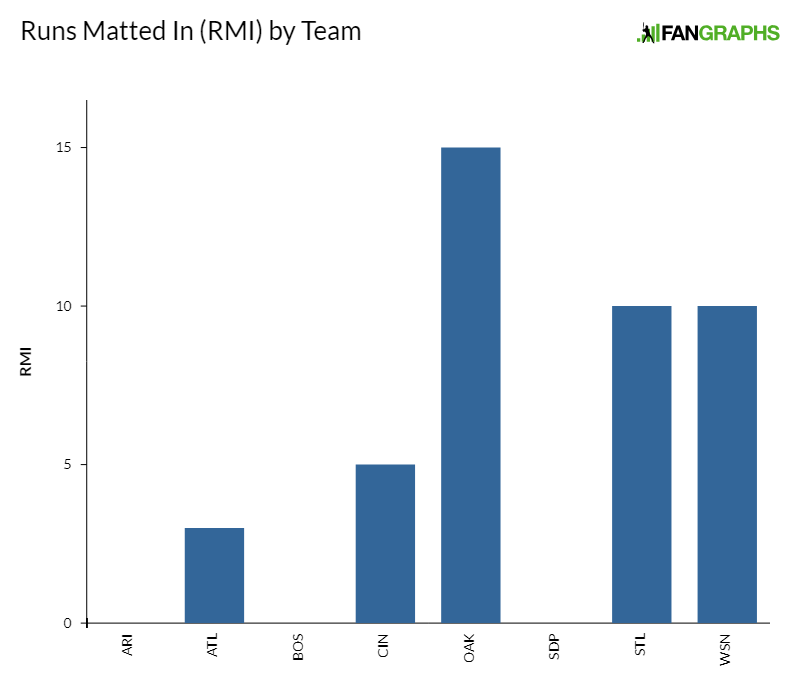
How many Matts do you know off the top of your head? Two, or perhaps three? There are actually 11 Matts with at least one plate appearance this season, making it the most common name among hitters. (Due to lack of plate appearances, American League pitchers are largely excluded from this statistic.) Let’s take a look at where we stand by team in 2019:

Not every team has a Matt, and not every Matt is a great hitter. Andriese and Koch are both pitchers for the Diamondbacks, neither of whom has so much as a hit. Barnes is one of only two Matts counted in the AL and is a pitcher for the Red Sox. He, unsurprisingly, also has not tallied a hit. Up next is Matt Joyce of Atlanta, who has Matted In three runs on the season. Then comes Matt Strahm of the Padres, another pitcher, who has two hits and a .500 average but no RMIs. Finally, there is Matt Olson, who has Matted in zero runs over six plate appearances for Oakland.

There is a three-way tie for third place in the current RMI standings, with each hitter tallying five. Matt Carpenter has played in 21 games and had 93 plate appearances, while his Cardinals compatriot, Matt Wieters, has just as many RMI while appearing in fewer than a third as many games. Rounding out the bronze medalists is Matt Kemp, who has 62 plate appearances and a wRC+ of 22 in Cincinnati. Contrast that with Carpenter’s 93 wRC+. How can three totally different players have the same number of RMI? We might speculate that RMI carries with it the same limitations as the more official, though still silly, RBI.

Carpenter has the unenviable position of hitting leadoff, a spot that notoriously lacks runners to bat in. The two hitters before him in an inning are generally first, the worst-hitting position player and second, the pitcher. He does, however, take second place among all Matts with three home runs. Four of his five RMI come from those homers, so he generates a lot of his RMIs by scoring himself, a Matt Matting In a Matt, as it were.

Playing backup to Yadier Molina is not going to yield many plate appearances, so we shouldn’t expect much out of Wieters in this category as the season progresses. However, he’s batting .333 in 11 plate appearances and has a wRC+ of 87, so while he’s still below average, he’s still making positive contributions when he can, especially by catching standards. Kemp, however, is on the opposite end of the spectrum. He bats further down in the lineup than Carpenter, and has hit .182 with runners in scoring position, yet he is at the same RMI level as the other two. Wieters has a quarter of Kemp’s plate appearances, but has Matted In the same number of runs.

Our silver medalist is the one and only Matt Adams. With ten Runs Matted In on the season and only 31 plate appearances, Big City is once again proving himself to be a force off the Nationals bench. His 84 wRC+ isn’t great, but five of his seven hits have gone for extra bases. Adams’ hits seem to come at more opportune times than Kemp’s, but does that make him better? Or could it be that as a pinch hitter, Matt Adams usually comes up with runners already on base? When it comes to RMI it does not Matt-er.

[Ba-dum tssh.]

The gold medal for Runs Matted In goes to the Athletics’ Matt Chapman. He has a 159 wRC+ in 94 plate appearances and has driven in 15 runs. He leads the “Matt Pack” with six homers in 22 games. Does that make him the Matt-riarch?

[Hold for applause.]

None of these players have similar profiles. Some hit in the middle of the order while others hit leadoff. Some hit for power while others get on base so they can be Matted In by the next hitter. Some are more Matt-ure at the plate than others. At the end of the day, you cannot judge a hitter, not even the Matts, by how many runs they drive in. It just doesn’t tell all that much.

There are other contenders for the most common name. Around baseball there are 10 hitters named Tyler and 10 named Jose, making it a tie for second place. Counting gets a little tricky once nicknames are included. For example, there are two Jacobs and seven Jakes; three Joes and five Joeys; three Johns, three Jonathans, and two Jons. The most common name with a diminutive is Michael, eight of them spanning the alphabet from A. Taylor to Wacha. They are supplemented by six Mikes, making them the quasi-leader with a total of 14.

Will you see RMI appearing on the FanGraphs leaderboards any time soon? No. But RMI is just as useful a statistic as RBI and twice as punny. As for the Matts in Arizona, Boston, and San Diego? To quote Dr. Seuss, “Your time will come, we love every Matt! A hitter’s a hitter, no matter how well they bat.”


Can Tommy Pham Repeat His 2017 Performance?

Tommy Pham had a breakout 2017, and while he remained above average in 2018, his stats took a significant hit. His past two seasons have been so good that his trade to the Rays is widely derided by Cardinals fans as one of the team’s least-astute moves of the past few years. However, entering his age-31 season, there are questions about whether he can maintain his level of production at the plate. Twelve games and 56 plate appearances into the season, Pham needs to make some adjustments if he wants to repeat 2017.

His 2017 season was outstanding, as he became the first Cardinal to reach the 20/20 mark in 13 years. He ended that season with 25 stolen bases (fourth in the NL) and 23 homers. Pham’s slash line of .306/.411/.520 was fantastic, and that .411 OBP was third in the league. His wRC+ of 148 was fifth in the league among qualified hitters and his 13.4% walk rate was ninth. However, there was a substantial dip in those stats last season.

Pham’s Hitting
Year PAs AVG OBP SLG wRC+ WAR
2017 530 .306 .411 .520 148 6.1
2018 570 .275 .367 .464 129 4.0

All of Pham’s numbers took a step back in 2018, though they remained well above average. Since it was his second full season, there could be a few different reasons for that downturn. It could be pitchers adjusting to him. Maybe it was reaching his age-30 season, and the beginning of a decline. Or perhaps his struggle with injuries in the second half was a major contributor. Maybe it was all three! Whatever it was, we can conclude that Pham’s ceiling is capable of more than what he did last season, even if his 2018 was pretty good!

The first thing to note about Pham in this young 2019 season is that he is maintaining his uptick in exit velocity. He continues to make hard contact, with his average exit velocity sitting pretty at 92.9 mph. That is virtually the same as it was last season, and is a 3.6 mph increase from his best season.

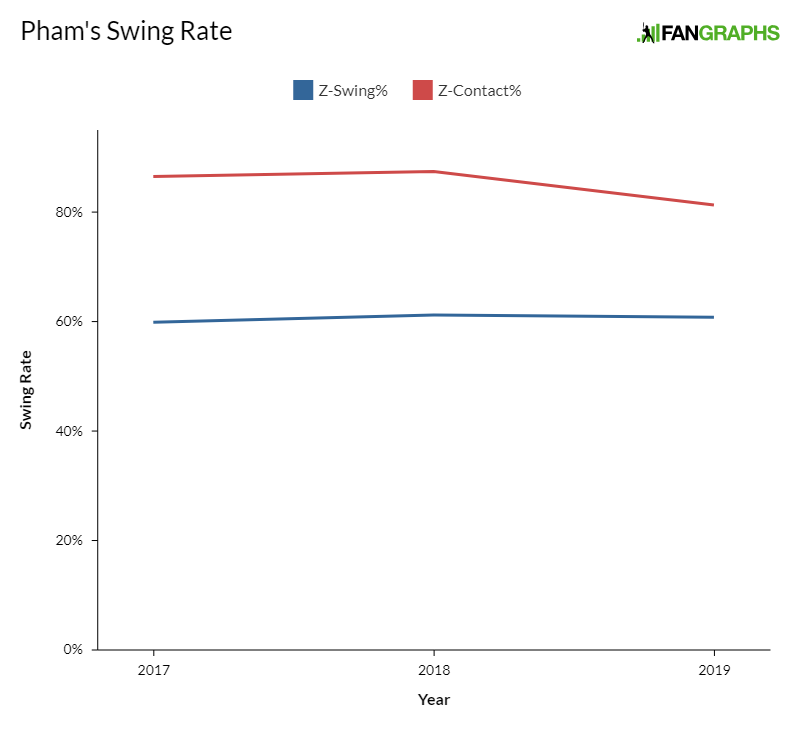
The two words most often used to describe Tommy Pham are “focused” and “intense.” That really shines through in his plate discipline. Below are his swing and contact rates for pitches inside the strike zone.

His swing rate in 2017 was about 60%, which went up by one percentage point last season. Those are good numbers. On those pitches, he made contact 86.5% of the time in 2017 and 87.4% last year. That has remained consistent over the first couple weeks of the season, as Pham has swung at 60.9% of pitches inside the strike zone and made contact on 83.0% of them.

Let’s step away from batted balls and look at the other facets of plate discipline. Pham keeps taking walks at a similar rate; 11.8% of his plate appearances last year and 13.4% the year prior resulted in walks. In his first 12 games, Pham has split the difference and worked 10 walks, good for a 17.9% rate, about 10% higher than last year’s MLB average. In addition to bases on balls, Pham’s strikeout rate is fairly consistent, if a tad above the league norm. The average strikeout rate for all batters was 22.3% last season, and Pham fell in at 24.6%. He is at 17.9% so far this season. These first 12 games are a very small sample, but everything we have seen from him indicates he is still seeing the ball well.

We know he understands the zone, but what about results? What happens once Tommy Pham puts a ball in play?

His ground ball rate has been, at times, problematic. In 2015, 51.3% of the pitches he put in play were on the ground. That decreased to 45.5% in 2016, then jumped up more than 6% the following season. Are these numbers making you dizzy? In 2018, the ground ball rate fell to 48% but that roller coaster has swung back up to 57.1% this season, though again, it’s early.

Pham has not proven himself to be a power hitter; all 12 of his hits this season have been singles. In 2017, only 35% of his hits went for extra bases, then 33% of his hits last season. The major league average is 36%; Pham hasn’t reached that point even at his best. His wRC+ this season is 112. He relies on ground ball singles, which is not what he should be doing if he wants to repeat 2017. His batting average is above the mean, but all these singles do not generate runs at a high enough rate.

The counter-argument is that he bats second in the Tampa Bay lineup. His role is to get on base, not so much to be the guy driving in the most runs. Walks and singles suit his role. Pham already has four stolen bases after taking 15 last season. He has the ability to compensate for all these singles by stealing an additional base and is well on track to outpace his stolen base total from 2018. Whether the extra base hits will come in 2019, and how often, remains to be seen.

Looking at last season, however, it appears Pham tried to make some of these adjustments.

Pham’s Team Splits
Team PAs GB% GB/FB Hard%
STL (2017) 530 51.7% 2.0 35.5%
STL (2018) 396 52.4% 2.0 47.4%
TBR (2018) 174 37.3% 1.2 51.0%

Even during his fantastic 2017 season there were things Pham could improve. He needed to make more hard contact and did just that. After being traded to Tampa Bay, the hard contact increased even more. His ground ball to fly ball ratio was consistent in St. Louis, but was nearly cut in half during his time as a Ray. And his overall ground ball rate decreased fifteen percent! While only 29% of his hits went for extra bases during his time in St. Louis last year, that number jumped to 41% once he was traded to Tampa Bay. Something in that Florida water worked pretty well for Tommy Pham. If he gets back to that contact and fly ball rate over the course of this season, that wRC+ will increase and he could bounce back all the way to his 2017 numbers.

Pham’s lack of extra base hits are cause for concern, as is his penchant for ground balls. Last year, however, he proved he could make the necessary adjustments to make harder contact and put more balls in the air. The question is whether he will do it again.

Pham appears to be maintaining the aspects of his game that made him dangerous at the plate. Since being traded to Tampa Bay, he has played in 51 games for the Rays and has been on base in 49 of them. He walks, he steals bases, and he hits for a good average. Pham is not the sort of person to swing wildly at anything and is fairly selective with the pitches he sees inside the strike zone. There are ways he can improve, but even if he just matches his 2018 season, he will be a great offensive asset this year. If he picks up where he left off last season, Pham might just be as good as he was in 2017.


Rick Ankiel, Comeback King?

Baseball is a game of failure, forcing players to find, utilize, and ultimately rely on their strengths. It is hard to find someone who exemplifies that more than Rick Ankiel. He pitched for the Cardinals in 2000 and was so good that he finished second in Rookie of the Year voting. Then the NLDS came along and Ankiel could not throw strikes. He gave up four runs on two hits, four walks, and five wild pitches. It could have been a fluke, just the nerves of his first postseason appearance, pitching against Greg Maddux, no less. Totally understandable, except he could not get through the first inning of his next start. It was the second game of the NLCS and Ankiel was pulled after twenty pitches, five of which went to the backstop.

Things never got much better. In 2001, he threw 24 major league innings and walked 25 batters. He was demoted all the way to Rookie League that year, sat out the 2002 season, then had Tommy John surgery in 2003. He returned as a reliever in 2004 and posted a 4.75 FIP in ten innings. Things were bleak until the Cardinals offered to play him at a different position. Rick Ankiel came back in 2007 as an outfielder and he was good! He was known for making unbelievable throws, but also managed to hit 74 home runs during his seven seasons. Not bad for a former pitcher. He retired after the 2013 season, having made a comeback for the ages.

And he wants to do it again.

Rick Ankiel is working to return to the majors as a left-handed reliever at age 39. He played in one game during the Bluegrass World Series last year, where he racked up two hits and four RBI in four plate appearances, not to mention that he threw out a runner at the plate. But then, he did the one thing few people ever thought he would do again: he took the mound. He only faced one batter, but he struck him out on four pitches. It was enough for Ankiel to wonder whether he could get a chance to once again experience the game from at the position that had been so cruel to him.

All of this is bananas. The astonishingly quick rise and then fall from pitching stardom. Reinventing himself as an outfielder. Succeeding in the major leagues for seven seasons after contemplating retirement. As if that was not challenging enough, last October Rick Ankiel had an ulnar collateral ligament repair with internal brace construction. A UCL tear generally results in Tommy John surgery, which has a 12 to 18 month recovery time. If Ankiel had required another Tommy John, any potential comeback would have been pushed into his age-40 season and, as he mentioned on a recent Cardinals spring training broadcast, likely would not have happened at all. “If it had been a total reconstruction, he said, “I probably would’ve passed and just moved on. I would’ve missed all this year and then we’re all the way to next spring training and that’s just a long time.” When I heard Ankiel’s interview, I wondered whether primary repair surgery would help or hinder his comeback effort, and went searching for an answer.

Primary repair surgery is still fairly new. The first major league pitcher to have it was Seth Maness during the 2016 season. There is very little data about how it compares to Tommy John and not all UCL tears are eligible for primary repair. If a ligament is torn in the middle, a player will require Tommy John which involves creating a new ligament out of tissue taken from another part of the body. If it is torn near the bone, however, primary repair comes into play. It involves minor repairs and providing a sort of abutment around where the ligament is anchored to the bone. The recovery timeline ranges from seven to nine months, or nearly half of what it takes to rehab from the Tommy John procedure.

Seth Maness is the only case study I could find at the major league level. He is not a one-to-one comparison, since his arm had gone through about four major league seasons while Ankiel’s played somewhere around nine. Given Ankiel’s 2003 Tommy John, his surgeon actually repaired a reconstructed ligament. There are a lot of questions and variables to consider.

First, let’s take a look at Maness’s numbers before and after his surgery. He hit the “dead arm” phase in 2016, so the data below includes the 2014 and 2015 seasons, plus the 2017 season following his surgery, which would parallel Ankiel’s planned return. The sample size from the major leagues in 2017 is small, so our conclusions will rely heavily on Maness’s time with the Royals’ Triple-A affiliate.

Seth Maness Pre- and Post-Primary Repair
Season IP K/9 BB/9 AVG FIP GB% FB% Pull% Oppo%
2014 80.1 6.16 1.23 .253 3.38 56.0% 25.1% 37.8% 26.9%
2015 63.1 6.54 1.85 .301 3.78 55.9% 25.0% 37.6% 22.9%
2017 (MLB) 9.2 3.72 1.86 .372 6.99 51.3% 23.1% 38.5% 20.5%
2017 (AAA) 47.0 6.70 1.53 .318 4.74 47.2% 34.6% 37.4% 31.9%

The first thing that pops out are the consistencies. Maness’s strikeout rate in the minor leagues was consistent with what it had been during the 2014 and 2015 seasons. Hitters continued to pull the ball at the same rate, and the number of walks he issued was fairly similar as well. These are good signs.

However, Maness relied heavily on groundballs for his success. It felt like every time he was on the mound, he would induce a double-play. His groundball percentage dropped significantly, 4% in the majors and 9% in the minors. Naturally, his flyball rate jumped, rising to 9% in the minor leagues. His FIP jumped an entire point from 2015 to 2017, as he relied increasingly on the defense behind him. He also lost about two miles per hour on his sinker, slider, and fastball during the 2016 season. He never regained that velocity. If Ankiel wants to be major-league ready, he will need one of these secondary pitches. Can he avoid the slowdown that plagued Seth Maness? Only time will tell.

Maness was released by the Royals in 2018 and currently plays in the Atlantic League. He never quite regained the effectiveness he had prior to the injury. That said, it does not spell disaster for Rick Ankiel.

First, Ankiel relied more on strikeouts than groundballs, which may surprise some given his difficulty throwing strikes. While the outcome Maness relied on took a hit, his strikeout rate held fairly steady. His ability to put the ball in the zone was not impacted, which is obviously great news for Rick Ankiel. Second, Maness relied most heavily on his sinker, then fell back on his changeup or fastball when needed. Ankiel has said he would rely on a curveball and high fastball. Maness did not have a curveball so there is no available data to compare. As for the fastball, there was a dip in velocity which is cause for concern.

Things are looking up since Ankiel hit 89 mph in the Bluegrass World Series last year when he was not even “in pitching shape.” That outing, such as it was, also occurred before the primary repair surgery, so the ligament was weakened. That velocity tops Maness’ fastball average at 88 MPH in 2017. However, because Ankiel has historically been more reliant on this pitch, he will need to achieve a significant uptick in velocity (or undergo a significant change to his repertoire) in order to compete, especially because he wants to compete not only in the minor leagues as Maness did, but in the majors.

Finally, though it is difficult to isolate the surgery’s effect, it did not appear to increase the rate at which Maness walked hitters. He was not suddenly wild, nor did his control evaporate. After the onset of the yips, Ankiel could rarely throw strikes. If he has overcome the anxiety, which he says he has, then it all comes down to his ability to control the location of his pitches. Can he do that as effectively as he did in 2000? The answer is yet to be determined, but using Seth Maness as a case study indicates that the primary repair surgery may not necessarily be what undermines Ankiel’s pitch control.

The only narrative in sports that is better than a comeback story is a second comeback. It’s something fans tend to root for. The first time he was challenged in this sport, Ankiel’s solution was to climb a different mountain, and conquer the outfield instead of the pitching mound. This time, things will likely be harder. There are many questions yet to be answered, questions that we would have even without the additional red flag of a surgery. The chances here are remote. Could this be the year he overcomes the very problem that hindered him in the first place? That remains to be seen, but Seth Maness provides a hopeful if narrow blueprint for Rick Ankiel’s return to the major leagues, or at least, he offers a limited answer on one important part of Ankiel’s journey that could hold him back. I sure hope he makes it.