Last week, I wrote an article about the influence of batted ball spin. The takeaways were simple: For one, even though confounding variables like temperature and wind speed are hard to eliminate, it’s entirely plausible that batted ball spin alone can subtract crucial amounts of expected distance. Also, while hitters may display a penchant for certain types of spin, they seemed to have little control over it on a daily basis. Potential inaccuracies aside, these findings made sense; hitting a baseball is hard, and batted ball spin is just another piece of the puzzle.
After the article ran, I didn’t expect to revisit this topic anytime soon. But two things inspired me to start exploring again. First, a Twitter mutual was kind enough to provide me with Trackman data of college baseball games that include — you guessed it — batted ball spin axis, which opened up multiple avenues of research. Second, Dr. Alan Nathan, a physics professor at UIUC, summarized his own findings on batted ball spin in the comments. Armed with new data and knowledge, it was time to dive back in. Read the rest of this entry »
When a batter steps up to the plate against Framber Valdez, there are a couple things that can happen. The first (and most embarrassing) outcome is a strikeout. It doesn’t happen too frequently, thankfully – Valdez’s current strikeout rate of 18.9% is on the low side – but still, it hurts to have stood there without positively impacting the game whatsoever. How about a walk to ease the pain? Valdez isn’t exactly a control artist, and his current walk rate of 10.1% is on the high end. A free trip to first makes for a satisfied hitter – no further explanation needed. But a potentially greater outcome is a ball in play, which constitute 69.2% of Valdez’s allowed outcomes. That’s a lot of contact! Balls in play include outs, certainly, but also the doubles, triples, and home runs that galvanize batters and fans alike. No other outcome is as unpredictable yet rewarding.
Based on this, you might think hitters enjoy teeing off against Valdez. There’s one problem, though. So far this season, their collective groundball rate against him is a whopping 69.0%. Their collective fly ball rate, meanwhile, is a mere 6.9%. Not that a grounder can’t become a hit, but without an element of luck, it’s a single at best. And when hitters have attempted to circumvent that issue by swinging for the fences… well, they haven’t succeeded. Valdez has allowed just eight fly balls this season. It’s his world they’re living in. Read the rest of this entry »
If I may, I think the uncertainty regarding this season’s offensive environment has made us a bit paranoid. Are hitters lagging behind pitchers due to an irregular spring training? Is the ball not traveling like it once did because it’s been replaced yet again, or is the mass introduction of humidors to blame? Or worse, has MLB introduced multiple balls into the game, some of which are being used in certain games to boost action or influence outcomes?
That last theory has been floating around my Twitter feed for a while now. I’m not going to discuss whether it’s true, but I brought it up because supporters of the multiple ball theory will often compare two batted balls with near-identical exit velocities and launch angles. One ends up traveling more than the other, despite all the indications that it should not. Aha! Something must be up.
In response, a lot of people have suggested batted ball spin as an explanation. Maybe one ball came off the bat with backspin and the other came off with topspin, which would drag the ball down as it traveled through the air. Unfortunately, since data on batted ball spin isn’t available on Baseball Savant, this might seem like a dead end. Don’t worry, though: I had some leftover Trackman data on 2021 NCAA Division I baseball games from a piece that Eric Longenhagen and I collaborated on during last year’s Draft Week, and they contain mostly complete readings on the spin of a batted ball. Could we use collegiate baseball to learn about the odds and ends of batted ball spin, and what it tells us about hitting? Read the rest of this entry »
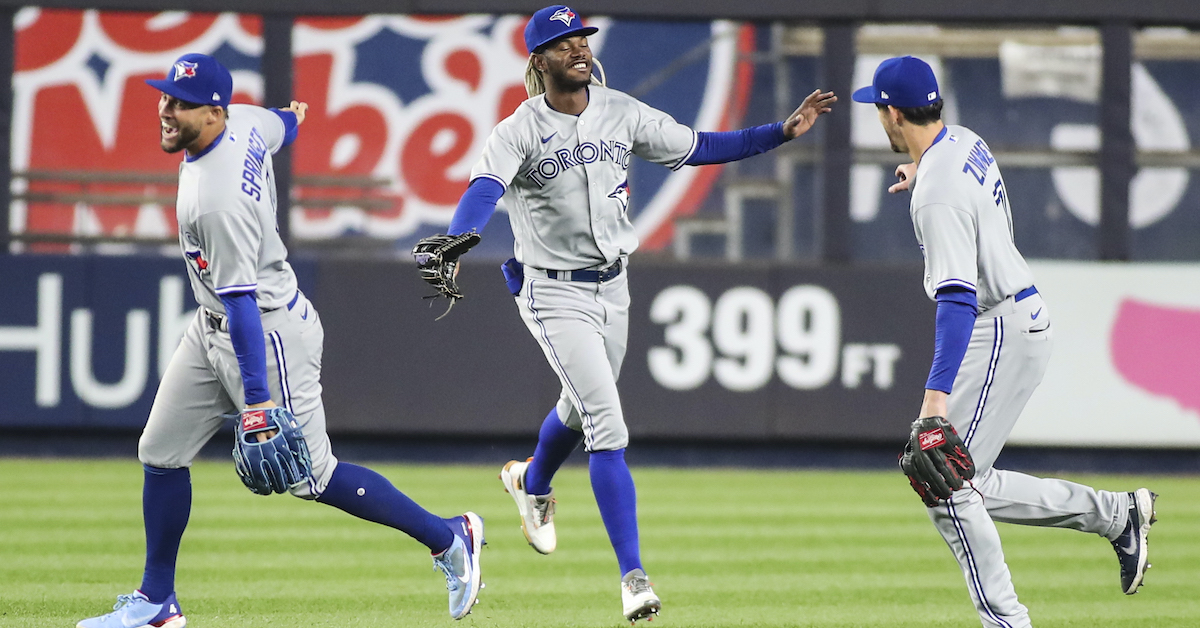
It’s a fun time to be a Blue Jays fan. (Well, Tuesday night’s loss to the Yankees notwithstanding.) Vladimir Guerrero Jr.’s titanic home runs are fun, George Springer’s diving catches are fun, and Kevin Gausman’s wicked splitters are fun. Basically, the entire team is a blast to watch. To a casual fan, Toronto must look like the best baseball has to offer. And to a serious nerd like myself, Toronto also looks like the best baseball has to offer — in one specific regard, that is.
Here at FanGraphs, I’ve written extensively about the shift. It’s a subject I’m passionate about not only because there’s a lot of room for analysis and debate, but also because teams seemingly never agree on how to use it, and dissent is entertaining. The Padres only shift against left-handed hitters. The Dodgers shift against everyone! Last season, it looked like teams started to cut down on shifts against right-handed hitters. This season, they’re more popular than ever. And if there’s a protagonist in the latest (and potentially last) story surrounding baseball’s grasp of the shift and all its variations, it’s none other than the Toronto Blue Jays.
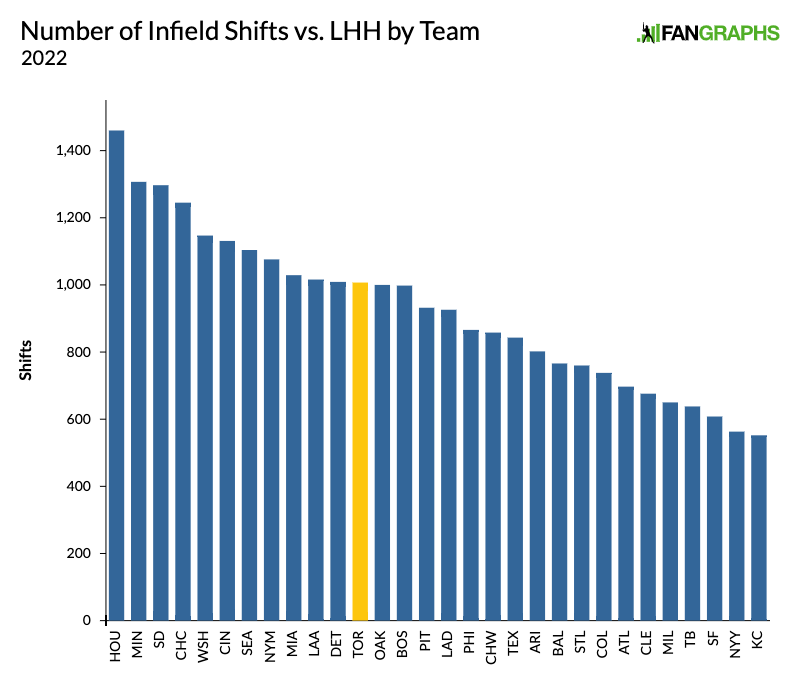
I’m hardly the first to take note of this. Summarizing the season’s first weekend, Mike Petriello wrote about how the Blue Jays were shifting against everyone. Emma Baccellieri covered the continued rise of infield shifts and how Toronto has been leading the charge. In addition, what follows isn’t anything groundbreaking. These observations have been made before, but they bear repeating because they’re ridiculous. It’s as if the Blue Jays are participating in an entirely different game. But if we just look at the most common variety of shifts, the ones against lefties, there’s nothing all that special to be found:
A quick note on this graph and those ahead: they display volume and not rate, making them inaccurate in judging which teams are the most and least shift-enthusiastic. For example, while the Yankees are 29th by number of shifts against lefties, they’re 23rd by shift rate, simply because their pitching has faced a league-trailing number of left-handed hitters. But for the purposes of this article, using each team’s total seemed like the best option. You’ll get to see why later on.
Getting back to the point, the Blue Jays are around the middle of the pack when it comes to shifting against lefties. They follow a rare shift-related consensus but not overly so, which is that most left-handed hitters are good shift candidates. Why? Compared to right-handed hitters, lefties pull a higher rate of groundballs and tend to strike out more often when faced with the shift. A standard lefty alignment also leaves considerably fewer holes in the infield. Even the most conservative teams are shifting way more against lefties than they did some three or four years ago.
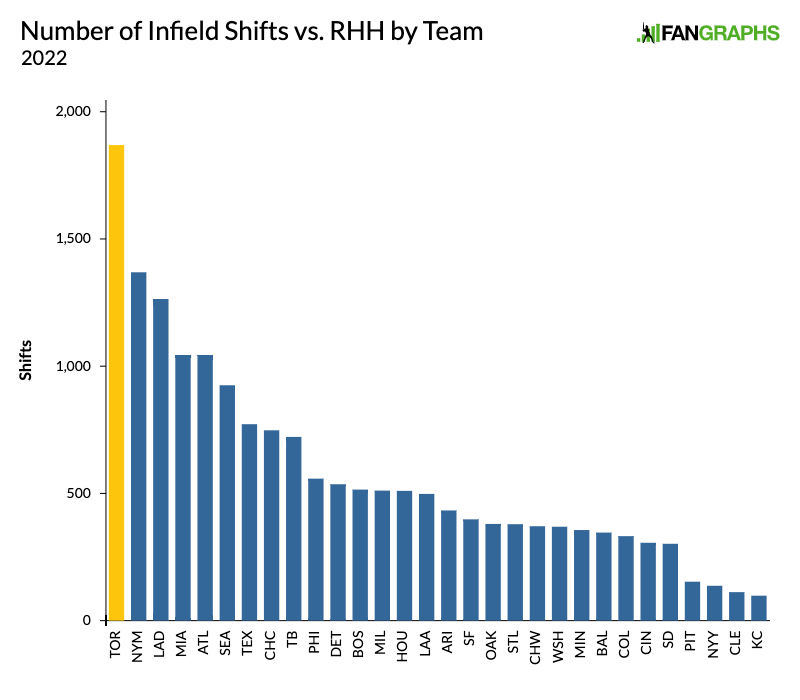
In that sense, the Blue Jays are moderates. But not for long, because this is where things kick into overdrive. While all teams have shifted against a righty at least once this season, extremists are few and far between. That’s because those righties are a risky bunch; they don’t pull as many of their grounders and strike out less often against the shift. A standard righty alignment can cover the pull side, but any ball hit even slightly the other way has base hit potential. Most teams prefer to focus on the lefties. The Blue Jays, though? They simply do not care:
What’s fascinating is just how fast the Blue Jays came around to the idea of targeting right-handed hitters. They shifted against righties in 11.3% of opportunities last season, a rate that has skyrocketed to 66.4% this year. Some time during the offseason, the Jays’ front office folks pondered the possibility of this, ran the numbers, and arrived at the conclusion that it is indeed viable. I have no idea what sort of revelations led to such a rapid shift in philosophy, and from the outside looking in, they seem bonkers. Public research suggests that shifting against so many righties is a bad idea. But evidently, certain teams are arguing otherwise. The Blue Jays, beyond joining them, are now spearheading their campaign.
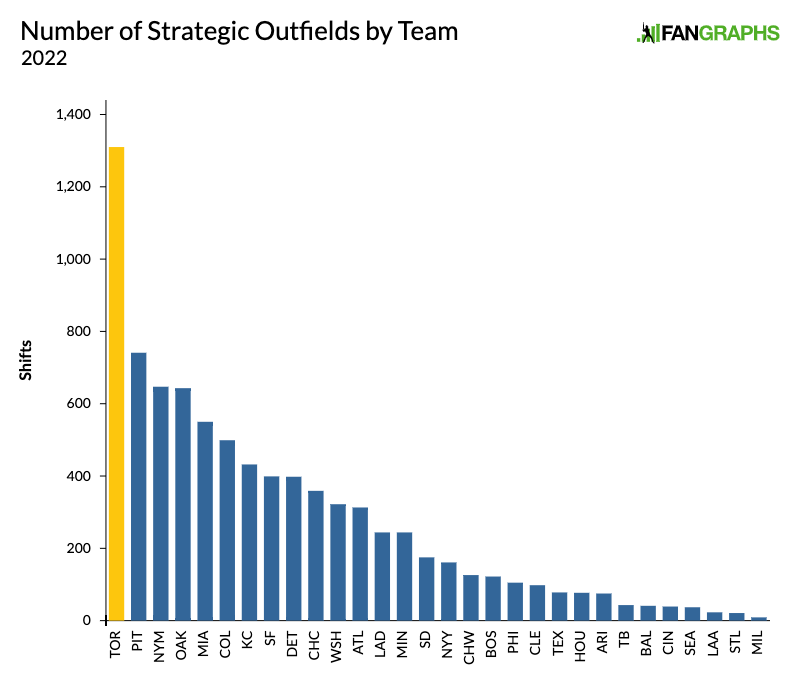
Teams aren’t only paying attention to their infield defense, however. As both Rob Arthur and Russell Carleton have detailed, outfield positioning has had a far greater impact on hitter BABIP than infield shifts, which receive the bulk of the sports media spotlight. One method teams use to snag hard-hit line drives and fly balls is shading the centerfielder to the right (versus lefties) or the left (versus righties). Hitters also tend to pull their air balls, and it’s those pulled balls that are the most dangerous. Labeled as a “strategic” outfield on Baseball Savant, it’s subtle, effective, and has spread across the league. Let’s see where the Blue Jays stand in terms of usage:
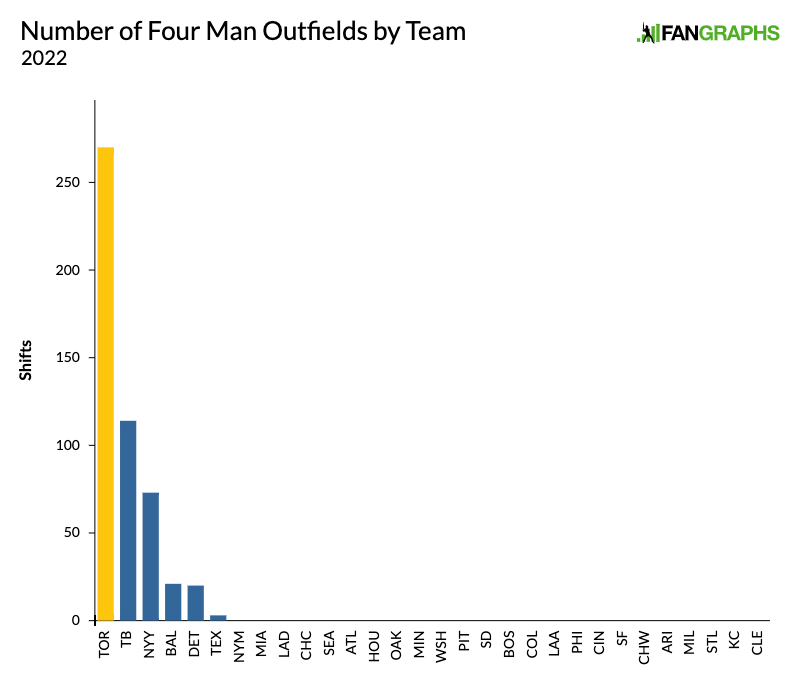
There’s not much to add here. The Jays are once again in first place, and this time by an even greater margin. They alone have accounted for 16% of all strategic outfields this season. Since these outfield shifts happen concurrently with infield ones, it’s pretty much never the case that Toronto’s defense is normal. Regardless of your feelings about the shift, you kind of have to applaud this dedication, right? Oh, and the Blue Jays are also connoisseurs of the four-man outfield, which few teams attempt due to the risk involved. It’s certainly an acquired taste, but the Blue Jays have a voracious appetite:
This graph isn’t missing any values — there really are only six teams thus far who have dared to place four men in the outfield. Fittingly, the Blue Jays’ total is greater than that of the five other teams combined. It’s interesting how among the six, four of them are AL East teams. That’s partly because of Joey Gallo and Anthony Rizzo, two Yankees who rank first and second in most four-man outfields faced. But what separates the Blue Jays is their relentlessness. Rather than reserve four-man outfields for extremely specific situations, they’ve been keen on using them against select hitters without consideration for the opposing pitcher or count. They aren’t just dipping their toes in the water; they seem fully committed.
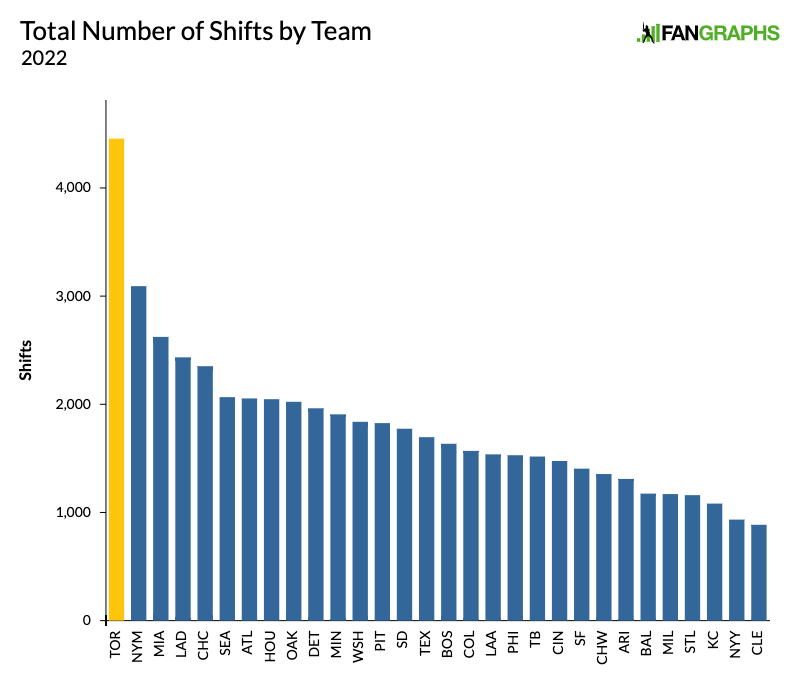
In conclusion, the Blue Jays shift a lot. How much is a lot? This much is a lot:
A bunch of teams squished together, with one Toronto skyscraper towering over them. That graph perfectly encapsulates why the Blue Jays have been so unbelievable this season. The players are good, sure, but from a front office perspective, this is also what a desire to win looks like. Not that a maximalist approach is necessarily good, but the Blue Jays sure seem convinced that more than 4,000 shifts and counting are an integral part of their formula. They’re all in! That can’t be said about a lot of teams.
What I’m not going to do here is try and figure out what their reasoning is, and if it really is sensible. That’s maybe an article for later — no math this time. The Blue Jays’ aggressive ways do give us plenty of questions to consider, however. Did their acquisition of Matt Chapman encourage them to push the limits of what’s possible in the infield? Does the spacious outfield of Rogers Center give them an incentive to cover extra ground? Or have they somehow found a way to nullify the walk penalty? For now, though, I’m content with stepping back and admiring their efforts. If the shift does becomes a relic of baseball’s past, we’ll always have the 2022 Blue Jays to remind us how far it was taken.
Chances are you haven’t thought much about Edmundo Sosa recently. He lost the Cardinals’ starting shortstop gig to Paul DeJong before the season began, leading to inconsistent playing time. When given opportunities, he’s been hitting a paltry .160/.250/.160; striking out 42.9% of the time and walking zero percent of the time will do that. Making matters worse, his placement on the COVID-19 injured list last week further removed him from the action. He’s seen better days.
But wait — if you’re an astute reader, you might have noticed a curious detail. If Sosa has yet to draw a walk, how is his on-base percentage that high? I’m so glad you asked (and not me, who definitely didn’t need a segue). While Sosa has just 28 plate appearances to his name, he’s already been hit by a pitch three times. That seems like quite a high rate of plunkings! Indeed, here are the much-too-early-but-relevant leaders in hit by pitches per plate appearances so far this season. Guess who’s at the very top:
Take that, Michael Hermosillo. It’s Sosa who claims the throne by a small margin, but considering his offensive woes, the man needs any victory he can take. To Cardinals fans, though, his capabilities as a pitch magnet are nothing new. In 326 more successful plate appearances last season, Sosa dutifully bore the brunt of 17 pitches, which formed the backbone of a respectable .346 on-base percentage; he’s not the type to wait out four balls for it. That, in tandem with flashes of gap-to-gap power, made Sosa a sneaky component of the Cardinals’ yearly devil magic, as they made the postseason in stunning fashion.
It’s unfortunate that Sosa’s bat is dormant to begin 2022, but at least one offensive skill remains. Skill? Absolutely: certain hitters are better than others at getting plunked, and while there’s evidence that pitchers are driving the recent spike in hit-by-pitches, there’s also research suggesting that the latest generation of hitters are eager to endure pain for a free base. In Sosa’s case, any pitcher influence seems minimal; he’s seen about a league-average rate of pitches up-and-in thus far. That he led the league in HBP per PA last season (among hitters with 300 or more PA) and is continuing his reign is no accident. Sosa gets beaned a lot, and he’s good at it. Read the rest of this entry »
I have some good news about the Yankees. Their collective 120 wRC+ is tied for first among all teams in baseball, an achievement that seems like an amalgamation of skill rather than luck. Case in point: They’re leading the league in every conceivable Statcast metric, including average exit velocity, hard-hit rate, and barrel rate. By hitting baseballs at blistering speeds, the Yankees are turning them into valuable extra-base hits. It’s an ideal process, especially in a season where said hits have been harder to come by.
Next, I have some not-as-good news about the Yankees. It’s something I noticed while looking into Joey Gallo. The lefty slugger recently recorded his first two homers of the season, but his overall batting line is still under water. He’s striking out over 40% of the time, and the little contact he does make hasn’t returned much. You might think this is because Gallo goes after pitches he shouldn’t à la Javier Báez, but last season, he ran one of the best out-of-zone swing rates around. The problem is that even when he’s offered an attractive pitch, he has a gruesome tendency to whiff at it. When Gallo slumps, he doesn’t do so in a manner that’s even the slightest bit flattering. Read the rest of this entry »
Mike Trout is climbing up the WAR leaderboards; nature is healing. Still, it’s probably best to remember that we’re in the season’s early going. Eric Hosmer is batting .415! Meanwhile, Yuli Gurriel is batting .203. Some players have been unbelievably hot, others have been mysteriously cold — these extremes tend to balance out by season’s end. Players usually remain who they are, despite the memorable breakouts.
That principle also extends to changes in a player’s approach, pitch mix, or swing mechanics. Often, those eager to better themselves will start the season with a completely different look. Reality tends to get in the way, though. Sometimes injuries happen, or old habits prove hard to shake. Many players won’t see their changes through a year’s worth of trouble. It’s just the nature of things.
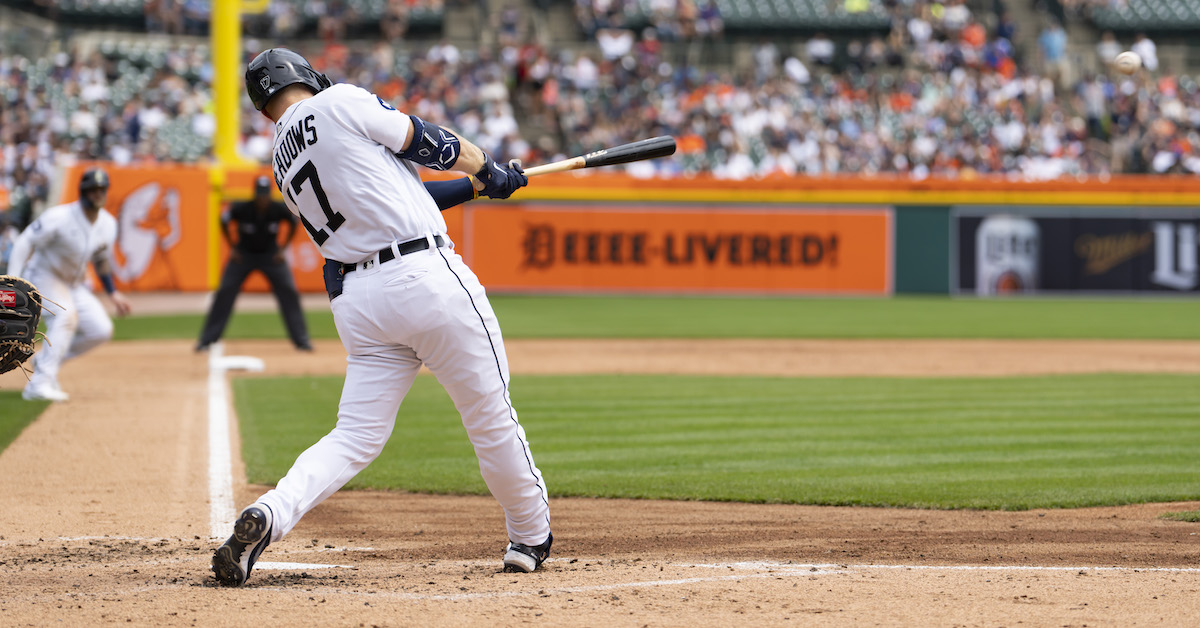
With that in mind, let’s talk about Austin Meadows. He’s a Detroit Tiger now, having arrived from St. Petersburg in a trade only his former team would dare to orchestrate. And he’s off to a pretty good start, with his .304/.418/.411 line translating to a 154 wRC+ in an offensively challenged season. It’s not so surprising, since Meadows has proven himself many times to be a great hitter. What is worth noting is how he’s arrived at that mark. In a few ways, Meadows looks like a different hitter than the one he was a year or two ago. So if you’re willing, I’d like to highlight some interesting (warning: subjective) things that have defined his productive April. I’ll present them in three parts. Read the rest of this entry »
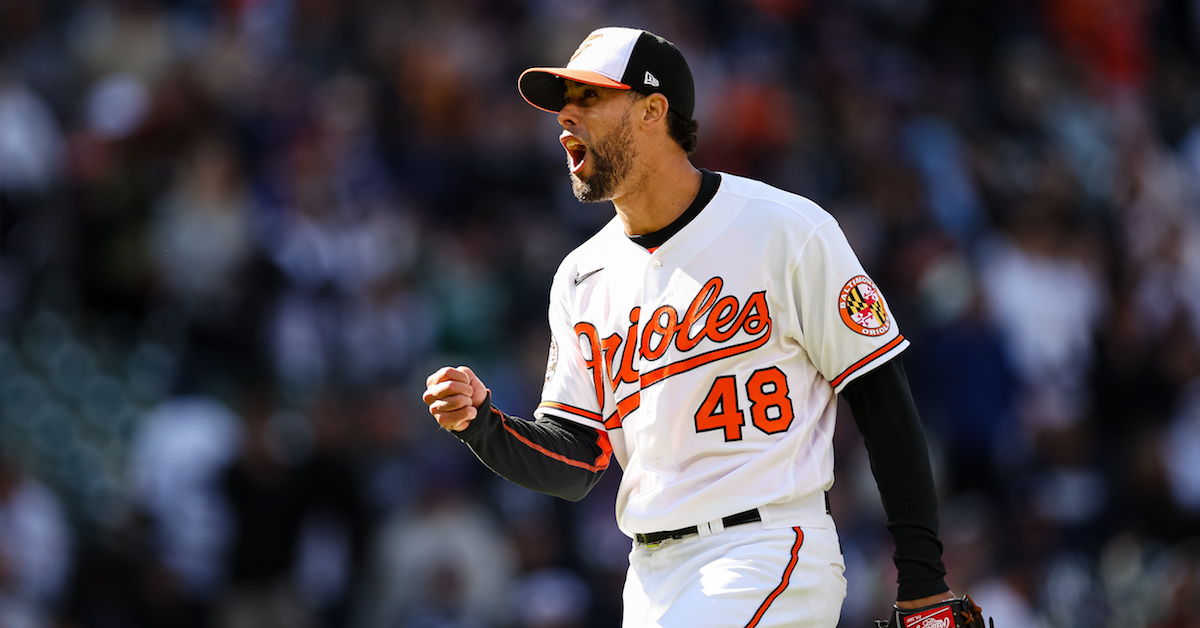
On April 15 at Camden Yards, the Orioles and Yankees were locked in a stalemate. Both starters had exited, and by the seventh inning, the score remained tied, 1–1. It would be up to each team’s bullpen to keep the game close until their respective bats came alive. The Yankees, of course, sported the league’s finest collection of relievers, a sentiment shared by our preseason positional power rankings. The Orioles bullpen, in contrast, had been deemed one of the league’s worst. A lack of offensive firepower also cast a shadow of doubt on Baltimore’s hopes for victory. It was clear: One side had the advantage, the other did not.
And yet, it was the Orioles who triumphed to secure the win. The projected 28th-best bullpen held its own until the 11th inning, when Ramón Urías drew a walk-off walk against a shaky Aroldis Chapman, bringing a drawn-out conflict to a close. But this isn’t just a one-time, David-beats-Goliath story. As of this writing, the Orioles have the most valuable bullpen in baseball by WAR (I know, it’s early for that, but bear with me). They have the second-most effective bullpen by xFIP. And to really put things into perspective, here’s a comparison between the Orioles and the Yankees:
Bullpen Showdown
Metric
Orioles
Yankees
ERA
2.75
2.44
FIP
2.95
3.07
xFIP
3.27
3.56
K-BB%
14.8%
14.0%
CSW%
29.9%
29.6%
As expected, the Yankees bullpen has served the team well. But on most fronts, the Orioles’ own unit has kept pace, a fact we can appreciate regardless of how the team is performing. Sure, that’s more mirage than reality. Skeptics can point to an abnormally low home run rate and the fact that it’s early – the Orioles had yet to face a revitalizedMike Trout until Sunday, for example. Consider, though, that Orioles relievers not only own the league’s fifth-highest groundball rate, but also its lowest fly ball rate. In tandem with the altered dimensions of Camden Yards, there’s reason to believe this contact suppression isn’t merely a fluke. They’ve set themselves up for success, in other words. Read the rest of this entry »
When the 2022 season opened to fanfare and excitement, one of the main talking points was the record-setting arrival of top prospects. After countless rebuilds, a global pandemic, and a prolonged lockout, fans deserved to watch budding superstars duke it out in games that matter. Some of them, like Seiya Suzuki and Jeremy Peña, have been thriving right out of the gate; both rank among the top ten in batter WAR as of Thursday’s games. Others like Spencer Torkelson might have fallen a bit off the radar but have still been successful per wRC+ or batted ball metrics.
Much to our annoyance, though, there’s always a flip side we’d like to ignore. Enter Julio Rodríguez, whose triple slash of .136/.208/.159 is terrible not just amongst fellow rookies, but also all of major league baseball. This isn’t to say we should be concerned; Rodríguez remains one of the most talented rookies around, and in the grand scheme of things, 12 games and counting mean next to nothing. Don’t smash that emergency glass just yet!
But in his opportunities to prove himself, Rodríguez hasn’t been offered fair terms. One of the most fundamental and effective traits a hitter can possess is plate discipline, which is partly the ability to ignore unfavorable pitches. It’s something Rodríguez has demonstrated several times in a limited number of plate appearances, with confidence to boot, but that bravado hasn’t quite translated into results:
This is a chart showing all eight (!) called third strikes outside the zone against Rodríguez, a league-leading total. The plotted strike zone is adjusted for his height, by the way, so there’s no ambiguity here. It gets even worse when you actually look at some of these pitches, which the umpires gift-wrapped for pitchers who made objective mistakes. For example, here’s a Sonny Gray sinker that is rarely, if ever, called a strike, especially in a two-strike situation:
Uh-huh. Sure, that’s totally a decision befitting a stadium named Target Field.
You could maybe argue that Rodríguez, whose two-strike swing rate of 40.3% is the third-lowest among all hitters, needs to up his aggression. The cost of taking a third strike is high, so the math tells us that a batter ought to hack away instead. But Suzuki has a similar two-strike swing rate (42.7%), and he’s yet to be punished for his passivity. Whatever flaws Rodríguez might have right now as a hitter don’t excuse the fact that very few calls have went his way. This is a clear problem, one that has Mariners fans understandably angsty. Read the rest of this entry »
Pitchers are scary. I know this because I recently watched an outing byMatt Brash, who, despite his nonexistent command that day, used a scorching heater and two breaking balls to stymie a formidable Astros lineup. He walked six, but those free passes went along with five strikeouts and just two hits allowed. The Mariners won by a score of 7 to 2. So it goes.
Pitchers are scary, and they’re getting scarier, in large part because they’ve developed the ability to throw harder and harder. It probably doesn’t even bear repeating at this point, but because it’s the subject we’re on, let’s refresh ourselves. Back in 2008, the first year with PITCHf/x data, pitchers averaged 91.8 mph on their four-seam fastballs. Last season, they averaged 93.8. That the league as a whole has gained two miles per hour is indicative of substantial change.
It’s 2022 now. It’s early, but so far, pitchers have been averaging 93.9 mph on their fastballs, for an uptick of 0.1 mph. Such a small difference might not seem like much, or something we should focus on right now. But this is merely a cursory glance. We haven’t even separated the starters from the relievers, and it’s the latter group that most people associate with triple-digit wizardry. Are bullpens hiding the fact that rotations aren’t quite stretched out yet due to an abbreviated spring? Let’s find out: