
More Fun With Batted Ball Spin Data
Last week, I wrote an article about the influence of batted ball spin. The takeaways were simple: For one, even though confounding variables like temperature and wind speed are hard to eliminate, it’s entirely plausible that batted ball spin alone can subtract crucial amounts of expected distance. Also, while hitters may display a penchant for certain types of spin, they seemed to have little control over it on a daily basis. Potential inaccuracies aside, these findings made sense; hitting a baseball is hard, and batted ball spin is just another piece of the puzzle.
After the article ran, I didn’t expect to revisit this topic anytime soon. But two things inspired me to start exploring again. First, a Twitter mutual was kind enough to provide me with Trackman data of college baseball games that include — you guessed it — batted ball spin axis, which opened up multiple avenues of research. Second, Dr. Alan Nathan, a physics professor at UIUC, summarized his own findings on batted ball spin in the comments. Armed with new data and knowledge, it was time to dive back in.
Let’s start with a word from Dr. Nathan. This part of his comment struck me as particularly interesting:
“The increased lift with backspin (which increases distance) gets overwhelmed by the increased drag (which decreases distance) once the spin exceeds 2,500–3,000 rpm.”
As well as this:
“…it is very difficult for a ball hit at 25–30 deg to have topspin.”
In demonstrating the impact of batted ball spin, I’d chosen fly balls with a decent amount of exit velocity (95–100 mph) and an ideal launch angle (25–30 degrees), along with an assumption that topspin was the main culprit in slashing distance. But as clarified by Dr. Nathan, such fly balls are devoid of topspin. Rather, the contributing factors are an increased drag and, as he also mentioned, the existence of sidespin that doesn’t aid in lifting the ball. That certainly defied expectations.
Indeed, when I recreated the initial graph of batted ball spin rate against actual minus expected distance using the new data… well, I wasn’t able to! That’s because after applying a topspin-only filter, all the points on the graph vanished without a trace. Not that he needs it, but the disappearance gave credence to what Dr. Nathan had said. The truth is a bit more complicated, however. Here’s a plot showing the distribution of launch angle for each type of spin. It’s not what you might expect:
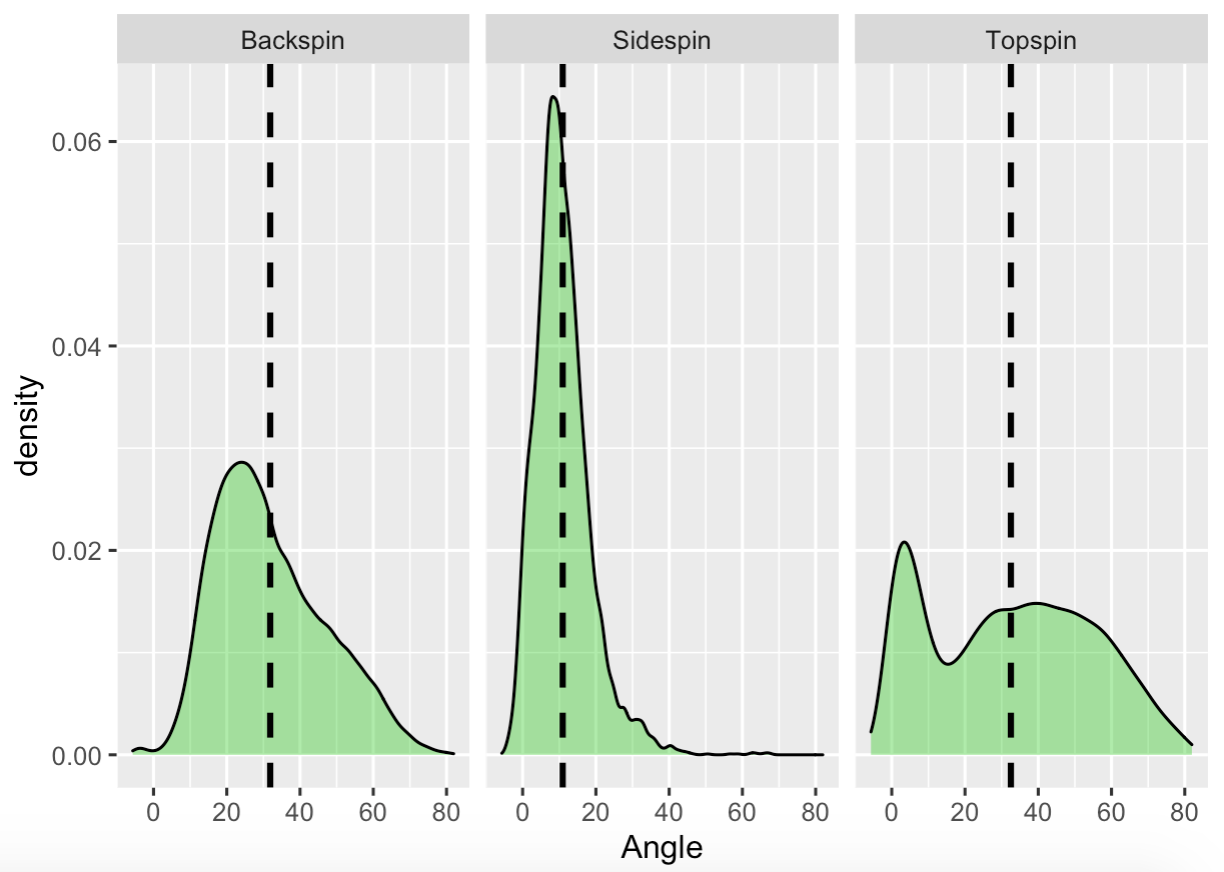
Huh. So top-spinning balls are in fact capable of achieving that 25–30-degree range. The distribution for back-spinning balls makes sense, as backspin is what causes lift. And since sidespin mutes distance, it also makes sense that they average the lowest launch angles, but the extremely narrow distribution is puzzling. Still, the mystery of topspin remains — that is, until we take exit velocity into consideration. Here’s the same graph as before, but with average exit velocity instead of launch angle:
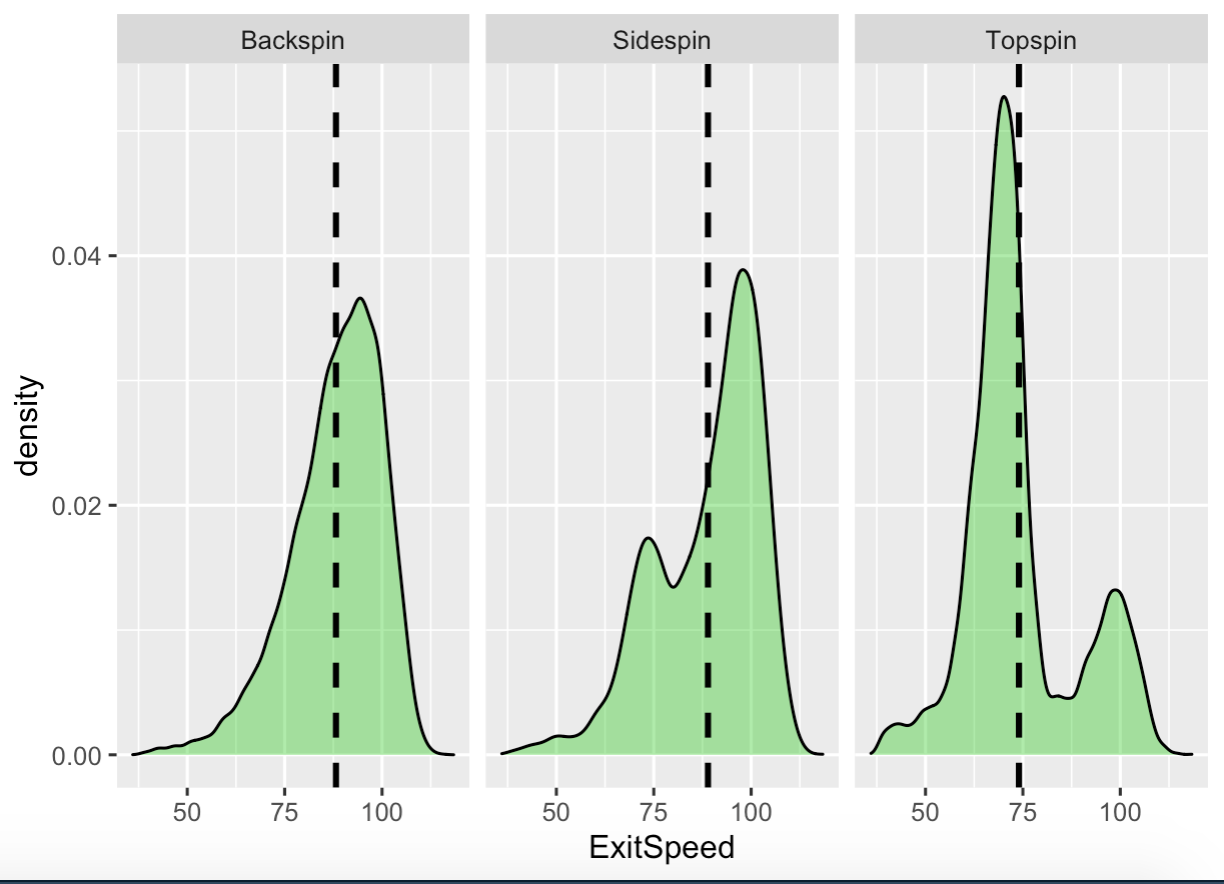
There we go. Save for a slight dip at around the 80-mph mark, balls with sidespin closely resemble those with backspin in terms of exit velocity. But balls with topspin are overwhelmingly driven with only a modicum of power. Now, it is possible for top-spinning balls to achieve the 95–100-mph range, but an educated guess is that our specific combination of exit velocity and launch angle is near-impossible.
Beyond that, a lot of what’s displayed here adds to the confusion. For example, I’m not sure what to make of a sudden spike in exit velocity in the distribution for top-spinning balls, or why topspin, unlike its cousins, seems to be distributed equally among various launch angles. Physics can probably tackle some of those questions, but for now, this is just what I found.
It also doesn’t help that the process of categorizing batted ball spin is imperfect. The basic rundown: In Trackman data, a spin axis of 180 degrees represents perfect backspin; therefore, an axis of zero or 360 degrees — which are functionally the same — represent perfect topspin. Everything in between the poles result in a mixture of either backspin or topspin and sidespin. There had to be hard cutoffs, though, which means that one ball put in the “topspin” group and another put in the “sidespin” group may only differ by a couple of degrees.
Maybe we can amend that. What if we tried to capture the ratio of back/topspin to sidespin in a given batted ball? For example, a ball hit at a 225-degree axis, which is right at the midpoint of pure backspin (180) and sidespin (270), would be assigned a ratio of 0.5. The scale is continuous, with each degree escalating the ratio ever so slightly. But after running the calculations, what followed were several trials and even more errors. Did this “spin ratio” do a better job of accounting for the gap between actual and expected distance? Nope — raw spin rate kicked its butt each time, even after controlling for multiple variables. And at first, spin ratio didn’t seem to help at all in explaining why certain back-spinning balls added more distance compared to others.
In the end, it helped to stick to a place that by now had become home: that narrow range of exit velocity and launch angle, the borderline hard-hit fly balls. Here’s how batted ball spin ratio ended up being incorporated:
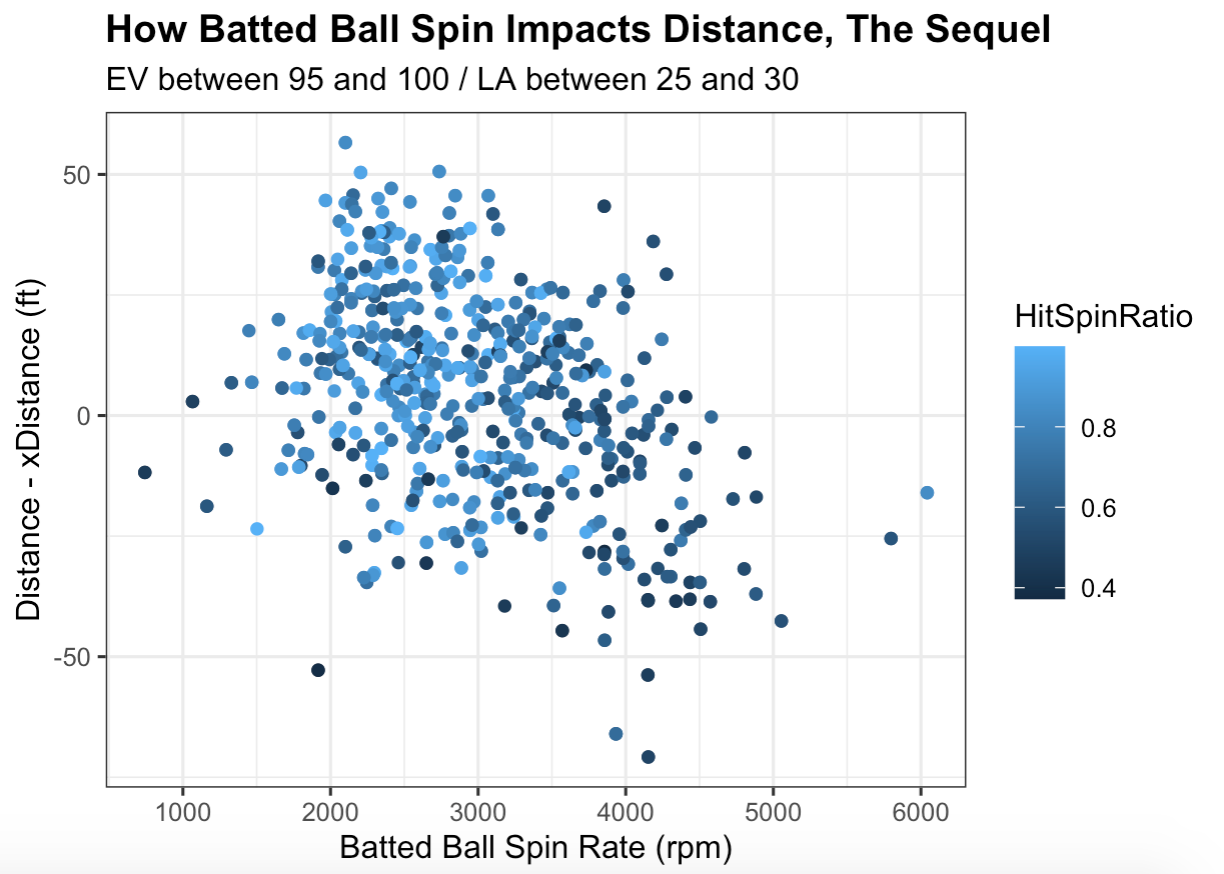
Remember the graph from the previous article? There’s a whole lot more going on in this upgraded version, both in terms of aesthetics and information. While the shades of blue are all over the place, splattered across the gridlines like a Jackson Pollock painting, there’s a general tendency for balls with higher spin ratios (i.e. more backspin) to outperform their expected distances. They also tend to have lower raw spin rates, which once again echoes Dr. Nathan’s comments: The introduction of sidespin disrupts the upward trajectory of a back-spinning ball. But also, this graph is a result of minor adjustments, such as the removal of balls categorized as sidespin, or ones that the Trackman operator deemed as having low-accuracy readings. We ended up with a much stronger correlation between batted ball spin rate and distance differential, which is awesome to see.
If you’ll recall, the previous article also introduced a FanGraphs community post, which assumed balls with more distance than expected must have been hit with backspin, whereas balls with less distance than expected must have been hit with topspin. But we now know that second part isn’t always true. If our favorite subset is any indication, the home runs hitters miss out on can be blamed on the influence of sidepsin rather than topspin, which doesn’t really appear in hard-hit balls. And though too much of it can hurt, the drawbacks of aiming for higher backspin are quite minimal. When I looked at individual college hitters with at least 50 fly balls, how often they imparted backspin had the strongest correlation (r = 0.70) to how much distance they added. That’s irrespective of how much sidespin was present.
In addition, while a sprinkle of sidespin may not help out in the fly ball department, it can certainly boost a hitter’s production on line drives. That narrow-ish hump from earlier representing hard-hit, side-spinning balls is what we’re after. What’s interesting about them is that they tend to fall on the high end of the backspin-sidespin spectrum, which means two things: These balls are getting enough distance to reach the outfield, and, in moderation, they’re adding the hook or fade that’s characteristic of a representative line drive.
Do you who’s really good at achieving a balance between backspin and sidespin? My goodness, that’s Kyle Manzardo’s music! Before slashing .313/.397/.458 in A-ball so far this season, the first baseman absolutely raked in college. And thanks to granular batted ball spin data, we can better understand why that was the case. Below, I’ve plotted every single Manzardo line drive at my disposal, with all the requisite variables:
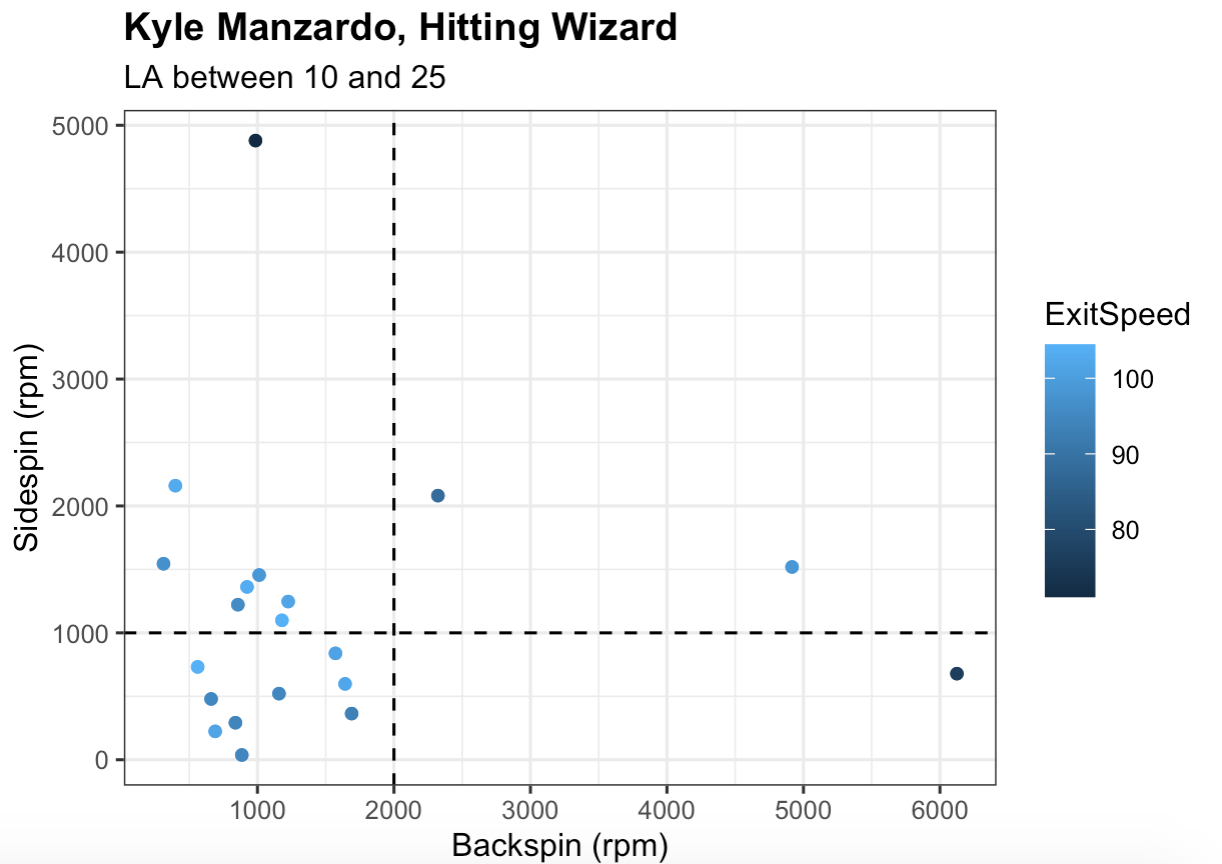
What immediately stands out is how many of his line drives are within or near the bottom-left quadrant, as established by the dotted lines. Consider how most of them came off the bat with more backspin than topspin, but not by a lot, and that their total raw spin rates aren’t overwhelming. It’s hard to pinpoint exactly what combination of spin type and amount maximizes results, but Manzardo’s clockwork regularity seems like a darn good approximation. Above all, check out those exit velocities; rarely did he fall short of the 90-mph mark, a feat that’s likely aided by his ability to generate backspin in the first place. Maybe it’s not so strange that the Rays, a model-driven organization, used their second-round pick on a prospect with little positional value and seemingly minimal pop to compensate. Manzardo may never reach 20 home runs in a season, but if he continues to smoke line drive after line drive, he won’t have to.
One final note: Even after accounting for which type of spin a hitter produced, the day-to-day fluctuations in batted ball spin persist. I’ll wrap things up here, though, because there are way more questions worth asking than I could possibly fit into a single article. Batted ball spin isn’t mainstream right now, mostly because the data isn’t public, but it might be within a few years. We already know hitters are generally either groundball or fly ball hitters, and that some of them are better at getting the most out of their batted ball than others. The million dollar question, then, is how. Which hitters’ achievements lie beyond the realm of exit velocity and launch angle, and what processes have led to them? For that, perhaps we’ll need a new spin — a batted ball spin, that is.
Author’s Note: You can read Dr. Nathan’s excellent research on fly ball carry here.
Justin is an undergraduate student at Washington University in St. Louis studying statistics and writing.
I’d be curious to see if there is any relationship between the actual pitch spin characteristics and batted ball spin characteristics. For example, a top-spinning curveball might have more backspin when hit because spinning objects can reverse spin direction when they collide with something.
Pretty sure I’ve read that pitch spin has v little to no effect on batted ball spin, probably from Alan Nathan. But curveballs can be hit with more backspin b/c of their flight path.
While what you say about spin reversal is true, the devil (as they say) is in the details. And the details are that the spin on a batted ball is not very dependent on the spin of the pitch. Although a bit technical, you can read about it here: http://baseball.physics.illinois.edu/ProcediaEngineering34Spin.pdf.
Interesting.
For example, a ball hit at a 235-degree axis, which is right at the midpoint of pure backspin (180) and sidespin (270)
-Isn’t the midpoint 225 degrees?
I don’t understand the Kyle Manzardo chart. How can a hit have both topspin and backspin?
I think he means sidespin rather than topspin. In a simple picture of the ball-bat collision, the backspin depends primarily on the launch angle while the sidespin depends on the spray angle (and is minimized close to straightaway CF). Since sidespin increases the drag without providing any lift, balls hit with low sidespin (which are those hit in the general direction of CF) carry best. That is the topic of the my article that Justin linked to near the end. I also talked about this at this year’s SABR Analytics Conference. If you have 30m to spare, you can watch it here: https://www.youtube.com/watch?v=IG4D7xXnoE0&list=PLoutIBy8VY98rGSUkJwvCaI_XJHgCLLCj&index=4
I would imagine that the angle of contact with the bat would also significantly contribute to any imparted side spin as well as whether the batter’s bat path leads to the “face” of the bat being dragged across the ball as they make contact. If one or both of these are the cause there should be an asymmetry to the angle of side spins that are created by particular causes.
And there is. Watch the video I linked to just above.
I didn’t have time to watch it earlier before commenting, but I am very excited to do so in the very near future. Aka tomorrow. I am very interested in the pure physics of baseball so I cannot promise that I will not reach out looking for more first principle based analysis.
Your comment leads to a question that has mystified me. I have always been amazed by the angle of Freddie Freeman’s bat. I have a reasonable idea of the fact that most balls, in any sport, are some combination of side spin and either topspin or backspin. Whether it is a hook or a slice in golf, a sliced backhand or a topspin lob in tennis, a topped roller down the 3rd base line or the flyball ball down the line which clearly curves, all these balls in motion have a dominant axis. For example a sharply hit low liner down the line might have more side spin than backspin while a lazy fly to straight away center comes as close to pure backspin as could be achieved. I can understand how a level bat angle could hit a perfectly straight flyball to CF but could never get a handle on what the spin characteristics would be on really any ball that Freeman hits. Professor Nathan, I am about to watch the video you linked to but I am afraid it will above my pay grade
Professor Nathan, I have returned after watching your video and feel comfortable with my basic understanding of the effects of spin on lift, drag and distance. I was surprised by the fact that balls hit to straight away CF had significant side spin. The difference between that and a straight drive in golf is probably because the golf ball is stationary when it is hit. It is clear that if balls travelled the same distance regardless of the effect of side spin then stadiums would have uniform distances to all fields instead of shorter foul lines and deeper Center Fields.
Oh no! That’s supposed to be sidespin on the y-axis; can’t believe I didn’t catch that. And yes, 225 not 235. Will fix promptly.
I think you have one more reference to topspin that should be sidespin?
> Consider how most of them came off the bat with more backspin than topspin, but not by a lot…
You have total spin and spin axis right? How did you derive sidespin and backspin?
This is just a general comment about hitting strategies. I have always felt that topspin is the desired spin for a low launch angle line drive. You want the ball to just clear the infielders, then take a nosedive ( due to the topspin) so that it falls in front of the outfielder. Tennis players use this strategy to clear the net on a hard hit ball, with the topspin keeping the ball in the court. Backspin would give lift, holding the ball up to give the outfielder a better chance to catch up with it. But if you’re swinging for the fences, the strategy is lots of backspin (up to about 3000 rpm) and very little sidespin to get maximum distance.
I did some queries based on balls hit 90-100 mph, more backspin is better at ~10 degrees and ~25 degrees, while less backspin is better at ~15 and ~20 degrees (I approximated spin by filtering for above or below average actual distance for each bucket). Matches the eye test, you need backspin to get over the infield at 10 deg and 90-100mph, but it’s rarely carrying far enough for the OF to catch it. 15 and 20 deg, what you described is (probably) happening.
Thank you for diving in on this. Excited to see where our community continues to take this discussion!