Buying Low on Miguel Cabrera
At 34, in the middle of his worst season so far and with $200 million left on his contract, Miguel Cabrera hasn’t inspired many trade rumors this year — and perhaps rightfully so. But that doesn’t mean he hasn’t inspired any. His general manager said he would listen on veterans, and Alex Rodriguez floated the idea that Cabrera would make sense in Boston.
Is there a chance Cabrera could be moved by the end of August? To determine if such a deal would be desirable for both the Tigers and a prospective trading partner requires multiple considerations, from Statcast to the weather, from aging curves to the cost of a win.
The most compelling argument for acquiring Cabrera is that he’s still a premier slugger in the game. Or, at least, there’s some evidence that he should still be a premier slugger in the game, if the batted-ball data is any indication. Statcast identifies Cabrera as possessing the second-biggest differential between his real and expected outcomes. He’s hitting the ball hard and in good angles! Buy!
Scan down the list, and you may immediately notice three other Tigers prominently placed. Tyler Collins and Alex Avila join Cabrera in the top 25, and James McCann, Nick Castellanos, Andrew Romine and J.D. Martinez have also been unlucky by their metric. Seems like there might be something brewing in Michigan.
Let’s take a look at those Tigers and how they’ve faired at home and away. In particular, we find that Cabrera has enjoyed recorded exit velocities that are nearly four ticks faster at home.
| Player | Results | Home | Away | Diff |
|---|---|---|---|---|
| Dixon Machado | 30 | 89.8 | 81.6 | 8.2 |
| JaCoby Jones | 8 | 89.5 | 83.6 | 5.9 |
| Miguel Cabrera | 107 | 93.4 | 89.8 | 3.6 |
| Andrew Romine | 68 | 85.3 | 82.0 | 3.3 |
| Victor Martinez | 121 | 90.3 | 87.2 | 3.1 |
| Tyler Collins | 42 | 90.9 | 88.3 | 2.6 |
| Mikie Mahtook | 58 | 90.0 | 87.9 | 2.1 |
| Nick Castellanos | 133 | 91.0 | 89.3 | 1.7 |
| John Hicks | 24 | 87.3 | 86.8 | 0.5 |
| J.D. Martinez | 80 | 91.5 | 91.4 | 0.1 |
| Alex Avila | 81 | 91.5 | 92.5 | -1.0 |
| Jose Iglesias | 120 | 81.4 | 82.5 | -1.1 |
| James McCann | 62 | 87.7 | 88.9 | -1.2 |
| Ian Kinsler | 147 | 85.6 | 87.8 | -2.2 |
| Justin Upton | 107 | 87.7 | 90.1 | -2.4 |
| Alex Presley | 35 | 85.4 | 89.0 | -3.6 |
| Jim Adduci | 21 | 86.1 | 94.8 | -8.7 |
Nobody on the Tigers with at least 50 balls in play has seen as big a difference between their home and away exit velocities as Cabrera. But there’s also a general trend here. If you weight the exit velos for all the Tigers by home and away plate appearances, you get a .77 mph difference between the club’s exit velos on the road and at home.
So, that’s interesting. It seems possible that Statcast has introduced a secondary park factor just by existing. We knew temperature and altitude were big deals when it came to how far the ball would travel, but now it looks like the machines themselves, and their various calibrations, are adding a layer of difference between parks.
How normal is it for such a differential to exist? To determine that very thing, I examined the average exit velocities in all 30 major-league stadiums. Doing so reveals that Comerica Park has produced the second-highest batted-ball speeds. Balls do travel faster in hot weather, of course, so you can add a weather adjustment, as Andrew Perpetua has done in his expected stats numbers. Detroit (and Cincinnati) still have something weird going on.
| Stadium | League Average Exit Velo | Temperature | Temp Adjustment | Temp Adjusted Exit Velo |
|---|---|---|---|---|
| Baltimore | 88.7 | 73.8 | 0.26 | 88.4 |
| Detroit | 88.5 | 70.1 | 0.23 | 88.3 |
| Washington | 88.4 | 77.1 | 0.30 | 88.1 |
| Arizona | 88.4 | 82.2 | 0.36 | 88.0 |
| Oakland | 88.2 | 68.3 | 0.18 | 88.0 |
| Los Angeles | 88.1 | 74.0 | 0.26 | 87.8 |
| New York (NL) | 87.8 | 68.4 | 0.20 | 87.6 |
| Boston | 87.5 | 67.4 | 0.19 | 87.3 |
| Houston | 87.6 | 74.3 | 0.30 | 87.3 |
| Minnesota | 87.4 | 68.3 | 0.20 | 87.2 |
| Seattle | 87.3 | 65.4 | 0.16 | 87.1 |
| Chicago (NL) | 87.3 | 68.8 | 0.20 | 87.1 |
| Kansas City | 87.2 | 80.0 | 0.33 | 86.9 |
| Texas | 87.2 | 81.9 | 0.36 | 86.8 |
| Cleveland | 86.9 | 70.9 | 0.23 | 86.7 |
| Philadelphia | 86.9 | 73.0 | 0.26 | 86.6 |
| Toronto | 86.8 | 69.1 | 0.18 | 86.6 |
| Milwaukee | 86.6 | 71.4 | 0.23 | 86.4 |
| Anaheim | 86.6 | 73.2 | 0.25 | 86.4 |
| Tampa Bay | 86.4 | 72.0 | 0.29 | 86.1 |
| St. Louis | 86.3 | 76.8 | 0.29 | 86.0 |
| Chicago (AL) | 86.2 | 66.6 | 0.20 | 86.0 |
| New York (NL) | 86.2 | 70.8 | 0.23 | 86.0 |
| Colorado | 86.2 | 73.5 | 0.26 | 85.9 |
| Atlanta | 86.0 | 76.1 | 0.30 | 85.7 |
| Pittsburgh | 85.8 | 72.7 | 0.26 | 85.5 |
| Miami | 85.8 | 76.5 | 0.30 | 85.5 |
| San Francisco | 85.5 | 62.1 | 0.11 | 85.4 |
| San Diego | 84.0 | 68.1 | 0.19 | 83.8 |
| Cincinnati | 83.9 | 74.4 | 0.28 | 83.6 |
What’s weird is that, even after adjusting raw exit velocity for park and temperature, Miguel Cabrera is… still the second unluckiest player in the majors. He should be hitting .295/.379/.503 instead of the .256/.346/.422 he’d recorded entering play yesterday.
Here’s one thing for which it’s impossible to adjust, just yet anyway: outfield walls. The sample gets too small when you bin balls by exit velocity and launch angle and then limit it to the park. So, let’s look at Cabrera’s batted balls this year overlaid on a map of his park.
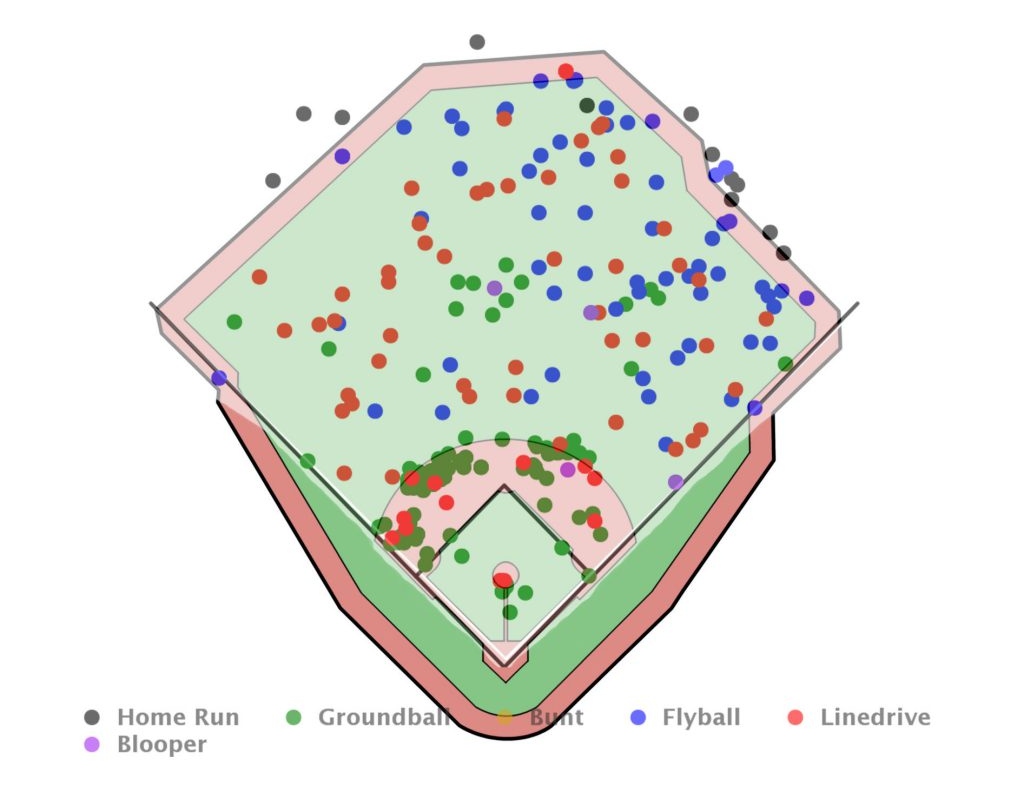
Look at that right-field cut out. It’s probably costing Cabrera a homer or three. And it might be a problem for pull-power lefties, too. Take a look at that area of the park, and it immediately stands out when you’re scanning the outfield.

If you were a general manager contemplating an acquisition of Cabrera, you may want to compare Comerica to your own park factors. Take Citi Field just as an example, in the image created by Perpetua below. Yeah, right field at Comerica is tough on righties with oppo power or pull-power lefties.
Before we draw any conclusions, however, we should look really quickly at Cabrera’s spray chart last year.

Wait up. That’s different. Here we find a healthy collection of homers all along the left-field wall. This year? Not so much. And the numbers support what these charts suggest. Consider: only 10 qualified batters saw their pull percentage go down more from last year (37.8%) to this year (32.6%). He’s not poking them out to left-center any more.
Where did Cabrera’s pull power go? Well, some of is it just where he’s being pitched. Look at the heat maps below, for example. On the left is 2016; on the right, 2017. Cabrera was getting jammed in on his hands more last year with fastballs.

So that’s an explanation. But if Cabrera can’t pull those pitches down the middle that you see in the heat map on the right, isn’t there a problem?
We know that barrels to certain parts of the park don’t do as well as barrels to other parts, that horizontal spray is important, and that the power alleys are generally where you want to aim. Cabrera used to be brilliant at hitting both power alleys, and now he’s only going oppo. His pull power has been zapped by something.
If you return to his “expected” line, you’ll notice that Cabrera’s expected .882 OPS is actually below his Steamer projected rest-of-season OPS (.939). Given the ups and downs we’ve uncovered while looking at that expected line, and the fact that he’s been battling a groin injury and now has added a collarbone issue, it might be a bit much to expect anything more than his Steamer output, which would make him a league-average first baseman. Given the most recent price-per-win numbers, you might want to pay something like $20-25 million dollars a season for that production. Cabera is due $30 million a year for the next six seasons, and we haven’t even begun to add aging effects.
And that’s the math that means that we probably won’t see Miguel Cabrera in a new uniform on August first. Even if the Tigers swallowed half of what was left, it’s hard to see teams considering that package of price and production worth trading for. If you’re just a fan rooting to see the Cabrera of old, watch the health updates. A working collarbone and pain-free groin could be all he needs to recover some of his pull power.
With a phone full of pictures of pitchers' fingers, strange beers, and his two toddler sons, Eno Sarris can be found at the ballpark or a brewery most days. Read him here, writing about the A's or Giants at The Athletic, or about beer at October. Follow him on Twitter @enosarris if you can handle the sandwiches and inanity.
This is your fate Red Sox fans…
That contract will last longer than a French Republic. Pass.
You know, that whole statcast calibration “park factor” thing really deserves a post of its own. IMO it’s more interesting — and certainly potentially more enduringly relevant — than the expensive-aging-slugger-at-the-deadline story du jour. At least for me, you buried the lede.
There was a good community post on this last month:
http://www.fangraphs.com/community/detroits-batted-ball-readings-are-hot/
Also Andrew Perpetua, creator of xStats, had a write up on ballpark velocity reading discrepancies on Rotographs:
http://www.fangraphs.com/fantasy/home-and-road-exit-velocity/
Top 10 teams in ISO:
AStros
Dodgers
Mets
Nats
Brewers
Rangers
Cubs
Reds
DBacks
A’s
Bottom 10 teams in ISO (in reverse order so 30 to 21):
GIants
Red Sox
Angels
Pirates
Braves
Phils
White Sox
Twins
Mariners
Marlins
THere are other stats you could use but doesn’t the chart on ballpark exit velo just show that the good hitting teams hit it hard and the bad hitting teams don’t? I mean Cincy is an obvious counterpoint there but I would bet ANYTHING that their stats are heavily influenced by giving a ton of PA to both Billy Hamilton (78.8 mph exit velo) and Jose Peraza (81.5).
I find it impressive that despite injuries Cabrera is spanking the ball, even if it’s to the wrong areas of the field. Miggy has notoriously played hurt throughout his career so it seems to be a reasonable takeaway that he’s missing the ball by the centimeter that his injuries may have taken away. Maybe it’s also reasonable to assume his bat speed is a touch slower, leading to more opposite field batted balls in the first place. You don’t seem many ML hitters hit 13 oppo homers like Miggy did last year (judging by your 2016 chart) so maybe age is a factor as well.
Regardless, hitting the ball hard is a good sign and is still the biggest takeaway despite how long he’s “struggled” this year. xwOBA is never going to tell the full story but it is definitely significant in Miggy’s case since a .370+ xwOBA is ridiculous no matter how it’s being done.
You can “root for the Cabrera of old” in multiple ways now!
What’s Miggy’s value? How close are the White Sox? Would you flip one good prospect or two with a high ceiling to have another stable middle of the order DH?
I don’t think Miggy is seeing the ball well at the moment. Allow me to share a sequence from Friday night’s game:
https://gfycat.com/generaladorableduck
On the 1-1, we see Cabrera swinging and missing at a 91 MPH fastball pretty much right down the middle. That’s not really characteristic of Cabrera (or most MLB hitters). Last year that pitch likely would have been deposited into the right field bleachers.
And then the cricket swing at a pitch at the ankles to strike out. How often do you see a cricket swing from Miguel Cabrera?
Actually he doesn’t and never has had the best discipline or at least never showed it. He’s always had amazing hand eye coordination and tended to swing at bad pitches but could always hit them hard. I think maybe he needs to start laying off those pitches until he can hit them again.