Can the Reds Figure Out Kevin Gausman?

To say that Kevin Gausman has been a frustrating pitcher to his fans and employers alike would be an undersell. Debuting in the majors in 2013 for the Baltimore Orioles, he’s passed the two-WAR mark in four seasons and only failed to hit the one-WAR threshold when he threw just 47.2 innings in his rookie campaign. But while Gausman has been a contributor, given his top-prospect status, his ability to hit the high-90s, and his possession of a knee-buckling splitter, his career still feels curiously underwhelming. His unusually robust first-half/second-half splits certainly don’t help the common perception of Gausman, with his second halves (ERA of 3.63) needing to deflate the ERAs from his first halves (4.96).
Now Gausman joins his third organization of the last year. And at the nadir of his value too; while the Braves didn’t give up any elite prospects to pry Gausman from the Orioles in 2018, they at least gave up actual prospects. The Cincinnati Reds only needed a waiver claim to bring Gausman to town, essentially committing to nothing more than paying the rest of his 2019 salary.
Gausman’s history of at least moderate respectability works in his favor, but that 6.19 ERA is hard to completely forget about. With a FIP of 4.21, there’s a massive discrepancy between his actual run prevention and the run prevention suggested from his peripheral stats. The tricky part then becomes figuring out which stat to believe more, so we need to do further digging.
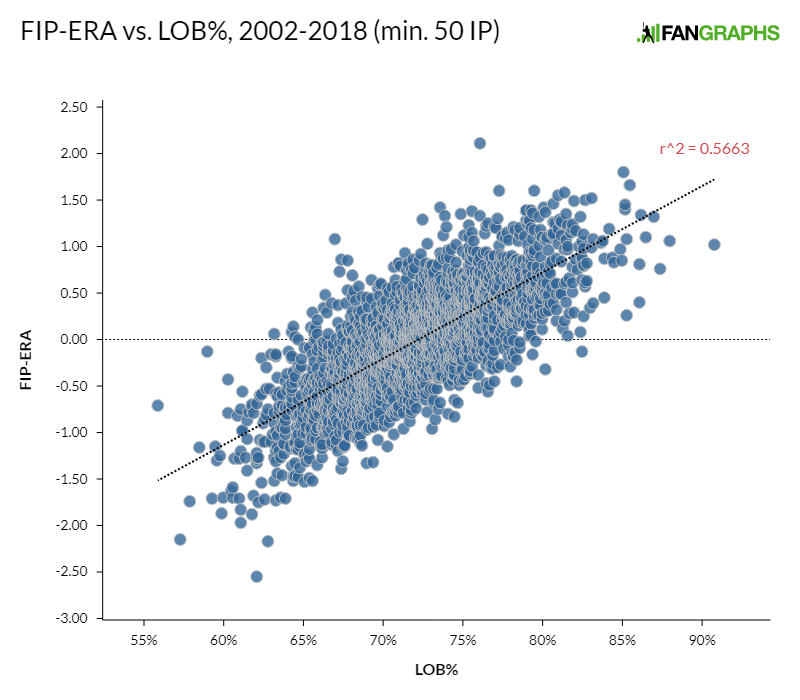
The first place to check is Gausman’s LOB%. At 59.3%, his rate is the third-worst in baseball among pitchers with 50 innings, behind only Pedro Báez and Jordan Zimmermann. To my eternal surprise, it doesn’t seem to be talked about very often, but there’s literally nothing that’s a bigger factor on ERA/FIP discrepancy than the player’s strand rate. From 2002 to today, there have been 2,511 player-seasons of at least 100 innings. Looking at the relationship between FIP-ERA and a player’s LOB% in the simplest way, you get a coefficient of determination of 0.57. In layman’s terms, 57% of the variance of a pitcher’s FIP vs. ERA discrepancy can be reasonably chalked up to the variance in LOB%.
Ranking the pitchers from worst strand rate, you have to get to the 69th player on the list, Scott Feldman in 2008, to find a player whose ERA treated nicely and resulted in a FIP-ERA above zero.
Of the 30 pitchers with the worst LOB% over that period that came back the following season, 24 of them saw ERA improvements, with the whole group averaging a 0.87-run improvement in ERA and the 24 pitchers that actually improved averaging a 1.28-run gain.
| Name | Season | LOB% | ERA | FIP | FIP-ERA | Year 2 ERA | ERA Improvement |
|---|---|---|---|---|---|---|---|
| Glendon Rusch | 2003 | 62.10% | 6.42 | 3.87 | -2.55 | 3.47 | 2.95 |
| Esteban Loaiza | 2002 | 63.20% | 5.71 | 4.19 | -1.52 | 2.90 | 2.81 |
| Marcus Stroman | 2018 | 60.50% | 5.54 | 3.91 | -1.63 | 3.07 | 2.47 |
| Joe Kennedy | 2003 | 62.50% | 6.13 | 5.03 | -1.10 | 3.66 | 2.47 |
| Clay Buchholz | 2014 | 62.10% | 5.34 | 4.01 | -1.33 | 3.26 | 2.08 |
| Derek Lowe | 2004 | 58.50% | 5.42 | 4.26 | -1.16 | 3.61 | 1.81 |
| Luke Hochevar | 2009 | 59.30% | 6.55 | 4.84 | -1.71 | 4.81 | 1.74 |
| Mark Hendrickson | 2005 | 62.20% | 5.90 | 4.63 | -1.27 | 4.21 | 1.69 |
| Andy Sonnanstine | 2007 | 60.60% | 5.85 | 4.26 | -1.59 | 4.38 | 1.47 |
| Jordan Lyles | 2013 | 63.10% | 5.59 | 4.57 | -1.02 | 4.33 | 1.26 |
| Aaron Nola | 2016 | 60.60% | 4.78 | 3.08 | -1.70 | 3.54 | 1.24 |
| Scott Feldman | 2012 | 61.00% | 5.09 | 3.81 | -1.28 | 3.86 | 1.23 |
| Scott Feldman | 2008 | 63.20% | 5.29 | 5.35 | 0.06 | 4.08 | 1.21 |
| Jose Contreras | 2007 | 62.60% | 5.57 | 4.71 | -0.86 | 4.54 | 1.03 |
| Cory Lidle | 2003 | 59.80% | 5.75 | 4.50 | -1.25 | 4.90 | 0.85 |
| Bartolo Colon | 2017 | 61.40% | 6.48 | 5.21 | -1.27 | 5.78 | 0.70 |
| Jeremy Bonderman | 2003 | 61.50% | 5.56 | 4.69 | -0.87 | 4.89 | 0.67 |
| Odalis Perez | 2006 | 61.90% | 6.20 | 4.52 | -1.68 | 5.57 | 0.63 |
| Micah Owings | 2008 | 61.10% | 5.93 | 4.73 | -1.20 | 5.34 | 0.59 |
| Ricky Nolasco | 2009 | 61.00% | 5.06 | 3.35 | -1.71 | 4.51 | 0.55 |
| Jeremy Sowers | 2008 | 62.70% | 5.58 | 5.05 | -0.53 | 5.25 | 0.33 |
| Jake Westbrook | 2005 | 62.90% | 4.49 | 3.96 | -0.53 | 4.17 | 0.32 |
| Seth McClung | 2005 | 61.20% | 6.59 | 5.61 | -0.98 | 6.29 | 0.30 |
| Tim Wakefield | 2010 | 60.90% | 5.34 | 4.52 | -0.82 | 5.12 | 0.22 |
| Craig Stammen | 2009 | 60.30% | 5.11 | 4.68 | -0.43 | 5.13 | -0.02 |
| John Thomson | 2002 | 63.00% | 4.71 | 4.55 | -0.16 | 4.85 | -0.14 |
| Jordan Lyles | 2012 | 61.20% | 5.09 | 4.53 | -0.56 | 5.59 | -0.50 |
| Luke Hochevar | 2008 | 62.30% | 5.51 | 4.43 | -1.08 | 6.55 | -1.04 |
| Edwin Jackson | 2013 | 63.30% | 4.98 | 3.79 | -1.19 | 6.33 | -1.35 |
| Brian Bannister | 2009 | 62.40% | 4.73 | 4.14 | -0.59 | 6.34 | -1.61 |
It’s not as if Atlanta’s bullpen having problems in 2019 is something that nobody knows about. Projected at 18th in baseball in our preseason power rankings, the team has only gotten four innings from the top two projected relievers coming into the season, Arodys Vizcaíno and Darren O’Day. O’Day’s been suffering from forearm issues since March and Vizcaino’s out for the season and now a Seattle Mariner anyway.
Nor has Gausman been hit particularly hard, something else which can directly lead to a FIP-ERA discrepancy and something the pitcher has more control over. Gausman’s average exit velocity of 86.9 mph is actually two notches slower than in 2018 and better than his 87.7 mph over the five seasons for which we have these numbers. Overall, Statcast’s estimate from the velocity/angle data is that Gausman “should” have a .259 BA and a .449 SLG against. In actuality, it is a .290 BA and .467 SLG. In other words, Gausman’s not exactly a secret Cy Young candidate, but he’s been pitching a lot more like a league-average hurler than one with an ERA north of six.
ZiPS, which uses these numbers slightly differently and combines it with other plate discipline numbers, concurs with Statcast and FIP in this case. ZiPS “expects” Gausman to have a .308 BABIP based on his numbers, not .345, and this discrepancy also holds true with the various “z” numbers ZiPS calculates for homers, walks, and strikeouts. ZiPS believes that Gausman’s data suggests that he “should have” allowed three fewer homers and five fewer walks than his actual numbers with the Braves, while it also sees Gausman’s career-best strikeout numbers as right on the money. The difference in zBB and zHR alone trims a full run off Gausman’s seasonal ERA before even addressing the BABIP.
With the Reds realistically out of contention at this point in 2019 but with a roster that could very well contend in 2020, Gausman becomes an interest rotation candidate. After all, he does have a long history of being a league-average starting pitcher, if a fairly disappointing one, and that has real value to a team. By picking up Gausman now rather than over the winter, the Reds get a few months to evaluate him before having to make a decision on whether to tender him a contract for 2020, his final year in arbitration. It’s a small sample size, for sure, but Derek Johnson’s shown an aptitude for working with starting pitchers with the Brewers from 2016-2018 and now the Reds in 2019.
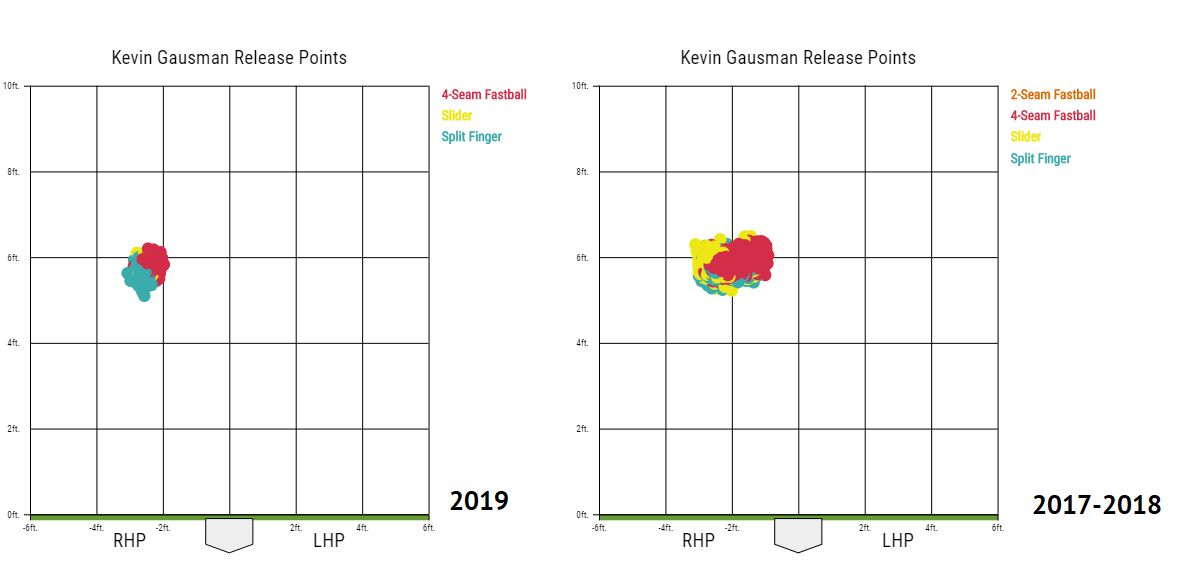
The question is, just how high is Gausman’s ceiling at this point? He no longer tops out in the high-90s as he did earlier in his career, and he’s struggled to develop his repertoire after his fastball and splitter. He’s abandoned his slider in 2019 and nearly doubled usage of his splitter from a few years ago, which has had the nice side effect of cleaning up his release point consistency.
Starting pitchers have survived being largely fastball/splitter throwers in the past after losing significant velocity; Roger Clemens and Curt Schilling at the ends of their respective careers are probably the most wildly optimistic examples of this. Matching Clemens and Schilling as a pitcher is, naturally, a tall order, but it would still be nice to see Gausman able to develop something more east-west than just the movement on his fastball (Gausman’s only positive wRC pitch is that aforementioned splitter). Even if this never happens and he can’t be a plus as a starter long-term, the trimmed repertoire is something that has served other closers before: Koji Uehara survived for a long time in this manner and Kirby Yates has been rocking the NL since abandoning his slider and going fastball-splitter.
Picking up Kevin Gausman risks nothing but money for the Cincinnati Reds. And if they match their recent success at bumping every starting pitcher they touch up a tier, the Braves and the NL teams with worse records may very well regret passing on the right-hander.
Dan Szymborski is a senior writer for FanGraphs and the developer of the ZiPS projection system. He was a writer for ESPN.com from 2010-2018, a regular guest on a number of radio shows and podcasts, and a voting BBWAA member. He also maintains a terrible Twitter account at @DSzymborski.
Gray, Castillo, Bauer, Wood, Disco, Mahle, Gausman… 😮
I think Wood might be a FA after the season.
Woods a free agent after this season.
However…I wouldn’t be surprised if he takes a pillow contract with the Reds to rebuild his value.