Carlos Santana Goes Another Way
Editor’s note: Jake has previously written at Lookout Landing, and was a FanGraphs Resident in 2018. He’ll be contributing to FanGraphs a few times a week, and we’re excited to welcome him.
With “elevate and celebrate” now a totally normal part of the current baseball vernacular, it’s easy to assume that any given offensive breakout is being driven by an increase in launch angle and a corresponding surge in power. Carlos Santana isn’t exactly breaking out; he’s already a well-established and productive hitter. But after a down 2018 in Philadelphia, he’s rebounding in a big way back in Cleveland, and the most interesting thing about Santana’s resurgence is how his batted ball profile has changed.
From 2010 to 2017, Santana was a fixture in the middle of the Indians lineup, compiling a 123 wRC+ across more than 4,700 plate appearances. He’s made at least 600 plate appearances in each full season he’s played, showing a remarkable amount of consistency and durability. A strong approach at the plate has led to an excellent strikeout-to-walk ratio throughout his career, forming a solid foundation for his overall offensive contributions. But he’s always struggled with a low BABIP. He’s not the most fleet of foot and his 13.9% career pop-up rate is far too high. That has led to some streaky hitting based on the whims of the batted ball gods.
That flawed batted ball profile really betrayed him in his one year away from Cleveland. In Philadelphia, Santana posted his highest fly ball rate since his rookie year and the second-highest pop-up rate of his career. Opposing teams have often shifted against him, but that rate increased a significant amount last year. As a result, his BABIP floundered to a career-low .231, and he ended up posting the second-lowest wRC+ of his career — just 109.
Traded back to Cleveland this offseason by the Seattle Mariners, Santana has regained his hitting stroke. He’s posting career-highs across his slash line, leading to a 144 wRC+, the ninth-best mark in the American League. Just a glance at his batted ball profile reveals a completely different hitter:
| Year | LD% | GB% | FB% | IFFB% | Pull% | Hard% |
|---|---|---|---|---|---|---|
| 2018 | 16.0% | 40.3% | 43.7% | 17.9% | 48.0% | 32.8% |
| 2019 | 16.1% | 50.0% | 33.9% | 6.3% | 38.7% | 46.2% |
| Career | 18.2% | 42.5% | 39.3% | 13.9% | 51.6% | 33.6% |
Instead of leaning into hitting the ball in the air to break out of his struggles, Santana is now hitting the ball on the ground more often than ever. But he’s paired that career-high ground-ball rate with a huge increase in hard hit rate. Now since he’s a switch hitter, you almost have to break him down as two separate hitters. As a left-handed batter, his batted ball profile looks more similar to his career norms — his ground-ball rate is a touch higher than normal but he’s still hitting plenty of fly balls. But once he flips to the other side of the plate, he looks completely different. As a right-handed batter, he’s putting the ball on the ground almost 60% of the time, but he has actually posted a higher hard hit rate than as a lefty.
With his average launch angle lowered by more than six degrees, it should be no surprise to see that his pop-up rate has also taken a steep dive. He’s cut more than 11 points off of where it was last year and cut his career rate in half.
He’s also made a concerted effort to become less pull-happy. He’s pulled more than half the balls he’s put in play during his career, the sixth-highest mark in the majors since his debut in 2010. No wonder teams were so eager to shift against him. This season he’s dropped his pull rate by 10 points to 38.7%:
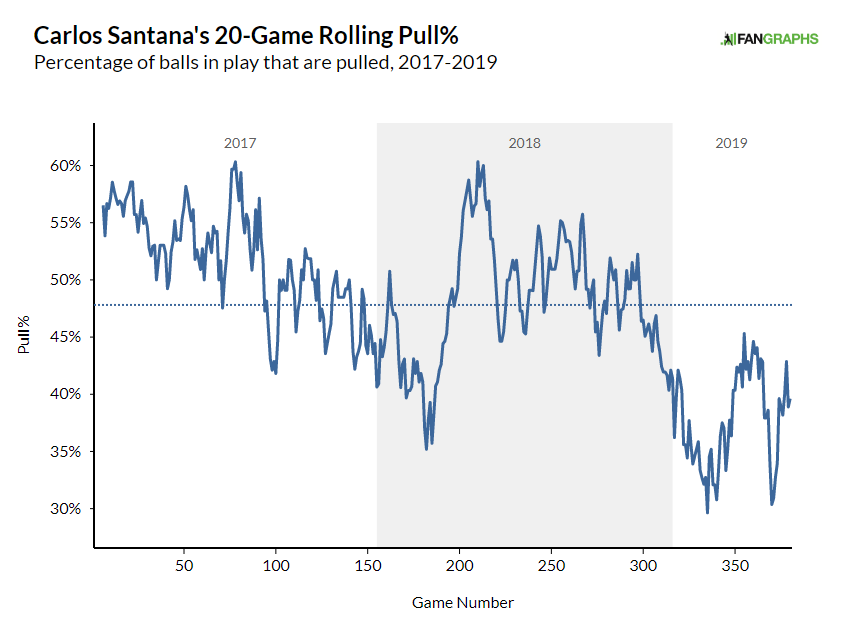
His batted balls are now much more evenly distributed around the field, and this is true from both sides of the plate. Opposing teams are still shifting against him more than 80% of the time, but he’s now beating them by refusing to simply pull every pitch he sees. As a result, his wOBA against the shift has jumped up to .313 this season.
Fewer pop ups, more ground balls, and a 4-mph increase in average exit velocity will definitely help your BABIP, and Santana’s is up to .303 so far this year. All these changes to his batted ball profile aren’t simply a return to business as usual after a down year in Philadelphia. We’re seeing a completely different hitter than what we’ve seen from Santana before.
I went back through the Baseball Savant video archives to see if anything has changed mechanically for Santana this year. I tried pulling from the same stadium so that the camera angles matched up, and Marlins Park was the winner. Here’s Santana’s swing last year:
And here it is this year:
Santana is definitely standing more upright in his stance, and he’s much quieter with his body this year. With a big leg kick and a swing that looks max effort every time, all that extra movement with his hands was extraneous. In comparison, everything looks simplified this year. It seems like he’s focused on making hard contact no matter where the pitch is thrown while still maintaining control of his swing. He’s still capable of pulling the ball in the air to generate power, but he’s become a more complete hitter by selectively using that approach instead of selling out for pull power all the time.
The adjustments Santana has made have really paid dividends for the Indians this year. He’s been their most productive hitter and one of the few bright spots in a frustrating season. Santana’s new approach at the plate has helped him post career-best numbers across the board — even if that approach runs counter to the trendy “elevate and celebrate” crowd.
Jake Mailhot is a contributor to FanGraphs. A long-suffering Mariners fan, he also writes about them for Lookout Landing. Follow him on BlueSky @jakemailhot.
The table and the 2nd paragraph after don’t sync. The paragraph says he’s cut his IFFB% but the table shows 13.4% last year, 17.9% this year and career 6.3%. Seems the table is off – looking at his player page it looks like you got his 2017, 2018, 2019 numbers rather than his 2018, 2019, career numbers.
Whoops. Fixed.