Archive for 2018 Replacement-Level Killers

The 2018 Replacement-Level Killers: Center Field and Designated Hitter

Bradley Zimmer’s injury has created a vacuum in center field for Cleveland.
(Photo: Erik Drost)

They can’t all be Mike Trout, and this year, with the Millville Meteor posting a career-best 191 wRC+, the rest of the center-field pack has been as unproductive as any time in recent history. The collective 95 wRC+ recorded by all center fielders (including Trout) is the lowest it’s been since 2006, back when Trout was a high-school freshman.

Even with that fairly modest production, only a small handful of contenders — which for this series I’ve defined as teams with playoff odds of at least 15.0% (a definition that currently covers 15 teams) — are receiving less than 1.0 WAR from their center fielders, which makes them eligible for a spot among the Replacement-Level Killers.

By the way, since I don’t have anywhere else to put it — this is the last article in the series, since the RLK concept doesn’t work so neatly for pitchers and just one AL team has a DH who could be classified a Killer. Sorry if that was awkward; continue as you were…

Read the rest of this entry »


The 2018 Replacement-Level Killers: Corner Outfielders

Left field, where Marwin Gonzalez leads the team in appearances, has been one of Houston’s few weak spots.
(Photo: Keith Allison)

The outfield corners are traditionally home to heavy hitters. Currently, the combined wRC+ of MLB’s right fielders (108) is just a point below those of first basemen and AL designated hitters, with left fielders (105) lagging by a few points. The last of those is a bit strange given the inherently lesser defensive responsibilities — less throwing, mainly — but many teams have taken to stashing their speedy, slappy non-center fielders there, a trend that seems to have begun back when the White Sox won it all in 2005 with Scott Podsednik.

Despite that generally robust production, several contenders — which for this series I’ve defined as teams with playoff odds of at least 15.0% (a definition that currently covers 15 teams) — are barely getting by at one corner or another, by which I mean receiving less than 1.0 WAR at the spot, which makes them eligible for inclusion among the Replacement Level Killers. If you’re a regular reader of my work, it won’t surprise you that one contender is somehow on both lists… as well as a forthcoming one.

Read the rest of this entry »


The 2018 Replacement-Level Killers: Shortstop and Third Base

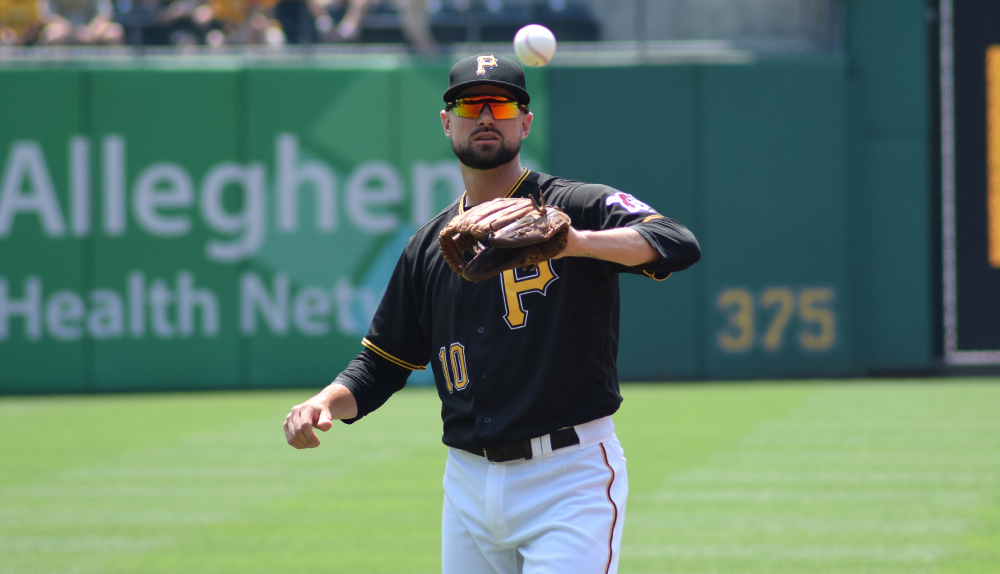
The Pirates’ hot streak has them in contention, but Jordy Mercer may not be cutting it at shortstop.
(Photo: Ian D’Andrea)

We live in amazing times when it comes to the collection of talent that is occupying the left side of the infield — or is supposed to be, if not for injuries (we miss you, Corey Seager, and please come back soon, Carlos Correa and Josh Donaldson). Remarkably, at a position where defense reigns supreme, shortstops as a group are hitting for a collective 99 wRC+ at this point, up from the range of 87 to 92 that it’s occupied since 2002. Third basemen are at a high as well as far as offense with a 108 mark. And in case you haven’t seen the highlight reels, there is no shortage of guys from these two positions who can Pick It.

As it happens, nearly every contender this year — which for this series I’ve defined as teams with playoff odds at least 15.0%, a definition that currently covers 16 teams — is outfitted well enough at the two positions, having balanced offensive and defensive concerns such that there’s a dearth of Replacement-Level Killer candidates. Only three teams from among the eight who have received less than 1.0 WAR from their shortstops are contenders, and likewise, just three others from among the 10 are in the same situation at third base. One team has needs in both areas, namely the Pirates, whose 11-game winning streak has pushed their odds above 15% and thus forced me to include them in this exercise, even though you, I, and Bob Nutting all know they’re still very long shots.

Read the rest of this entry »


The 2018 Replacement-Level Killers: Second Base

Dustin Pedroia’s absence from the Red Sox this year has created one of the club’s few weak spots.
(Photo: Keith Allison)

Second base is a position where defensive concerns generally outweigh offensive ones, as suggested by the modest 94 wRC+ recorded collectively by second basemen this year (although that figure was as high as 106 as recently as two years ago). This year has been a rough one for aging second-sackers, with Daniel Murphy and Dustin Pedroia barely playing due to knee injuries, Ian Kinsler struggling, Robinson Cano getting suspended, and several other previous stalwarts — Brian Dozier, Jason Kipnis, Joe Panik — seeming to fall apart before our eyes. Some of these, as you will see, have direct bearings on our rankings here, while others limit the pool of available replacements.

Among contenders (which for this series I’ve defined as teams with playoff odds of at least 15.0%, a definition that currently covers 16 teams), six teams have gotten less than 1.0 WAR at second base thus far, but as with catchers and first basemen, a closer look at each situation suggests not all will be in the market for external solutions — an area that colleague Dan Szymborski will examine later. Between early-season injuries and slow-starting veterans, some of these teams aren’t in as dire a shape as the overall numbers suggest, but that doesn’t necessarily mean they’re out of the woods.

Replacement-Level Killers: Second Basemen
# Team Bat BsR Field WAR
29 Red Sox -14.2 -7.4 -0.7 -0.7
23 Rockies -15.9 -1.6 4.8 0.3
22 Nationals -7.4 -2.6 0.0 0.4
21 Dodgers -7.8 1.7 -3.9 0.4
20 Indians -10.7 2.5 1.0 0.8
All statistics through July 23. Rk = rank among all 30 teams.

Read the rest of this entry »


The 2018 Replacement-Level Killers: First Base

The Rockies’ somewhat curious decision to sign Ian Desmond has not become less curious with time.
(Photo: Ian D’Andrea)

When it comes to replacement level, first base is a very different beast than catcher. In general, teams prioritize catcher defense and staff handling over offense, and even in this age of advanced analytics, there’s room to quibble over whether the available metrics — including the pitch-framing sort — capture enough of their value. As we lack a good staff-handling metric (catcher ERA isn’t it due to sample-size issues), there’s a whole gray area that, among other things, allows teams, particularly contending ones, to convince themselves they’re getting enough value behind the plate.

First base is another story. Offense is comparatively easy to measure, and the expectations for the position are high. A contending team that lacks a heavy hitter at the spot, or at least an adequate one, is bringing a spork to a knife fight. At this end of the defensive spectrum, it shouldn’t be that hard to find alternatives, even if they possess relatively clunky gloves; in this day of shortened benches, you can generally find a utilityman to fill in defensively at first in the late innings. With upgrades available as the July 31 deadline approaches, there’s no excuse for letting a Replacement-Level Killer drag your contending team down.

Among contenders (which, for this series, I’ve defined as teams with playoff odds at least 15.0%, a definition that currently covers 15 teams), five have gotten less than 1.0 WAR at the position thus far. That said, a closer look at each situation suggests not all will be in the market for external solutions (an area that colleague Dan Szymborski will examine). Between early-season injuries and slow-starting veterans, some of these teams aren’t in as dire a shape as their overall numbers suggest, but that doesn’t necessarily mean they’re out of the woods.

Replacement-Level Killers: First Basemen
Rk Team Bat BsR Field WAR
26 Rockies -7.6 0.3 -2.5 -0.5
23 Mariners 0.5 -4.5 -2.4 -0.1
22 Yankees -6.4 -0.4 0.5 -0.1
18 Astros 3.7 -2.4 -0.8 0.7
16 Phillies 1.3 1.1 -0.3 0.8
All statistics through July 22. Rk = rank among all 30 teams.

Working from the order of the table above, from the worst to the most borderline…

Rockies

As I noted in the catchers’ installment, eight out of 12 Rockies with at least 100 PA have a wRC+ below 90. While it’s understandable how the team could convince itself that the defensively sound Chris Iannetta and Tony Wolters might be adequate enough, there’s no fig leaf of an excuse to cover the team’s ongoing inability to find competence at first base, where Ian Desmond, Ryan McMahon, and Pat Valaika have combined for an 85 wRC+. Desmond himself hasn’t been quite that bad with the bat (.238/.309/.468, 92 wRC+), but his defensive numbers at the position are lousy (-1.7 UZR, -4 DRS), and at this point it feels like the Rockies are playing him mainly because they still owe him about $50 million, preferring a sinking ship to a sunk cost.

Read the rest of this entry »


The 2018 Replacement-Level Killers: Catcher

In a race for a playoff spot, every edge matters, yet all too often, for reasons that extend beyond a player’s statistics, managers and general managers fail to make the moves that could improve their teams, allowing subpar production to fester at the risk of killing a club’s postseason hopes. In Baseball Prospectus’s 2007 book It Ain’t Over ‘Til It’s Over, I compiled a historical all-star squad of ignominy, identifying players at each position whose performances had dragged their teams down in tight races: the Replacement-Level Killers. It’s a concept I’ve revisited on several occasions over the past decade, both at BP and beyond, albeit not for a while. With the trade deadline looming, this seems an ideal moment to dust it off and identify some of the bigger holes at each position among contenders.

When it comes to defining replacement-level play, we needn’t be slaves to exactitude. Any team that’s gotten less than 1.0 WAR from a position to this point might be considered fair game, even if in some cases that means an above-average starter and ghastly backups. Sometimes, acceptable or even above-average defense (which, of course may depend upon which metric one views) coupled with total ineptitude on offense is enough to flag a team. In theory, a team may be well ahead of replacement level at a given position but has lost a key contributor due to injury. As with Supreme Court Justice Potter Stewart’s definition of hardcore pornography, I know replacement level when I see it.

For this series, I’ll start with the catchers and go around the diamond, pointing out the most egregious examples of potential Killers at each position among contenders, which I’ll define as teams with playoff odds of at least 15.0%, a definition that currently covers 15 teams (sorry, Angels, Giants, and Pirates, and fuhgeddabout it, Mets and Blue Jays). I’m less focused on these teams’ solutions; colleague Dan Szymborski will examine the potential trade candidates at each position.

Replacement-Level Killers: Catchers
Rk Team Bat BsR Field Framing* WAR
30 Nationals -25.4 -2.0 1.0 -0.8 -0.8
29 Red Sox -18.4 -3.3 -1.0 10.8 -0.2
27 Rockies -20.1 -0.8 0.0 6.1 -0.1
25 D-backs -16.6 -1.1 -1.0 17.4 0.1
22 Brewers -13.6 -3.4 0.0 2.2 0.3
21 Indians -13.6 -0.6 -2.0 6.2 0.4
20 Athletics -15.2 -3.3 3.0 -4.0 0.5
19 Mariners -11.6 -2.8 1.1 3.7 0.7
All statistics through July 21. Rk = rank among all 30 teams. Framing Runs data is from Baseball Prospectus and is not included in WAR.

Read the rest of this entry »