Cooperstown Notebook: The Incredible Shrinking Crop of Enshrined Starters

During the 2022 Hall of Fame election cycle, I introduced S-JAWS, an experimental version of my starting pitcher metric, in the service of evaluating candidates on the Golden Days and BBWAA ballots. I promised to return to the topic for a broader look at pitchers from other periods, but before doing so took a little detour related to the representation rates and demographics of the players elected to the Hall. This larger exploration helps to illustrate the importance of looking at the situation in a new light.
Like JAWS, S-JAWS is a Hall of Fame fitness metric based upon Baseball Reference’s version of WAR, though those shouldn’t be the only factors under consideration in a Hall of Fame case, whether we’re discussing pitchers or position players. They’re nonetheless critical to my analysis, a useful first-cut mechanism to tell me, “Is this a candidate worthy of consideration for a spot on a ballot?” but as I’ve stressed through my annual series and elsewhere, other factors such as awards, postseason play, and historical importance are germane as well. Whether we’re using JAWS or S-JAWS — both of which you can see on the Starting Pitchers page at Baseball Reference — that doesn’t change. In fact, that page now defaults to sorting by S-JAWS, though you can see rankings by JAWS or any other category you choose, whether it’s WAR or innings pitched or ERA+ or some other stat.
Like JAWS, S-JAWS uses an average of a pitcher’s career and peak WAR (best seven seasons at large) for comparisons to the averages of all Hall of Fame pitchers. The idea behind S-JAWS is to reduce the skewing caused by the impact of 19th century and dead-ball era pitchers, some of whom topped 400, 500, or even 600 innings in a season on multiple occasions. The way I’ve chosen to do this is by prorating the peak-component credit for any heavy-workload season to a maximum of 250 innings. I chose 250 because it’s a level that the current and recent BBWAA candidates rarely reached, and only one active pitcher (Justin Verlander) has, albeit by a single inning a decade ago. Over the past 22 162-game seasons — in other words, every one since 1999, save for the pandemic-shortened 2020 campaign — only eight out of 44 league leaders topped 250 innings, with Hall of Famers Roy Halladay, Randy Johnson, and Mike Mussina accounting for five of those eight seasons. Only two of the past 32 league leaders topped 250 inning, Halladay in 2010 and Verlander the following year, and between them they were a grand total of five outs over the threshold. The various emphases on pitch counts, innings limits, and times through the order make it unlikely we’ll see such levels again, at least on a consistent basis, and while we can debate, lament, and discuss whether it’s worth trying to reverse that trend, that’s not my focus here. Given the current trends in the game regarding starting pitcher usage, five or 10 years from now, looking at candidates on a 200- or 225-inning basis might make more sense, but I think this is a reasonable place to start the adjustments (I’ll have a look at a 200-inning basis at some point).
As to how this plays out, Cy Young’s 453-inning 1892 season, which produced 11.2 pitching WAR and -0.9 hitting WAR, thus counts for about 5.7 WAR towards his peak score; he still gets credit for the full 10.3 WAR for his career total. Old Hoss Radbourn’s record-setting 678.2-inning 1884 season, the one in which he notched 59 or 60 wins (depending upon the source), scales from 19.2 pitching WAR and 0.3 hitting WAR to a total of 7.2 WAR towards his peak score, but again, his original 19.5 WAR is still part of his career total.
As noted in my roundup of the candidacies of Mark Buehrle, Tim Hudson, and Andy Pettitte, 12 of the 26 pitchers with the largest gaps between their JAWS and S-JAWS had careers that finished before 1893, the year that the pitching distance was extended from 50 feet to 60-foot-6, and four more barely made it into the new era, with careers that were done by the end of 1894. Only six of the 26 (including Young) even pitched into the 20th century, and only Walter Johnson and Pete Alexander pitched into the live ball era. Here’s that table again, with apologies if it feels like old news:
| Pitcher | Years | Career WAR | Peak WAR | Peak WAR Adj. | JAWS | S-JAWS | Dif |
|---|---|---|---|---|---|---|---|
| John Clarkson+ | 1882-1894 | 83.2 | 74.7 | 36.9 | 78.9 | 60.1 | -18.8 |
| Jim McCormick | 1878-1887 | 76.2 | 68.7 | 34.2 | 72.5 | 55.2 | -17.3 |
| Pud Galvin+ | 1875-1892 | 73.4 | 61.9 | 28.5 | 67.6 | 51 | -16.6 |
| Old Hoss Radbourn+ | 1880-1891 | 75.4 | 67.3 | 34.7 | 71.4 | 55 | -16.4 |
| Tim Keefe+ | 1880-1893 | 86.9 | 66.4 | 35.2 | 76.7 | 61.1 | -15.6 |
| Al Spalding+ | 1871-1878 | 60.3 | 60.4 | 31.3 | 60.4 | 45.8 | -14.6 |
| Tommy Bond | 1874-1884 | 60.9 | 62.7 | 33.6 | 61.8 | 47.2 | -14.6 |
| Amos Rusie+ | 1889-1901 | 65.8 | 63.3 | 35.3 | 64.6 | 50.5 | -14.1 |
| Kid Nichols+ | 1890-1906 | 116.3 | 74.5 | 47.4 | 95.4 | 81.8 | -13.6 |
| Cy Young+ | 1890-1911 | 163.6 | 78.0 | 50.8 | 120.8 | 107.2 | -13.6 |
| Charlie Buffinton | 1882-1892 | 60.7 | 60.2 | 35.8 | 60.4 | 48.3 | -12.1 |
| Walter Johnson+ | 1907-1927 | 164.8 | 89.3 | 65.0 | 127.0 | 114.9 | -12.1 |
| Jim Whitney | 1881-1890 | 56.0 | 54.7 | 31.4 | 55.4 | 43.7 | -11.7 |
| Mickey Welch+ | 1880-1892 | 62.3 | 54.1 | 31.2 | 58.2 | 46.8 | -11.4 |
| Bobby Mathews | 1871-1887 | 55.1 | 50.3 | 27.4 | 52.7 | 41.3 | -11.4 |
| Silver King | 1886-1897 | 50.4 | 50.0 | 27.1 | 50.2 | 38.8 | -11.4 |
| Pete Alexander+ | 1911-1930 | 119.0 | 69.6 | 49.9 | 94.3 | 84.5 | -9.8 |
| Ed Walsh+ | 1904-1917 | 65.9 | 62.3 | 42.7 | 64.1 | 54.3 | -9.8 |
| Bob Caruthers | 1884-1893 | 59.5 | 55.7 | 36.5 | 57.6 | 48 | -9.6 |
| Ed Morris | 1884-1890 | 38.4 | 38.4 | 19.2 | 38.4 | 28.8 | -9.6 |
| Guy Hecker | 1882-1890 | 37.3 | 39.5 | 20.5 | 38.4 | 28.9 | -9.5 |
| Joe McGinnity+ | 1899-1908 | 59.0 | 54.1 | 35.6 | 56.6 | 47.3 | -9.3 |
| Tony Mullane | 1881-1894 | 66.6 | 49.7 | 31.7 | 58.2 | 49.2 | -9.0 |
| Bill Hutchison | 1884-1897 | 38.9 | 39.3 | 21.5 | 39.1 | 30.2 | -8.9 |
| Christy Mathewson+ | 1900-1916 | 106.5 | 70.2 | 53.0 | 88.4 | 79.7 | -8.7 |
| Will White | 1877-1886 | 34.9 | 35.5 | 18.1 | 35.2 | 26.5 | -8.7 |
These guys are ancient history, and while that history is fascinating — I loved learning and writing about Clarkson, Galvin, Keefe, Radbourn, and Welch for The Cooperstown Casebook — arguably they should be less of a factor when we hold up our yardstick to measure current candidates. While I’ve debated ways to tamp down the enshrined pitchers’ impact within JAWS, removing the oldest of them (that aforementioned quintet) outright would only lower the JAWS standard by about a point, and I’ve always been hesitant to completely remove any players from our data set. S-JAWS does a better job of reducing their impact when judging late 20th and 21st century hurlers.
As a group, the Hall of Fame pitchers lose an average of 9.1 WAR in the adjustment of their peak WARs and an average of 4.6 points in the conversion from JAWS to S-JAWS. But as you’d expect, it’s the older pitchers who see the greater drops. Here’s the breakdown by birth decade:
| Birth Decade | HOF SP | Career WAR | Peak WAR | Peak WAR Adj. | JAWS | S-JAWS | Change | Peak Adj.% |
|---|---|---|---|---|---|---|---|---|
| <1870 | 7 | 94.4 | 68.1 | 37.8 | 81.3 | 66.1 | -15.1 | 56% |
| 1870-1879 | 7 | 62.6 | 50.3 | 37.3 | 56.5 | 49.9 | -6.5 | 74% |
| 1880-1889 | 9 | 78.6 | 54.0 | 42.5 | 66.3 | 60.5 | -6.9 | 79% |
| 1890-1899 | 6 | 49.9 | 36.4 | 33.4 | 43.2 | 41.7 | -1.5 | 92% |
| 1900-1909 | 5 | 70.6 | 46.0 | 42.1 | 58.3 | 56.3 | -2.0 | 92% |
| 1910-1919 | 2 | 54.9 | 47.9 | 39.3 | 51.3 | 47.0 | -4.3 | 82% |
| 1920-1929 | 6 | 69.2 | 45.2 | 39.8 | 57.2 | 54.5 | -2.7 | 88% |
| 1930-1939 | 8 | 70.5 | 49.7 | 42.4 | 60.1 | 56.4 | -3.7 | 85% |
| 1940-1949 | 7 | 77.4 | 46.3 | 40.4 | 61.9 | 58.9 | -3.0 | 87% |
| 1950-1959 | 2 | 69.0 | 41.4 | 38.0 | 55.2 | 53.5 | -1.7 | 92% |
| 1960-1969 | 5 | 88.0 | 49.0 | 48.6 | 68.5 | 68.3 | -0.2 | 99% |
| 1970-1979 | 2 | 74.1 | 54.4 | 54.2 | 64.3 | 64.2 | -0.1 | 100% |
| Total | 66 | 73.0 | 49.8 | 40.7 | 61.4 | 56.8 | -4.6 | 82% |
The table includes only players from the National League, American League, and bygone white major leagues (National Association, American Association, Union Association, Player League, and Federal League), not the Negro Leagues classified as majors. The shorter seasons for the Negro Leagues pitchers make direct comparisons using JAWS ill-advised. Of the enshrined pitchers from Black baseball, José Mendéz and Smoky Joe Willams were born in the 1880s, Andy Cooper and two-way star Bullet Rogan in the ’90s, Ray Brown, Bill Foster, Satchel Paige, and Hilton Smith in the 1900s, and Leon Day in the ’10s — the last of those a decade that’s already lacking in Hall of Fame hurlers, a point to which I’ll return.
The oldest group represented by the table, which consists of Old Hoss and the other war horses plus Young and Kid Nichols, is by far the hardest hit by the change to S-JAWS, but those pitchers as a group had the highest seasonal pitching WARs to begin with thanks to their monster innings totals, led by Galvin’s 20.5 in 1884 (though that drops to 18.5 with offense thrown in, leaving Keefe’s 20.2 — 0.3 from offense — as the champ). Even with the peak adjustment, they collectively have a higher S-JAWS than every group but the 1960s one.
The average reductions for the 1870s and ’80s groups are less than half those of the pre-1870 group. Those two younger groups are unequal in quality, a pattern we see repeated in various adjacent decades; given the small samples and arbitrary cutoffs (a decade that starts with a year ending in zero is no more important than one ending with a three or a seven), a couple particularly strong or weak members can skew things one way or the other. The 1870s group has just one pitcher with a career WAR above 65.8, namely Eddie Plank (90.9), but the ’80s group has Alexander, Johnson, and Mathewson all with at least 106.5 WAR, and Ed Walsh at 65.9 as well.
The reductions for the pitchers born in the 1890s or later are comparatively smaller, and those for the pitchers born in 1960 or later are almost negligible. This is the effect I was aiming for when I came up with S-JAWS, something that wouldn’t unduly penalize starting pitchers for the industry-wide limitations in workload, which, if we’re looking backwards across longer periods, also include the moves to standardized four- and five-man rotations.
We can aggregate these groups a number of ways. Here’s my attempt to divide the pitchers up into three groups of roughly equal size, sticking with the conventional decade cutoffs:
| Birth Decade | Qual | HOF SP | Pct | WAR | Peak | Peak Adj. | JAWS | S-JAWS | Change | Peak Adj.% |
|---|---|---|---|---|---|---|---|---|---|---|
| <1890 | 115 | 23 | 20.0% | 78.6 | 57.2 | 39.5 | 67.9 | 59.0 | -8.9 | 69% |
| 1890-1929 | 106 | 19 | 17.9% | 62.0 | 42.9 | 38.3 | 52.5 | 50.1 | -2.3 | 89% |
| 1930-1979 | 204 | 24 | 11.8% | 76.3 | 48.3 | 43.7 | 62.3 | 60.0 | -2.3 | 91% |
| Total | 425 | 66 | 15.5% | 73.0 | 49.8 | 40.7 | 61.4 | 56.8 | -4.6 | 82% |
I’ve also included some data on representation rates, namely the number of Hall of Famers as a percentage of pitchers in each decade who reached 2,000 innings pitched, a tally that includes every enshrined pitcher from the NL, AL, and bygone white leagues except Dizzy Dean (who fell 32.2 innings short), plus relievers Hoyt Wilhelm and Dennis Eckersley, who aren’t included in the counts of enshrined starters. For as much as I would prefer a count that also included the Negro Leagues and their predecessors, the leaders for the major league years (1920-48) top out with only five pitchers above 1,000: Cooper at 1,603.1; Rogan, Foster, and Brown around 1,500; and Paige with a combined total of 1,695, including his post-integration years in the AL. The others made their bones earlier with the exception of Day, who lost time to World War II and injuries.
What stands out via this grouping are two points. First, the peak reductions for the two groups born from 1890 onward are virtually identical, and second, those reductions put the post-1930 group on a level with the pre-1890 group in terms of S-JAWS. Both are about nine or 10 points ahead of the pitchers born from 1890-1929, which ranges from pitchers who may have debuted in the dead-ball era (pre-1920) to those who debuted in the 1950s, a decade that did not feature as much sustained greatness in pitching, at least as reflected by WAR, as the one that followed. It’s worth remembering that the 1890-1929 group did lose some productive years to World War II and, in the case of Whitey Ford (born 1928), even the Korean War; don’t judge them too harshly.
Note the drop in Hall of Fame representation rate from the first two groups to the third. By including the 1930s group in the latter set, that actually camouflages the even steeper drop-off that was apparent in the breakdown from my previous installment. Going by the split I used in that article, 20.6% of pitching qualifiers born during the 1900-39 period are enshrined, but just 9.2% of those born in the 1940-79 period, a 2.23 ratio that’s still better than the 3.11 ratio among qualified position players (5,000 plate appearances or more) within those two groups.
The representation drop is particularly steep for the 1950s and ’70s birth groups. Here’s a look in graphic form:
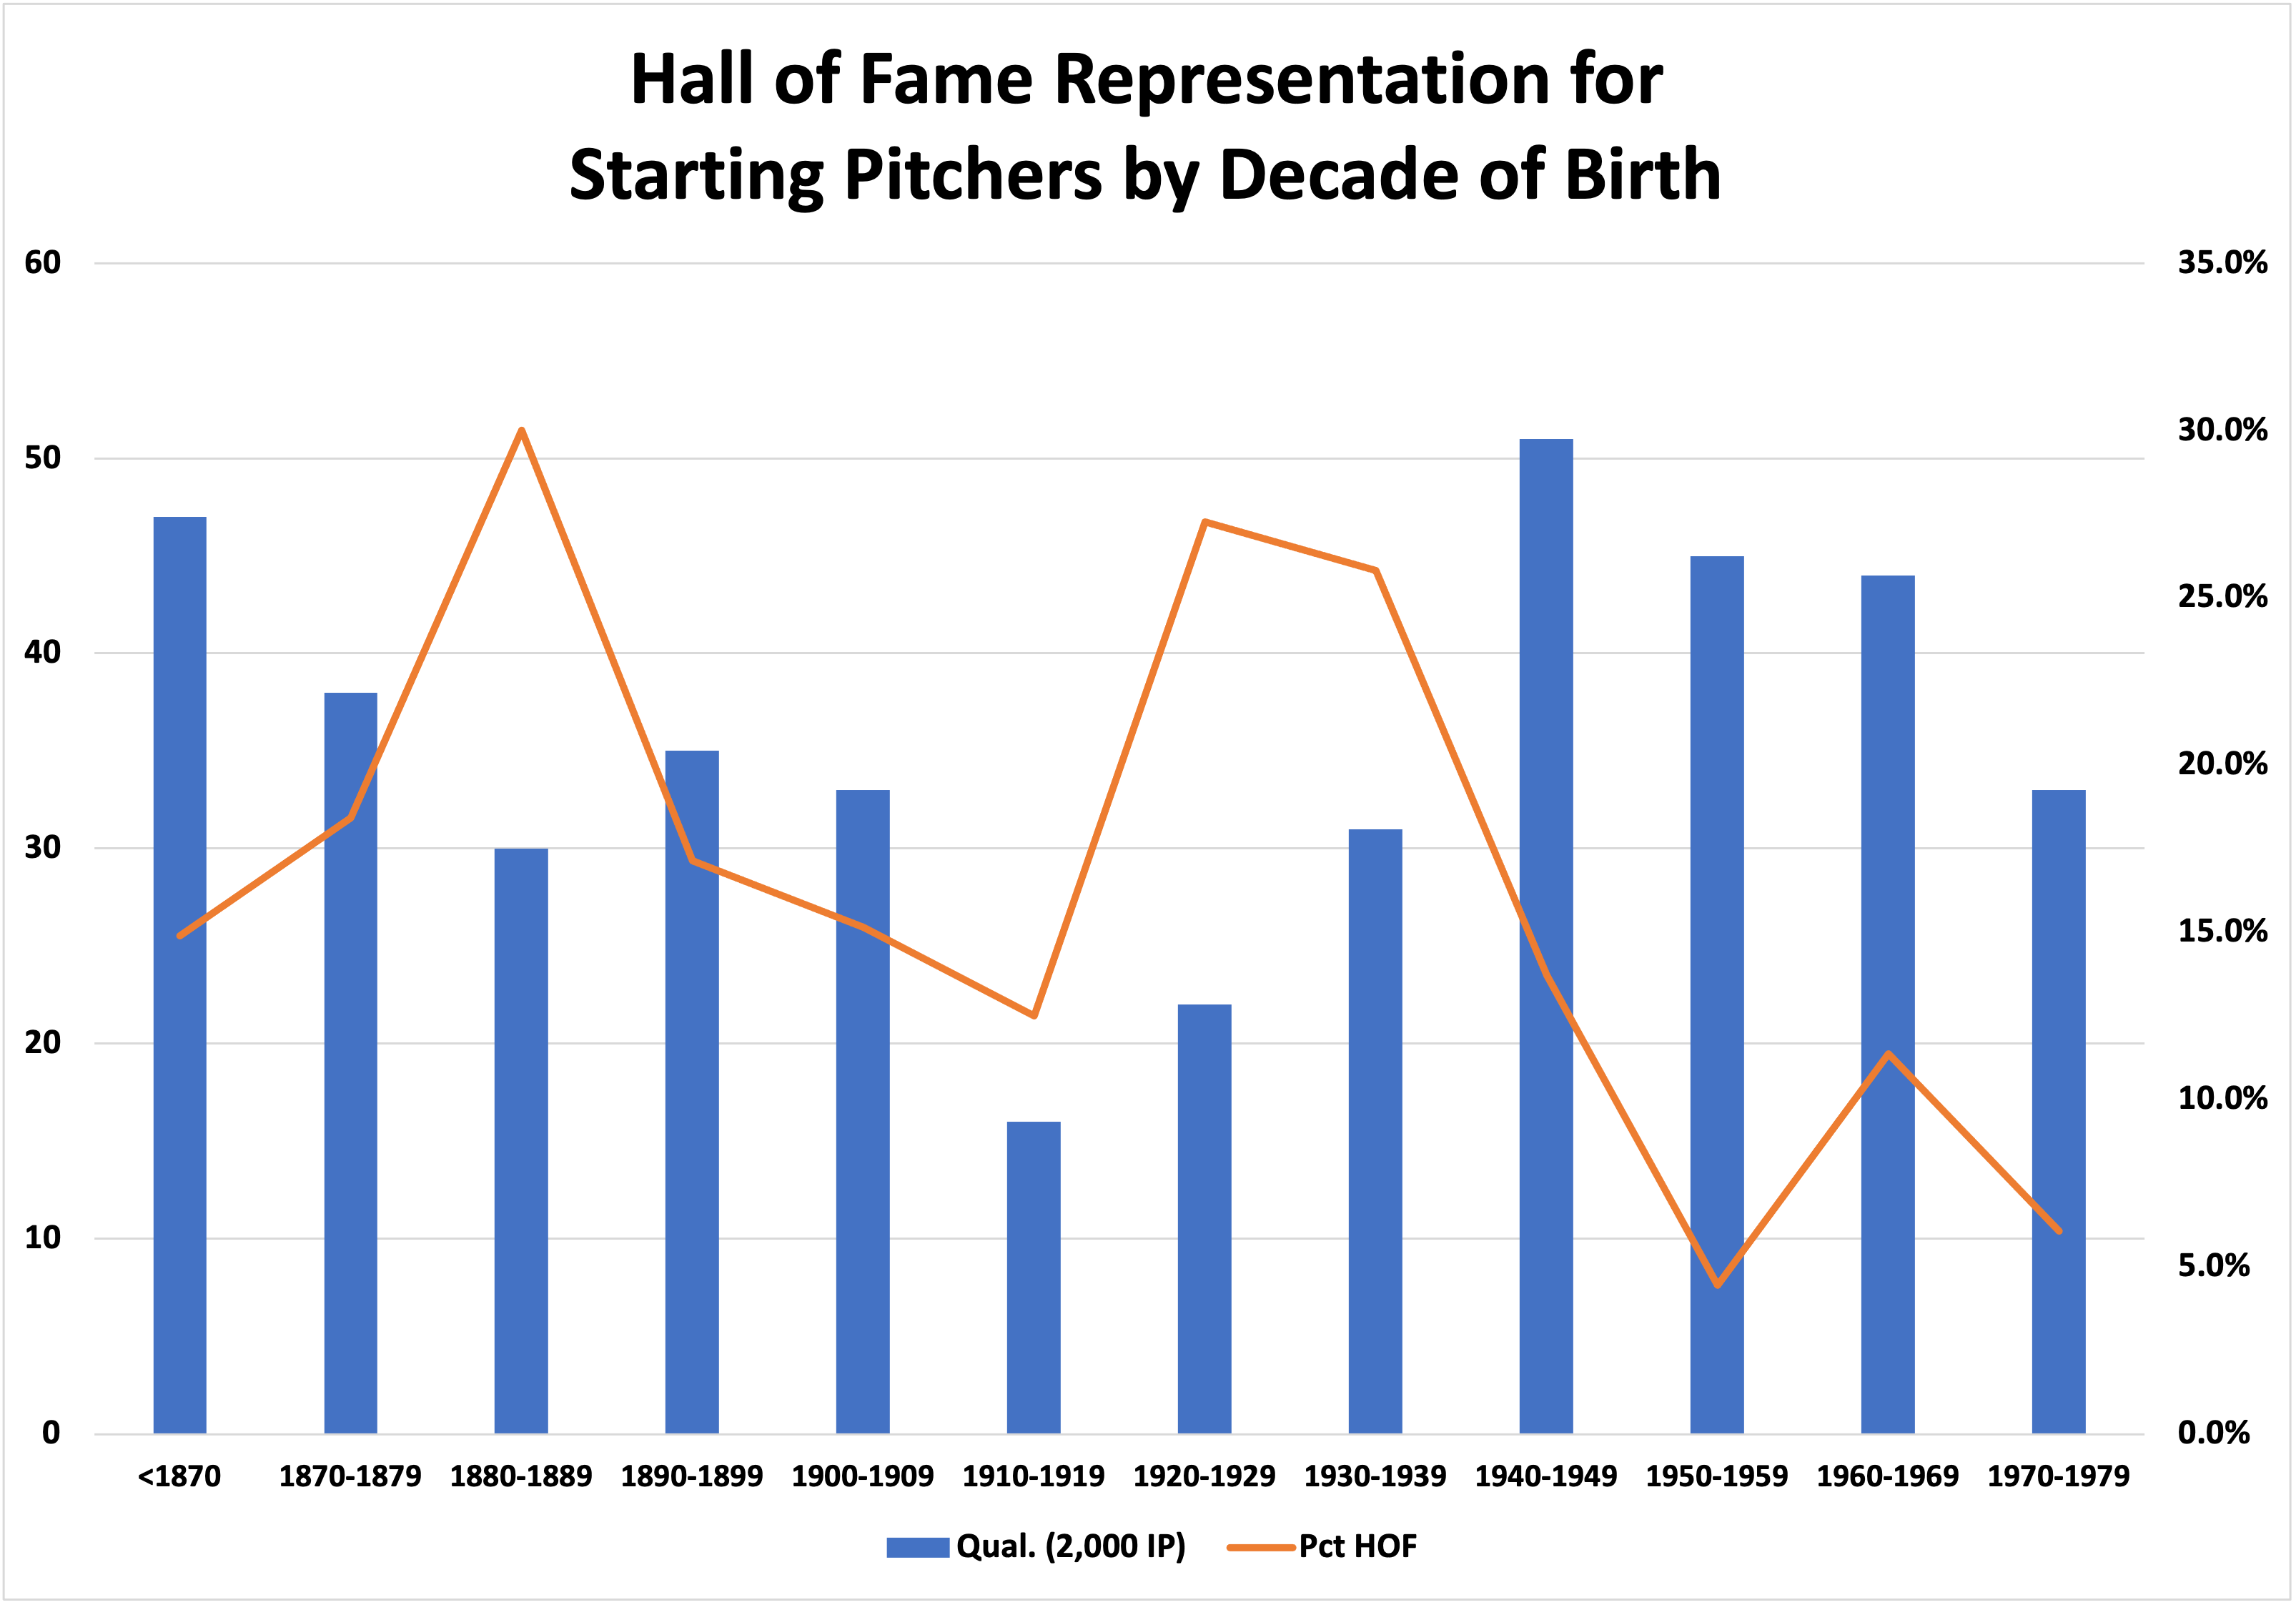
Here you can get a better handle on the extent to which World War II cut into the number of qualifying pitchers born in the 1910s and ’20s while also seeing the fall in representation rates for those born in later decades. From among the starters born in the 1950s, only Bert Blyleven and Jack Morris — forever linked in this scribe’s mind — are enshrined, though four relievers (Eckersley, Rich Gossage, Lee Smith, and Bruce Sutter) are as well, a weird anomaly. More pitchers born in the 1960s (Mussina, Randy Johnson, Tom Glavine, Greg Maddux,and John Smoltz) are in the Hall than starters from either adjacent decade; from the 1970s, only Halladay and Pedro Martinez have been elected thus far, and the landscape beyond them doesn’t look particularly promising.
Here’s a breakdown into four age groups that I think does a better job of illustrating the fall-off:
| Birth Decade | Qual | HOF SP | Pct | WAR | Peak | Peak Adj. | JAWS | S-JAWS | Change | Peak Adj.% |
|---|---|---|---|---|---|---|---|---|---|---|
| <1900 | 151 | 29 | 19.2% | 73.5 | 53.6 | 38.4 | 63.6 | 56.0 | -7.6 | 72% |
| 1900-1929 | 71 | 13 | 18.3% | 67.5 | 45.9 | 40.6 | 56.7 | 54.0 | -2.7 | 88% |
| 1930-1949 | 82 | 15 | 18.3% | 73.7 | 48.1 | 41.4 | 60.9 | 57.6 | -3.4 | 86% |
| 1950-1979 | 122 | 9 | 7.4% | 80.7 | 48.5 | 47.5 | 64.6 | 64.1 | -0.5 | 98% |
| Total | 425 | 66 | 15.5% | 73.0 | 49.8 | 40.7 | 61.4 | 56.8 | -4.6 | 82% |
What I like about this grouping is that both the percentages of Hall of Famers across the first three groups and the resulting S-JAWS averages are in fairly narrow ranges; the newer metric cuts the gap from the lowest average to the highest roughly in half, from 6.9 points to 3.6. What stands out here beyond that isn’t just the low share of qualifiers who are enshrined — the ratio of the 1930-49 group to the later one is 2.48 — but how much higher the S-JAWS average is for that last group. On one level this makes sense, as the cream of the crop was elected by the BBWAA (Roger Clemens and Curt Schilling aside, for reasons) and the average hasn’t been pulled down by committee elections, Morris and his 37.4 S-JAWS aside. Additionally, these pitchers were generally excelling in a higher-offense era and striking out an increasing proportion of hitters, which means less value shared with the fielders behind them. Even if Clemens and Schilling had been elected, the resultant rate (9.0%) would still be less than half that of the 1930-1949 group.
It seems clear that we need more pitchers in the Hall of Fame from the recent past, and it’s fair to wonder if the BBWAA voters have dropped the ball by letting Hudson (born 1975, 48.1 S-JAWS) fall off the ballot with just 3.0% in the most recent election, with Buehrle (born 1979, 47.4 S-JAWS) barely hanging on at 5.8% and Pettitte (born 1972, 47.2 S-JAWS) 10.7% only slightly better supported. I didn’t have any of the three on my ballot, and wasn’t strongly compelled to include them when I took my first look at the trio through the lens of S-JAWS. In my next installment, I’ll place them within the larger context of the pitchers from the post-1949 group.
Brooklyn-based Jay Jaffe is a senior writer for FanGraphs, the author of The Cooperstown Casebook (Thomas Dunne Books, 2017) and the creator of the JAWS (Jaffe WAR Score) metric for Hall of Fame analysis. He founded the Futility Infielder website (2001), was a columnist for Baseball Prospectus (2005-2012) and a contributing writer for Sports Illustrated (2012-2018). He has been a recurring guest on MLB Network and a member of the BBWAA since 2011, and a Hall of Fame voter since 2021. Follow him on BlueSky @jayjaffe.bsky.social.
I personally would include Pettitte, Tommy John, Luis Tiant, Rick Reuschel, David Cone, and Kevin Brown. Roger Clemens and Curt Schilling too, although I understand and respect why some would vote no for them.
For me Hudson, Buehrle, Dwight Gooden, Bret Saberhagen, Orel Hershiser, Cole Hamels, Roy Oswalt, Felix Hernandez, and Johan Santana, and Dave Stieb are all a tier below, although none of them would be terrible selections.
Agree. Easy yes on Hamels. Santana, Saberhagen and Stieb before a single reliever. I’d add CC Sabathia and Kevin Appier to the yes column. John seems like Kaat without the lifetime in the game but he’s not objectionable.
I do believe starting pitchers have been undervalued by BBWAA voters in the age of expansion. Frankly, I’ve struggled with it myself, but my vote doesn’t matter. Is the Hall about the best players, or is it about a subset, meaning the best players by position or role? So the top closers get in even though the majority are less valuable than starters? If GMs knew the careers that David Cone, Tommy John, Luis Tiant and Lee Smith would have in advance, would any of them draft Lee Smith ahead of them? I’d take all the starters before Smith, yet Smith is the only one in the HOF.
Steib I’d say belongs in the top list if going by peak. He averaged 7.3 rWAR over a four-year period. He certainly was a more dominant pitcher than Pettitte, to pick one example, but Pettitte had a longer career, and a fine postseason resume, which should be included. Maybe there’s room for both, one on peak, one on longevity. The two most popular versions of WAR don’t help clarify. Stieb’s at 56.5 career rWAR to Pettitte’s 60.2, but fWAR has Stieb at 43.8 to Pettitte’s 68.2. We can do this same exercise for Hudson and Buehrle, too. I’d put Cone and Tiant in ahead of all of them, not including Clemens and Schilling.
The Hall voters do a good job on the truly elite-level pitchers, but it’s the notch down that’s unclear. What would JAW’s say if a list was created of the greatest starting pitchers from 1961 forward? It eliminates the crazy WAR totals of the early years and also incorporates the age of expansion and by that point the full integration of the game. (I’m not arguing against early pitchers at all, but trying to recognize the game has changed significantly as it relates to starters.)
I agree with most of your starter selections, however Schilling is an avowed white supremacist and avid collector of Nazi memorabilia, who also defrauded the state of Rhode Island of tens of millions of dollars. You can’t put somebody like that in the hall regardless of how well they pitched, it sends a bad message.
Avowed? Did I miss that?
well you might be dense, Trump’s whole brand is white supremacy and bigotry. His grandfather was not just in the KKK, but was a very openly racist landlord.