
David Price Gets Married to Strike Zone
Here’s one thing that probably won’t surprise you: at present, the Red Sox are the major-league leaders in wOBA and OPS. Here’s another thing that probably won’t surprise you: at present, the Red Sox are the major-league leaders in average pitches seen per plate appearance. That’s a team that grinds out at-bats, and that’s a team that squeezes juice out of them. Here’s one thing that might surprise you, then: David Price just beat the Red Sox, with a complete game, in which he threw just 97 pitches. Against the Red Sox, Price was able to be effective; against the Red Sox, Price was able to be efficient.
Price has now made five starts since coming off the disabled list, having recovered from an arm injury. In three of those starts, he’s gone the distance, and in zero of those starts has he reached 100 pitches. In one of them, he didn’t even reach 90. I’ll grant that Price has started twice this month against the Astros, and the Astros are terrible, but he’s been doing something unusual, and something he’s never personally done before, at least not to this extent.
Over the last 30 days, FanGraphs’ leaderboards list 101 qualified pitchers. This covers all of Price’s most recent starts since coming off the DL, and Price ranks third in innings pitched, with 41. Sort by strike rate and you find Price in second place, at 73.3%. He’s sandwiched between Cliff Lee and Jordan Zimmermann. Sort by zone rate and you find Price in second place again, at 62.7%. This time he’s sandwiched between Lee and Bronson Arroyo, but he’s just 0.2% behind Lee and 4.8% ahead of Arroyo. To put it another, simpler way: over the past month or so, Cliff Lee and David Price have thrown significantly more pitches in the strike zone than anyone else, on a rate basis. They’re not just the top two — they’re the top two, by a wide margin. We’ve come to expect this from Lee, and Price doesn’t exactly have a wild reputation, but for Price this is a step toward greater efficiency.
Following, a graph, tracking Price from 2009 through Wednesday night. You’re going to see five-start rolling averages for strike rate and zone rate, and it should be pretty self-explanatory:
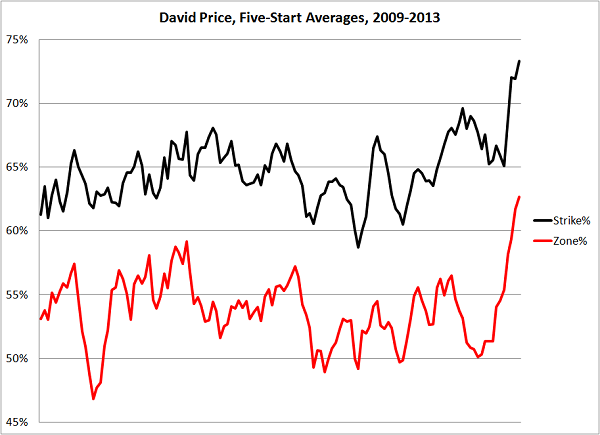
To review, Price over the last five starts, all since coming off the DL:
- 73.3% strikes
- 62.7% in the PITCHf/x strike zone
For strikes, Price’s previous high was 69.6%, over a five-start stretch between last August 27 – September 25. For pitches in the zone, Price’s previous high was 59.2%, over a five-start stretch between July 7 – August 4, 2010. Price has never pounded the zone quite this much, he’s never thrown strikes quite this often, and as a result, over the last five starts, Price has issued all of one walk. It was a full-count walk, in Toronto, and it looked like this:
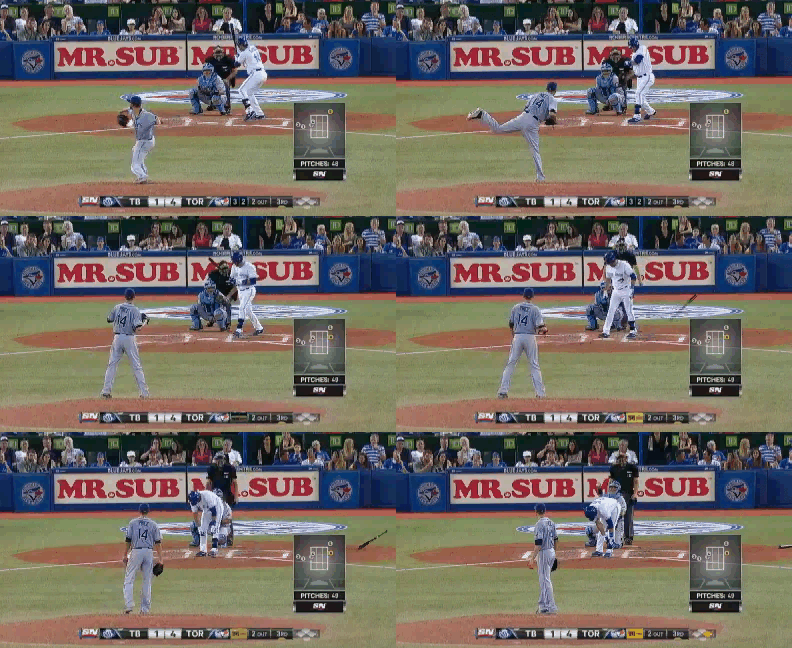
Price missed his spot with a fastball inside, that much is clear, and the pitch probably deserved to be called a ball. But pitches much worse than this do get called strikes, so Price’s one walk since coming off the DL was very nearly a called strikeout. I’m not going to review all of Price’s borderline strikes that could’ve been called balls, because there wouldn’t be any sense in that, because that would miss the point. Let’s not get too worked up over the details.
Except maybe this detail. It’s not just that Price has issued one walk over five starts and 147 batters. It’s also that, over that span, he’s gotten into just five three-ball counts. He hasn’t gotten into a single 3-and-0 count. Over the last 30 days, there have been 30 instances of a pitcher walking at least five batters in a game, and those 30 days include the All-Star break. Since coming off the DL, Price has one walk, five three-ball counts, and three complete games. He has as many walks as Tim Lincecum has no-hitters.
A few questions. First, might this be something coincidental, or something deliberate? We can’t answer that conclusively yet, but it could be meaningful that this stretch immediately follows a DL stint, which also happened to be Price’s first major-league DL stint. Price might have a renewed interest in pitching more efficiently, working to avoid taxing deep counts. Of course, lowering walks by throwing more strikes leads to more hits and a similar number of base-runners, so it’s an open question as to how much more efficient Price might be, but it’s less about the reality of things and more about Price’s perception of the reality of things.
Second, so does this represent an improvement, or might this just be a change, a different path to similar results? Again, we have to wait for a point at which Price hasn’t started 40% of his games against the Astros, but his walks are down and his strikeouts are down. A quick glance: between 2010-2012, Price posted an 83 xFIP-. Since coming off the DL, Price has posted an 85 xFIP-. He’s been different and he’s been very good, and he was very good before. This isn’t necessarily a new level of effectiveness. This could be about the same level, in different lighting.
So we’ll see if David Price keeps pitching like some approximation of Cliff Lee. Of that, we can’t yet be certain. One thing of which we can be certain is that Price is back and feeling strong, and he’s been a big part of the Rays’ resurgence in the standings. He’s a reason why the Rays now have the AL’s second-best record, and he’s a reason why the Rays can think about winning their division. Over the years, there have been a few versions of David Price. Pretty much all of them have been wonderful.
Jeff made Lookout Landing a thing, but he does not still write there about the Mariners. He does write here, sometimes about the Mariners, but usually not.
What a bitch.
Well why don’t you marry an ice cream sandwich?!?
You can do that?!?!?!?! And here I was feeling ashamed about what I do….
David deserves the headlines for marrying the strike zone. Just don’t forget who framed all the wedding photos.
You’re a fangraphs favorite, Jose. We could never forget you buddy.
YES!
Oh my, this is heavenly
Maybe this is a new strategy of the Rays. Moore is also pounding the strike zone. So many pitchers are nibblers, even guys with great stuff, this is what batters expect, and when the strike zone gets pounded, especially by a starter, they often seem surprised.
Except for Hellickson, who continues to confuse everyone. Starts off the season terrible and everyone’s saying “the luck finally caught up to him”, then he starts to dominate, still nibbling like he always does. In fact, you could argue that Hellickson has been unlucky this season rather than actually regressing towards the norm. What a weird pitcher.
Rays to the World Series
I’m a Red Sox Fan and no sarcasm, with that improved offense, and a 1-2 of Price and Moore scares me in a beast of 5 or 7. Good luck to you guys the rest of the way. I really wanna see a SOX-RAYS ALCS.
Seriously though, it’s gonna be a say day when he leaves the Rays. Same story with Shields, Crawford, etc. I know it is for the better and I fully endorse moving him, but he’s a genuine star.
… Sad*
“the say day kid”
Wouldn’t a similar FIP- with this type of approach lead to far more value? If I’m not mistaken, FIP- is a rate stat. So, same rate of production over more innings per start = more WAR/better pitcher, correct?
He sure was on last night against the Sox, although Vanover’s strike zone was about 13 feet wide. I exaggerate.