De-Lucking Team Offenses
If you are similar to me, then you spend more than a trivial amount of time on the teams leaderboard page. I find myself sorting the wRC+ column for my daily Ottoneu, The Game, and game preview needs. But, like a suspicious man at a bus stop, BABIP lurks just a few columns away. It haunts my well-crafted insults hurtled brazenly towards the Miami Marlins from the comfortable solitude of my home office.
I have spent the past year or two studying BABIP, in part because it has shown the power to unlock a fielding independent hitting metric I so cleverly and regrettably titled ShH or Should Hit. But other than confusing friends during spoken conversation, Should Hit can also regress offensive production based on four simple factors: walks, strikeouts, home runs, and BABIP.
We have previously employed ShH and its stepchild, the De-Lucker X (DLX), to regress players according to their previous performances. But now, let us throw whole teams into the De-Lucker vat. It will be great opportunity to kick the already over-kicked Marlins — as well as offer uncommon accolades for the San Francisco Giants and San Diego Padres lineups.
One of the historical problems of the DLX has been that massive, hairy catchall, BABIP. Its only role in ShH is to cancel itself out, essentially. That’s why DLX uses xBABIP instead of BABIP. But xBABIPs, especially ones based on batted-ball data, are unreliable. My preference has long been to use career BABIPs instead of xBABIPs, but BABIP talent changes over a career (ask Ichiro Suzuki).
We need to make two major assumptions: (1) ballparks affect BABIP and (2) teams will maintain certain BABIP patterns over periods lasting multiple years.
The first assumption is easy, but still a forgettable concept. We know Coors Field increases homerun rates, but tend to forget it also has higher single and double rates too. Likewise, it easy to forget how Tropicana Field, with the second-largest foul territory in the league, suppresses singles and doubles.
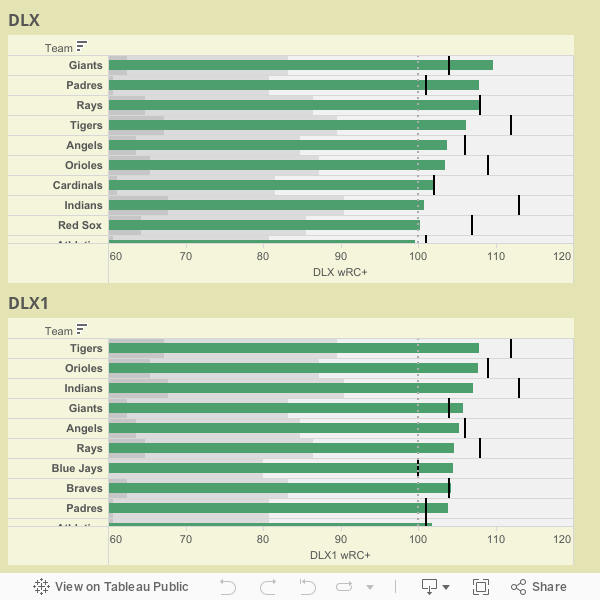
Consider the BABIPs of teams home and away over the preceding three seasons:

With this graphic here, I think we are seeing multiple effects on BABIP. With Home BABIP, we are seeing mostly park effects. With the blue Away BABIP, we are seeing organizational preferences, as well as a little bit of divisional park factors.
For instance, the Seattle Mariners have low BABIPs both at home and on the road. This may be a component of playing a large amount of away games in Anaheim and Oakland, but they also play in Arlington, where BABIP is encouraged. I think we can attribute at least a good portion of that low away BABIP on their decisions to funnel significant playing to Justin Smoak (career .262 BABIP), Brendan Ryan (.283 BABIP), and Dustin Ackley (.285 BABIP). The Mariners have shown a lower threshold of acceptable BABIP levels than, say, the Brewers or Marlins.
Maybe the Mariners’ particularly BABIP lull is due to a Mariners-strength streak of terrible luck. But the Cubs — who also assembled some rough offenses during that period — clearly had an organizational predisposition towards high BABIPs. And though the franchise is in new hands, many of those same types of players remain from the previous regime.
If we solder these two major assumptions together with the DLX, we can create two fun regressed numbers — defined for the purposes of the coming visualization:
- DLX: This is my De-Lucker X put to super overdrive. I am using the BB% and K% from 2013, but the HR% and BABIP are coming from 2010 through 2012. (Because home run rates can suffer from clustering effects not unlike BABIP fluctuations, I have included DLX as an alternative to the more basic DLX1.)
DLX1: This is the same as DLX, except using home run rates from 2013.
wRC+: Both DLX wRC+ and DLX1 wRC+ were made using some basic cross multiplication (as in: wRC+ / wOBA = x / DLX, solve for x). This is a quick and dirty method, but it saves me from having to attribute park factors and such. For my dark cross-multiplication purposes, I used the 2013 wRC+ and wOBA ratios.
Key: The black lines represent the team’s actual present wRC+. The green bars represent their DLX or DLX1, as noted.
Some takeaways:
- • The Marlins have hit beneath what we expect from their historical BABIPs, but they are also in a different stadium. Their team BABIP in 2012, their first year in the new stadium, was indeed lower than it was in ol’ Something Something Stadium, but their present .265 BABIP is far lower than what we should expect moving forward.
That said… Using both their historical home run rates (74 DLX) and their present home run rates (71 DLX1), the future looks grim for the Marlins, barring a major personnel or luck shift.
• According to historical home run rates, the Giants (110 DLX), the Padres (108 DLX), and the Rays (108 DLX) have the league’s best offenses. If we use present home run rates, the Tigers (108 DLX1), the Orioles (108 DLX1), and the Indians (107 DLX1) rank Tops Banane.
• The Indians receive the most abuse from DLX, dropping 12 points of offense. The Braves were second with 9 points lost. The Marlins gained the most, going up 9 points. The Royals gained 8.
• DLX1 added 7 points of offense to the White Sox. The next closest were the Marlins and Nationals with 6 points. The Indians (-6) and Red Sox (-6) were hurt the most.
• There’s almost no way the Nationals are as bad offensively as their 2013 offering, but their current BB% and K% suggests they need a new approach or new, more effective personnel if they hope to crack league average on offense.
• Concerning surprises, is anyone surprised the Rays (108 wRC+, 108 DLX, 105 DLX1) are among the best offenses in the league? I’m not. (WOODRUM OUT.)
What’s with the blue jays and rangers? couldnt find wrc+ numbers, somehow?
My guess is that they exactly match the end of the green line.
My guess was wrong. The Jays have 100 wRC+ so it is hidden by the league average line. I assume the same for the Rangers.
I’ve tweaked the gray line. Hopefully that should make it easier to see the 100 wRC+ teams.
Does moving in of the fences at Petco account for the difference in DLX vs DLX1? Funny that there’s an opposite effect for the Mariners at Safeco.
I’ve been wondering something similar about WAR and the Padres this year. Doesn’t Batting Runs use multi year park effects? If so, then wouldn’t it be giving us some pretty funky results for the Padres and/or Mariners?
Right now the Padres are 11th in wRC+ and Batting Runs but 22nd in wOBA. Likewise, they are 3rd from last in FIP, but they are last place in pitching WAR, with the 29th place Astros being miles ahead of them.
I just can’t help but wonder if park effects are maybe skewing the numbers of the individual players, giving too much credit to the hitters and not enough to the pitchers.
Isn’t crediting the Indians’ success thus far to good luck a bit unfair? The lineup is significantly improved from the past couple years. They have depth on the bench (Raburn is overperforming for sure, but they’re doing a great job of keeping guys in their roles). They actually have protection for their best hitters. On top of that, Kipnis and Cabrera are well above their career averages for strikeout rates. I see some luck, but I also see eight hitters in their starting lineup who are better than league average. At no point in the past few years did they have that kind of lineup.
I see no comment above where the author attributes the Indians’ success solely to luck. He is stating that they appear to be getting lucky.
The author posted about a metric he developed to study which teams may be getting lucky. Are you suggesting that he should have included some strange aside that says, “Yes, while my newly developed metric, about which this post is focused, shows the Indians getting lucky, I feel compelled to point out that they are improved from last year. “?
A team can be both improved year over year, and be getting lucky. That seems to be the case with the Indians.
I’m a little bit shocked to see such a big swing for the Braves, I kind of figured the lucky (Freeman and Francisco) would counter the unlucky (simmons and McCann) and the extremely unlucky (Chris Johnson) would counter the extremely unlucky (Heyward) guess my eyeballing was off.