
Do Hard Throwers Allow Fewer Home Runs per Fly Ball?
When the Cardinals played the Marlins on Wednesday night, two of the hardest throwers in baseball made appearances. Jordan Hicks was flawless, getting two strikeouts and four grounders in two perfect innings. Tayron Guerrero pitched a 1-2-3 inning, but with a tad more excitement than Hicks produced. He allowed a fly ball to medium-deep center field, and fly balls are always adventures given the current state of home runs. As I listened to the game, however, the announcers were quick to mention that Guerrero wasn’t in great peril with that fly ball, because it’s hard to hit home runs off of someone who throws so hard.
My statistical curiosity was piqued by that comment. It’s something I’ve heard from time to time, and it seems logical — I’ve watched a fair amount of Hicks appearances in the past two years, and batters seem tremendously uncomfortable when facing him. On the other hand, there are plenty of things I’ve heard about baseball that seem logical but aren’t true. I grew up knowing when the right time to bunt was and how some batters were just better at hitting in the clutch, and those have since been proven false. What’s to say that “throwing harder suppresses home runs” isn’t just another in a list of untruths?
To a certain extent, every time you use xFIP to describe a pitcher’s skill level, you’re ignoring this pearl of broadcaster wisdom. After all, if you’re regressing everyone’s home runs back to a league-wide average, that implies that no one has special skills to suppress home runs when the ball is hit in the air. No one would say that xFIP is a perfect and foolproof predictor, but it does do fairly well when it comes to ERA estimators — it beats FIP and ERA, for example.
As a general believer that skill is over-ascribed in baseball (not every 2.5 ERA or 150 wRC+ is hiding a great process — sometimes it’s just a hot stretch), I’m naturally inclined to go with xFIP’s explanation of how fly balls become home runs. That’s not to say that throwing hard doesn’t have advantages, obviously — baseball’s ever-creeping velocity increase is proof of that. It helps with swinging strike rate, of course, and therefore directly helps increase strikeouts, the most valuable thing a pitcher can do. When the ball is struck, however, the hitter has, necessarily, not swung and missed. In fact, you’ve probably heard people say that when a hard thrower allows contact, it’s usually harder than normal because the ball was coming in so fast. Wouldn’t this increase home runs per fly ball? Sounds like something worth looking at.
I looked into the fringe benefits of throwing hard last year, but I wanted to do a more focused study of HR/FB rate. Looking at whether velocity and ERA are correlated, for example, doesn’t really tell us much. There are all kinds of selection biases in play here — if you throw 88 mph on average and are a major league pitcher, you’re probably doing something else amazing. Let’s ignore broad pitching metrics then and specifically focus on one thing: does throwing harder lead to home run suppression?
To answer this question, I went with the most straightforward experimental design I could think of. I looked at every pitcher who has thrown at least 50 innings between 2015 and the present. This gave me a 757-pitcher population, which I trimmed to 755 by eliminating knuckleballers. Then I looked at their average fastball velocity and HR/FB rate. There was one key question here — should I look at overall HR/FB, or focus on what happened to fastballs only? I settled on looking at overall rate for one main reason. I’m looking for useful takeaways here, not curiosities. If higher velocity decreases fastball home run rate but increases breaking-pitch home run rate such that the overall rate is unchanged, that’s not really useful. I want to know whether I can look at a single radar gun reading from a pitcher and say something meaningful about his home run suppression skills, and that means looking at overall rates rather than pitch-specific ones.
With that in mind, I did the simplest test I could think of — I regressed HR/FB against average fastball velocity. The results were not promising. Here, take a look at some dot soup:
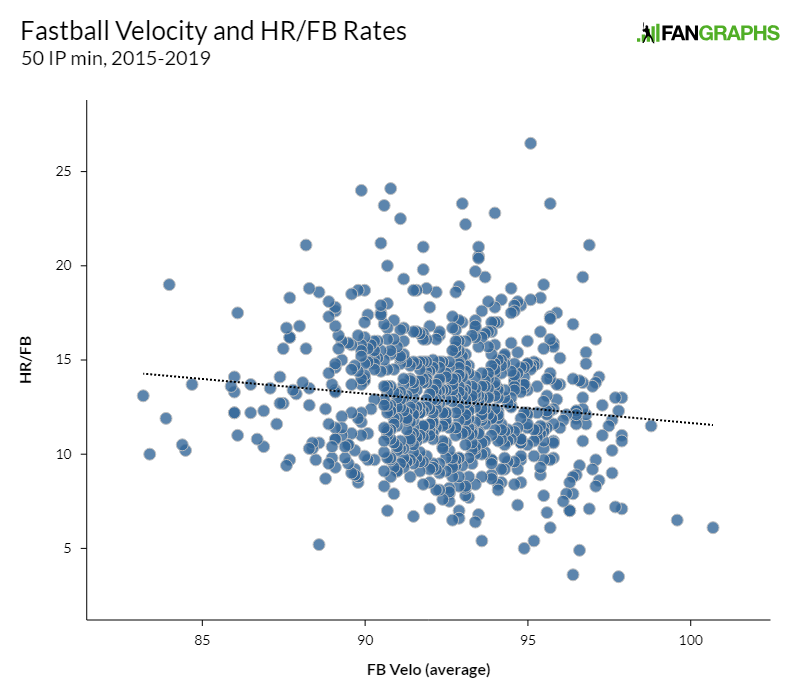
This is a whole lot of nothing. Maybe — maybe — you can perceive a general downward trend in the data. It’s swamped by noise, though. The r-squared of this relationship is a don’t-even-bother-reporting-this .015. If you used velocity to predict HR/FB rate, you’d be capturing mostly noise, and you wouldn’t even get very interesting predictions. Use that fit, and Hicks has the lowest HR/FB projection in baseball at 11.6%. Jered Weaver’s 14.3% is the highest. Predicting league average for everyone does almost exactly as well when it comes to the standard error of predictions.
Well, that’s it then, right? I came up with a specific test I wanted to run, and the data shot me down. Study and grow stronger, and so on. Not so fast, my friend. Looking at whether velocity is generally correlated to home run suppression isn’t exactly the question I was trying to ask. The conventional wisdom we’re looking at here is that throwing abnormally hard provides HR/FB benefits. The scatterplot of velocities and home run rates suggests that going from 91 mph to 92 mph doesn’t do much of anything for you, but we don’t care about the vast majority of the data. We only want to look at the real freaks, after all — the Hickses and Guerreros of the world.
Let’s look at our data a separate way. Instead of one giant population of pitchers, let’s split it into two. On one side, we have a tiny group, the 25 pitchers with the fastest fastballs in our sample. They’re not all Hicks and Aroldis Chapman types — Carlos Estevez makes an appearance, as does the aforementioned Guerrero. They’re hard throwers, but not universally great. Our second group is everyone else, the 730 pitchers who aren’t among the very fastest throwers in baseball.
Our first group sports a better-than-average 10.4% HR/FB rate. That doesn’t exactly scream outlier, but the overall average HR/FB rate since 2015 is 12.9%, and the average of our sample (pitchers with 50 or more total innings pitched) is 12.8%. We’re not talking a small sample, either — our group of 25 velocity standouts has more than 5,000 innings pitched over the past five years, as many innings as Nolan Ryan pitched in his entire career. Maybe we’re onto something here.
To evaluate whether there’s anything real, I performed a one-sided Student’s t-test, which attempts to measure the likelihood that two different samples come from the same underlying population. In English, this test looks at what the odds are that there’s just one mean HR/FB rate for all pitchers, and that the two groups look different by random chance. Well, we’re in luck: the t-test shows us a result. Are you a fan of long decimals? The p-value of this test is 0.000072. In other words, there’s a 0.0072% chance that the high-velocity group would have this low of an HR/FB rate or lower if the two groups have the same underlying mean. This isn’t to say that they’re definitely pulled from different populations, but it’s a pretty strong result. The hardest throwers really do seem different.
Now that I’ve come to a conclusion, allow me to walk it back somewhat. This, to me, is strong evidence that true outliers in terms of fastball velocity help suppress home run rates on fly balls. If you merely split the population down the middle and test whether those groups have a different mean, the t-test is inconclusive. However, the hardest throwers likely really do have lower true-talent HR/FB rates than the population of mere mortals. That said, we’re not exactly talking about a huge effect here. The fastest throwers had a 2.4% lower HR/FB rate than the sample as a whole. That’s just not a whole lot of home runs.
Take Guerrero as an example. He’s the pitcher who started this whole train of thought, after all. Over his entire 88.1-inning career, he’s allowed 82 fly balls. Apply that 2.4% difference in home run rate, and that gets us to two home runs less he “should” have allowed by throwing so dang hard. If we modify the xFIP formula to use the HR/FB rate for the high-velocity cohort rather than the league rate as a whole, that moves his xFIP lower by roughly .3, from 4.55 to 4.25. It’s an effect, in other words, but not a huge effect. For an extreme sinker pitcher like Hicks, who has allowed only 41 fly balls in his career, the effect is even smaller — he gets a .125 xFIP adjustment.
What does this all mean? Well, the announcer mostly had it right. It really is harder to hit home runs against pitchers who throw really, really ridiculously hard. On the other hand, the announcer mostly had it wrong. Have you ever tried to think about the difference between a 10.4% chance of something happening and a 12.8% chance? Watch literally a hundred observations, and two will be different. That’s simply too fine of a distinction for our brains to make sense of. If someone throws absolute gas, fine, they’ll probably allow less home runs. Don’t take that relationship too far in your head though. The vast majority of home run suppression is still random chance. The next time you find yourself thinking that a pitcher deserves a 5% or 6% HR/FB, let this temper your conviction. Differences exist, but their magnitude isn’t what you’d hope. In fact it’s almost too small to perceive.
Ben is a writer at FanGraphs. He can be found on Bluesky @benclemens.
LOVE the articles that look at larger scale questions!
How much does the pull% differ between the top 25 flamethrowers and the rest of the sample? Putting on my cause-and-effect hat, I would think that being harder to pull would make a pitcher tougher to homer against, all else being equal.
This checks out – pull percentage is less significant but still significant when it comes to that top-25 group. Pull percentage also has a better relationship to velocity than HR rate- if I had to guess why, I’d say that it’s because even if the slowest-fastball pitchers in the sample are doing something not captured by pure velocity to prevent home runs, they can’t really do much to prevent hitters from being early more often- they just throw slower.
I see how you got there based on the graph–when you get to the right of about 96/97, the HR/FB rate is entirely below the regression line, whereas in the 90-96 range it is all over the place. In general, I am a little skeptical this is the best way to look at non-linear data(I’d prefer a regression with polynomials or a kernel regression) but I don’t think those would tell us anything different.
I don’t know about a linear relationship, but if you squint and look at the graph it almost looks bell curvy. Which is to say for pitchers not terribly far from MLB average velocity, HR% has more to do with other factors than the velocity itself. But as you tend towards the extremes velocity does begin to have a real effect. At the high end, clearly, but even at the lower end of the velocity chart there are more points below your line than above it.
Or to put it another way, every MLB hitter can handle low to mid-90s gas. Those who can’t, don’t stay in MLB very long. But that isn’t true when a pitcher starts pushing 100mph. And for pitchers with sub-90s fastballs, they’re suppressing HR% with some sort of funk unrelated to velocity, because those who can’t don’t stay in MLB very long either.
That could just reflect the number of pitchers at each velocity, which would be normally distributed around the mean league velocity.
Great stuff. I immediately thought that you might have a selection bias in that your top 25 hard throwers would be primarily 9th inning guys pitching in a scenario when hitters are more willing to change their approach to prioritize getting on base.
I did a quick check to see if this might be possible and noted a decrease in ISO from .181 in the 8th to .165 in the 9th, while avg velocity in the 8th was 89.5 mph and 89.7 mph in the 9th. In all other innings the average ISO is .181 and the average velocity is 88.3 mph. Based on your findings you would expect a decrease in ISO 8th when you increase velocity by 1.2 mph, but instead the decrease in ISO doesn’t appear until the 9th, when average velocity is only .2 mph faster.
I don’t know what percentage of your sample were 9th inning guys, but now I am interested in whether changing the dataset to the top 25 starting pitchers and looking at only starters shows the same result. And additionally since I am sucked into this inescapable thought vortex, how can I show whether this decrease in ISO is due to a change in approach or the application of superior pitching talent?
I did a quick check on this by running the HR/FB rates of the top 25 velo pitchers, but for the first 8 innings only. Their HR/FB rate is about the same in the first 8 innings as in the 9th and later (.2% lower in the 9th and later than 8th and before) but it’s a smaller sample- only 2160 fly balls worth of data in the 8th and earlier. This is probably worth investigating more.
Was reading this along with Kim’s fastball piece, his main subject, Odorizzi, experienced a small uptick in velocity this year and his hr rate is down slightly, which could be noise or correlate somewhat to your general conclusion here, but the leaderboard of wFB/C from his piece is filled with both hard and soft tossers
It got me thinking from both your pieces and just general viewership of the game, preventing home runs is not all velocity, as your graph lays out, have you or do you think its worth the time to check spin rate effects of hr/fly-ball, or possibly location effect of that rate as from kims piece odorizzi is a high ball pitcher, is there a general value in spin/location in preventing home runs on batted balls, or are spin and location simply just tools for missing bats?
Wonder what the relationship looks like to FB spin rate?
1). As regards pull percentage, a 350 ft fly ball close to the line will most often be a HR, while the same vertical trajectory will not go out when hit closer to straightaway L or R. Does this explain some, most or all of the hardest throwers lower HR/FB?
2). As regards 8th vs 9th innings, I think that these 25 are better than average pitchers and whatever the cause may be more likely to pitch in 2 strike counts. Some nontrivial number of batters may swing less hard, and thus hit softer flies, and have a lower HR/FB.
Don’t know if you can check these things out without running into sample size issues.
Great article. This is vintage fangraphs analysis like it used to be with jeff and dave back in the day.
Not saying the new stuff is bad, fangraphs got just a bit more “journalistic” and friendly to read for non math loving users and thus more political, financial and personal player stories but it is good to see some vintage fangraphs back
I’m not sold. Physics tells us that a harder thrown ball should travel farther when hit. A harder thrown ball may be harder to square up, but once squared should travel farther.