Edwin Díaz Is Worse, but to What Extent?

Last Thursday, after Edwin Díaz’s meltdown in Philadelphia — five runs allowed in 1/3 of an inning, including the game-tying and game-winning home runs — I tweeted about Díaz’s 2019 performance in comparison to his 2018 performance. I argued that Díaz wasn’t that much worse this year compared to last, citing his strikeout-to-walk numbers and his xFIP. In response, others felt that Díaz had experienced a significant drop-off, contending that an increase in hard contact allowed as well as a lower strikeout rate suggested a serious fall in performance.
This discussion is what prompted this post. My followers and I agreed on one main point: Díaz is worse this year. Where we disagreed is more complicated: Just how much worse is Díaz, and why?
First, it cannot be understated just how good Díaz was in 2018. In 73.1 innings with the Mariners, he posted a 1.96 ERA and a 1.61 FIP. His 38.2% K-BB rate was the highest among all relievers with at least 10 innings pitched, and his 3.5 WAR ranked second. Seattle sold high on Díaz, trading him (along with Robinson Cano) to the Mets in December in a seven-player deal. They received Justin Dunn and Jarred Kelenic, and while it’s far too early to declare a winner of this trade, the Mariners’ end looks quite strong so far.
This season, Díaz has been undeniably worse. As alluded to above, his strikeout rate has experienced a dip, but his K-BB rate still ranks eighth among the 174 qualified relievers through the end of June. This drop is probably not due solely to regression, but it’s still worth noting that Díaz has only fallen from the 99th to the 95th percentile in the statistic. He’s still elite in that regard. Of course, strikeouts and walks aren’t the only things that matter, but relievers have less of an opportunity (at least compared to starters) for batted ball luck to even out within one season. One bad outing, like Díaz’s against the Phillies, can influence their full season numbers pretty significantly. Díaz has allowed 17 earned runs this season (4.78 ERA). Twelve of them have come across just three outings.
With all of this in mind, the first factor I decided to investigate was natural regression. As noted above, there is almost certainly more at play here, but the question I was trying to answer was this: With natural regression included, how much worse should Díaz be this year? With this information as a baseline, I could compare how much worse Díaz is versus how much worse he should have been.
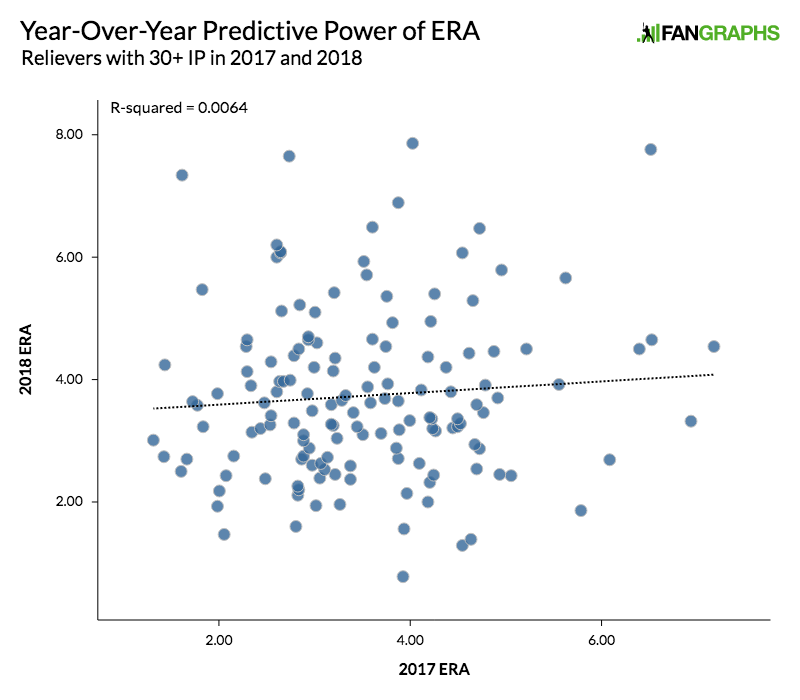
To answer this question, I ran three tests. Using data from 2017 and 2018, I plotted relievers’ Year 0 and Year 1 ERAs, FIPs, and xFIPs in search for a correlation. (I only included relievers who pitched more than 30 innings in both seasons, providing a sample of 148 players.) Just how much does a reliever’s Year 0 statistic influence their Year 1 statistic? Just to provide some context, we’d expect the ERA correlation to have the least strength due to the variance of batted balls. The correlations for FIP and xFIP should be demonstrably stronger.
Here’s the chart for ERA:
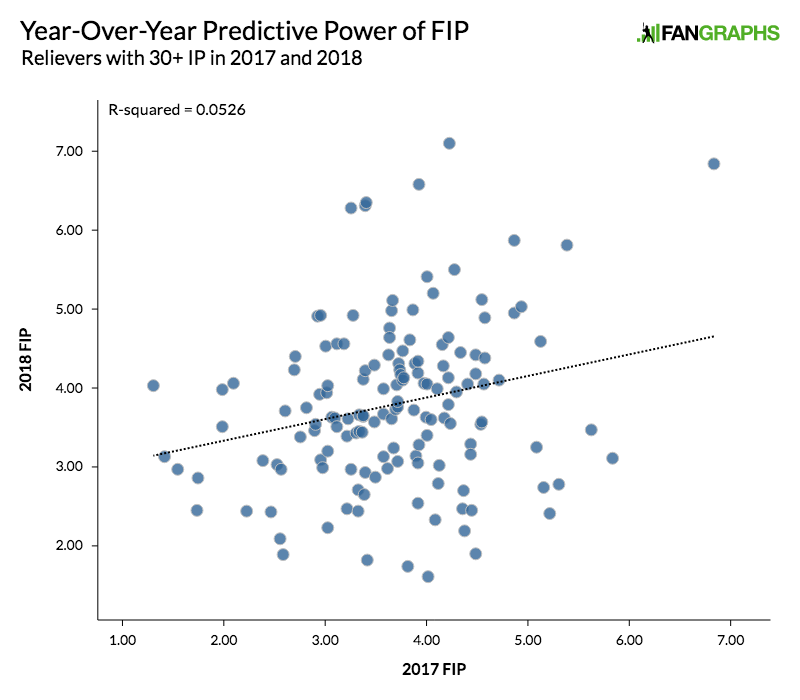
Here’s the chart for FIP:
And, here’s the chart for xFIP:
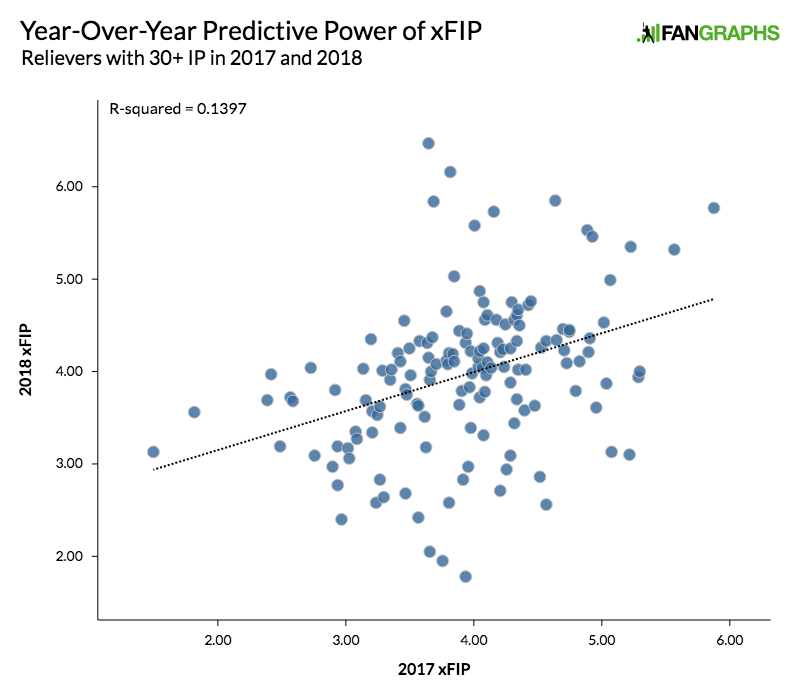
As you can see, there’s almost no correlation between Year 0 ERA and Year 1 ERA (r = 0.08), a small correlation between Year 0 FIP and Year 1 FIP (r = 0.23), and a moderate correlation between Year 0 xFIP and Year 1 xFIP (r = 0.37). Even in a statistic that mainly focuses on strikeouts and walks, there is still considerable variability from year-to-year, confirming what we already know about relief pitching.
How does this relate to Díaz? We can use these equations to predict what his FIP and xFIP should have been with normal regression factored in. After doing the math, we find that Díaz would have been “predicted” to post a 3.22 FIP and a 3.06 xFIP this year, based only on his 2018 performance. I do admit this is far from a perfect method, as these equations can’t explain most of the variability in the Year 1 statistic. At a minimum, however, they give us a ballpark idea of what we should have expected from Díaz.
(As an aside, there was little evidence to suggest that elite relievers have less year-to-year volatility.)
Likewise, more advanced projection models both saw significant regression as a possibility for Díaz. Prior to the season, ZiPS projected a 2.54 FIP, and Steamer projected a 2.37 FIP. Now the two models have bumped up Díaz’s rest-of-season FIP even further to 2.88 and 2.53, respectively.
Let’s say that Díaz was going to follow my model exactly and post a 3.22 FIP this year. Through 34 appearances this season, he has a 3.82 FIP, or 19% worse than expected. His 2.87 xFIP, however, is actually 6% better than what we would have expected. So what’s happening here? MLB.com’s Mike Petriello put it best. As he tweeted last week, “Edwin Díaz is pulling off the neat trick of getting hit WAY harder and also having everything go wrong.”
When Díaz is on the mound, hitters have posted a .397 BABIP, something that won’t be sustained over a larger sample. Worse yet, he’s allowed a 22.6% HR/FB rate, the 13th-highest among qualified relievers. This is happening even despite a 90.8 mph average exit velocity on fly balls allowed, a figure that ranks in the 76th percentile among all pitchers. Take a look at the correlation between average exit velocity on fly balls and HR/FB rate for pitchers:
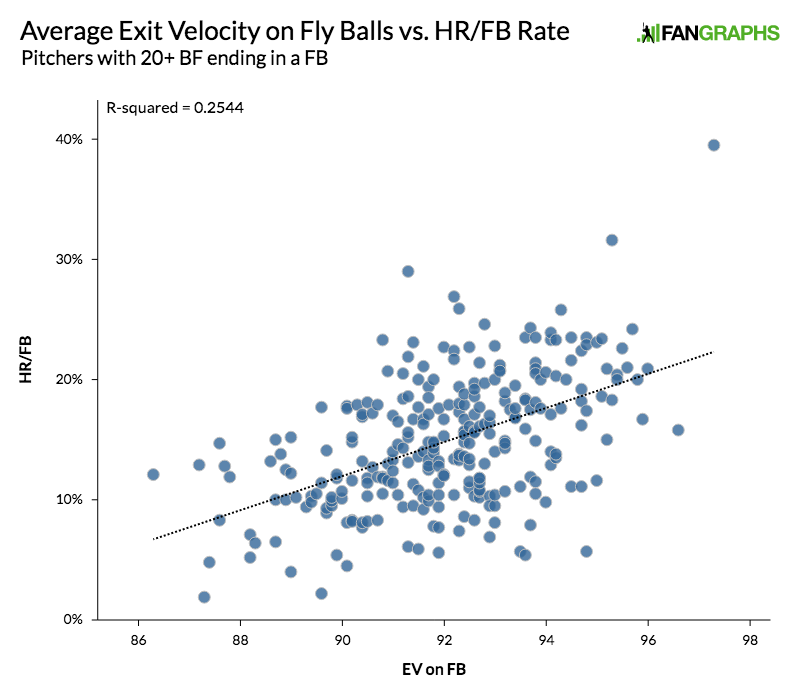
There is actually a pretty decent correlation here (r = 0.50). Díaz’s residual — or the number by which he’s over- or under-performed his expectations — is 0.0935. This means that his HR/FB rate of 22.6% is 9.3 points above what it “should” be, 13.3%, based only on his average exit velocity on fly balls. By this metric, he’s been the sixth-most unfortunate pitcher in baseball when it comes to allowing home runs.
Let’s consider a world in which Díaz’s HR/FB rate was 13.3% instead of 22.6%. That would shave three home runs off of his total, which, as of this writing, stands at seven. Still concerning is his eight-point drop in ground-ball rate, which will naturally result in more homers from the get-go. But he’s still allowed almost double the number of home runs as he should have.
This is why, even despite his results, I would argue that Díaz remains elite, even if he does not have enough outings left this season to correct his early struggles. Look at it this way: Just 24 relievers currently have an xFIP- of 75 or better. Only three of them — Nick Anderson, Matt Barnes, and Díaz — have an ERA- above 100. Díaz’s is 116. Similarly, just 32 relievers have an ERA- above 115. Only four of them have an xFIP- below 85. Díaz’s is 66.
Why is there such a disparity here? It’s entirely due to the two factors that my followers and I were discussing on Thursday night. Díaz does remain in elite territory when it comes to strikeouts and walks, and that’s really good. But where he truly differs in 2019 is his ability to limit hard contact, which could be a combination of things: poor luck, natural regression, or a drop in talent level. To me, there’s a little bit of all three.
Devan Fink is a Contributor at FanGraphs. You can follow him on Twitter @DevanFink.
I wonder how the new baseball impacts him. From what I read, the seams on the 2019 baseball are lower and several pitchers were complaining about not being able to get a good grip on it. It impacts the slider as much as anything. If you look at Diaz’s pitch values, his slider was off the charts for the last 3 years and it’s been below average this year.
Maybe he’s hanging a few more sliders, and that’s leading to the increase in HR? When he’s on, he still looks unhittable – but then bam, the next day he’s giving up 2 HR.
FWIW, that might be impacting Syndergaard as well. His slider values have plummeted this year.