Every Pitcher, Missing the Zone
Last week, I noticed something strange about Clayton Kershaw: he’d seemingly lost the will or ability to throw strikes in a 3-0 count. I did some middlingly fancy statistics, declared that a result like Kershaw’s was unlikely to happen by chance, and called it a day.
Unfortunately, I’d missed something subtle but important:
The Bonferroni correction is, in essence, a way to adjust confidence intervals to avoid taking too much signal from your data. Imagine, if you will, 10 gamblers each flipping 10 coins. One of them flips nine heads in his sample of 10. Amazing, right? There’s only a 1% chance of that happening!
Well, kind of. There were 10 of those gamblers, after all. The Bonferroni correction asks us to formulate a hypothesis beforehand, like “Gambler Number Nine is unusually likely to flip heads.” If we wanted to hypothesize that each gambler was likely to flip heads, that’s 10 hypotheses right there. Without getting too far into the realm of explaining statistical methods, suffice it to say that the Bonferroni correction requires more extreme values to reject the null hypothesis the more hypotheses you start with. In other words, the more things you observe, the weirder they need to be before they’re notable.
What does this have to do with Kershaw? In a vacuum, his disastrous 3-0 strike rate is a notable outlier. Consider, though, that this didn’t have to happen to Kershaw in particular. It could have happened to Walker Buehler, or Yu Darvish, or Masahiro Tanaka. It could have happened to some random fifth starter. I’d probably still write about it. Put it that way, and maybe it’s a little less extreme.
What should we do? We could wave our hands and say “eh, it’s still pretty rare.” That’s true, but I feel it misses the point. Articles about how weird something is don’t pack quite the same punch if that thing isn’t weird. More to the point, I want to believe what I said in the conclusion of the Kershaw article. Baseball is more fun to me if pitchers aren’t machines, if they’re sometimes hot and sometimes cold, with no way of telling which will be which before they take the mound.
So, here’s our problem. I’d like to know whether pitcher talent in this very particular case, throwing a strike on a 3-0 count, is stationary. To do so, we’re going to look at how each player’s strike-throwing varies from year to year. Kershaw’s sudden turn to wildness is weird — but there’s a roughly 2% chance that he could have done it by chance even if his talent remained unchanged. We’ll need to calculate a similar number for every pitcher to see whether the overall distribution supports the idea that pitchers aren’t strike-throwing automatons.
First, I took the career 3-0 strike rate of every active pitcher through 2018 (minimum 75 3-0 counts). These represent our best guesses at everyone’s career 3-0 strike rate. Could this be missing material changes in some pitchers? For sure! We’re painting with an extremely broad brush; coloring outside the lines once or twice is a given.
With those rates in hand, it’s time to get current. Well, more current, at least. Next, I took every pitcher who threw at least 15 3-0 pitches in 2019. The pitchers who are in both sets — who threw at least 75 3-0 pitches before 2019 and 15 in 2019 — will form our sample, and there are 97 of them. Kershaw, the reason for the study, is one such qualifier, but it’s not limited to veterans; Lucas Giolito and Mike Clevinger qualify, for example.
From there, things get a little mathematical. With a true-talent rate and a 2019 sample size, we can construct a binomial standard deviation. In other words, we can normalize everything. The more 3-0 pitches a pitcher threw in 2019, the smaller the standard deviation (in general — their zone rate also informs their standard deviation). Makes perfect sense — extreme rates are less notable in small samples, something that baseball has seared into our brains over time.
Okay, so we have an “expected” strike-throwing rate and a standard deviation for each player. Next, we simply compare their observed 2019 rate to the expected rate and normalize the result. Let’s use Kershaw as an example: in his career before 2019, he threw strikes on 3-0 59.7% of the time. With 18 observations in 2019, that works out to a standard deviation of 11.5%. His actual zone rate in 2019 was 33.3%. Fill all the data in, and Kershaw’s zone rate was (.333-.597)/.115, or -2.29 standard deviations from the mean.
With every player normalized, we can simply build a distribution. If career rates are really the best estimate for 2019, we’d expect a normal distribution, a perfect bell curve with the familiar 68/95/99 proportions. How does our data look?
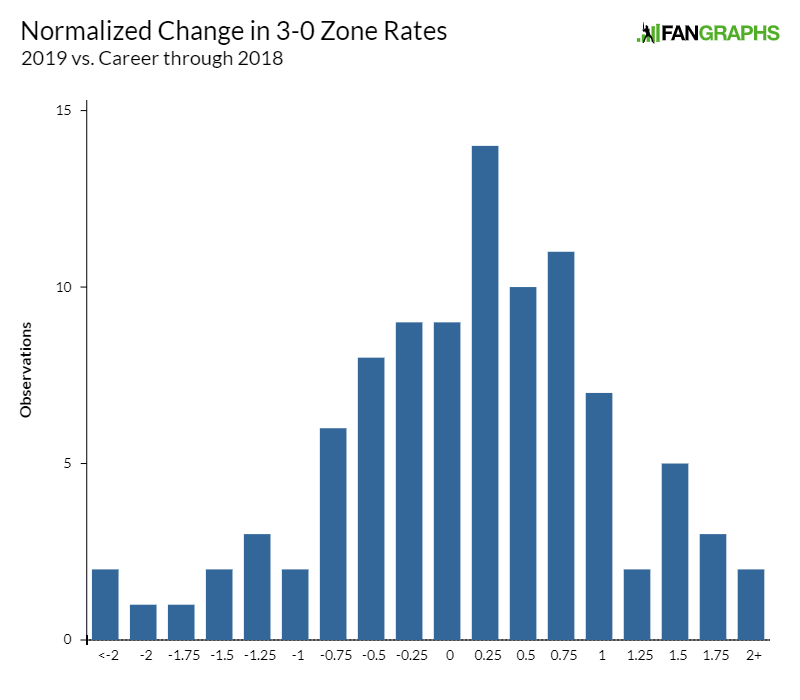
A little chunky, to be sure, but that looks reasonably normal to me. Lower the resolution a bit, and it almost looks like a textbook picture:
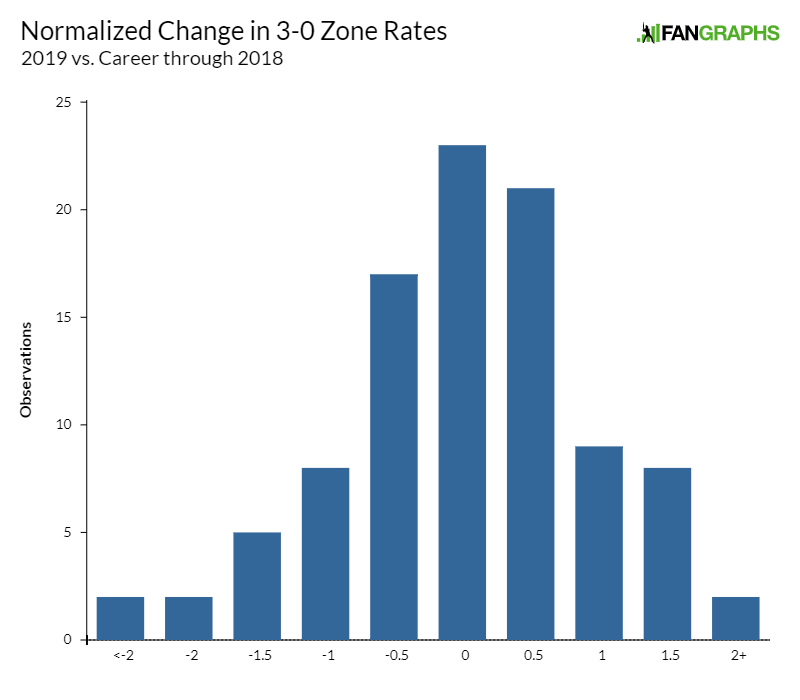
In fact, 71% of the observations are within one standard deviation of the mean, and 95.8% are within two standard deviations. You could run a normality test on the data to see if this pattern fits a normal distribution, but there’s no need. It’s normal. In other words, my dream of pitcher talent changing wildly and without warning simply isn’t borne out by the data.
I could, were I so inclined, continue to tilt at windmills. Raise the minimum career plate appearances, maybe? Nope, that won’t do it — everything still looks normal. Lower it to 50? No better. We could hunt down pitchers with particularly volatile year-to-year changes in 3-0 strike rate and see if we could learn anything from them.
None of that is worth it. Sometimes, you have to admit defeat. In fact, it’s not even defeat — we learned something interesting about baseball, and even a little bit about math, through our lack of findings.
It’s fun when baseball is weird and woolly, when dry mathematical techniques can’t capture the full richness of the game. The thing is, even though this particular part of baseball happens to fit your high school statistics textbook, baseball is still weird in all kinds of places. Just because this particular weirdness looks like random chance doesn’t mean all weird parts of baseball fit into that box.
Still, I’m a little sad about Kershaw. I liked the idea of the best pitcher of our generation waking up one morning and simply not having it in this small way. It’s okay, though. There will be more chances for weirdness. Real baseball is coming back, and with it, more opportunities to see something bizarre, then spend hours deciding whether it was merely a fluke or a meaningful new result.
Ben is a writer at FanGraphs. He can be found on Bluesky @benclemens.
I like the “Wyatt Earp Effect” framing of this phenomenon – it was extremely unlikely that *Wyatt Earp* would survive (without ever even being wounded, if I remember correctly) the truly insane number of gunfights that he did, but given the sheer number of gunfights and participants in those gunfights in that time and place, it was all but inevitable that *someone* would escape so many unscathed, and Wyatt Earp just happened to be that someone! Also, I think imagining Clayton Kershaw as Wyatt Earp is fun.
Or Joe DiMaggio’s hitting streak… Unlikely for him to hit in 56 straight, but with all the great hitters over the past 100+ years, somebody was going to hit in 50 straight…
My understanding of DiMaggio’s hitting streak is that it would not be expected in 100 years of baseball, but more like 10,000 years of baseball.
which means that it’s probably about a 1% chance, given our history of baseball, that anyone would have a 56-game hitting streak. Seem crazy, until you consider all the other things that had only a 1% chance of happening over 100 years of baseball which have not happened.
Yeah, I’m not sure how to do the math, but Stephen Jay Gould said it should have been impossible ( I trust baseball nerd paleontologists in most things)
I was surprised that the WEE didn’t get mentioned, that’s what I was thinking of. Maybe the difference in framing is between statistics and probability?
Basically both change the question from “isn’t it amazing that this happened to this guy?” to “what are the odds this would happen to somebody?”
Related to the anthropic principle, too. Life is unlikely…but what we’re doing is effectively ourselves being Wyatt Earp, and talking about how incredible it is that we’re alive and intelligent and everything, when maybe it was just … it was going to be someone, somewhere. I actually think this is how a lot of phenomena work.
Wyatt Earp was incredibly special. Gun fights were rare in the “wild” West. He was at the only gunfight in the wild West with people standing in sunlight, facing each other, and shooting.
The willingness of FG writers to engage so thoroughly with their commentators, and admit defeat when appropriate, is a lot of why this is one of my favorite places on the internet. Thank you, Ben.
This article is why I think I would be friends with Ben irl.
Opportunity missed, Ben, to link an xkcd comic on bonferroni. 🙂
https://xkcd.com/882/
Has anyone attempted to ask Kershaw? It actually seems like there could be a method to the madness.
Personally, if I were an all-time great at the end of my career with a suddenly very hittable FB, giving up HRs at more than 2X my career average, and getting squared up on 42% of BIP, I would probably be a little shell-shocked and averse to throwing pitches down the pipe even on 3-0.
I forget how, but tests exist to determine if a distribution is normal. You can check both for skewness and kurtosis. So do high school stats include Bonferroni? Dang, the bar has raised as I first learned about Bonferroni in my PhD multivariate course…