Gleyber Torres Should Be Hitting for More Power Than This

After hitting 62 home runs over his first two seasons in the big leagues — his age-21 and age-22 seasons, no less — Gleyber Torres was hailed as baseball’s next superstar. Even in lineups featuring Aaron Judge, Giancarlo Stanton, and Gary Sánchez, no Yankees player hit more homers over the 2018 and ’19 seasons than Torres. And while subpar defense limited his overall ceiling, his 5.6 WAR over that stretch still represented an impressive output for a player that young.
In 2020, however, the power that defined Torres’ offensive production all but disappeared. Torres, who posted a .235 ISO in 1,088 plate appearances over his first two seasons, slashed just .243/.356/.368 last season, good for a .125 ISO. He homered just three times in 160 plate appearances, but improved plate discipline — his walk rate jumped 5.5 points compared to his career averages, while his strikeout rate fell 5.6 — drove what remained above-average offensive output. Torres still posted a 106 wRC+, but he couldn’t outhit his defense like he had the two years prior and posted just 0.2 WAR.
| Year | PA | HR | AVG | OBP | SLG | wOBA | wRC+ | WAR |
|---|---|---|---|---|---|---|---|---|
| 2018-19 | 1088 | 62 | .275 | .338 | .511 | .354 | 123 | 5.6 |
| 2020 | 160 | 3 | .243 | .356 | .368 | .326 | 106 | 0.2 |
It was fairly easy to dismiss Torres’ 2020 performance as a shortened-season outlier, and while we could go back and raise eyebrows at his markedly worse batted ball quality, it’s important to remember that expected stats are meant to be descriptive rather than predictive. It was entirely possible that the COVID season was the reason for Torres’ dip in both batted ball quality and top-line production. The pre-season projection systems would mostly agree with that sentiment. Both ZiPS and Steamer projected a career-high in wRC+ and a 30-homer season, likely due to the fact that Torres is a young player with an excellent track record, one who should only be improving with more time in the big leagues.
Unfortunately, this season has brought more of the 2020 same from the infielder, who has struggled mightily with the power, producing even worse results than he did during his mini-power outage last year. Through games on Saturday, he’s slashing .242/.325/.317. His .075 ISO is the seventh-lowest in baseball. He’s homered just three times in 272 plate appearances. It’s hard to believe that this is the same player who led all Yankees in homers from 2018-19, a time when the Yankees hit more home runs than any other team in baseball.
What’s even more concerning is the fact that we now have over 400 plate appearances of low-power Torres, a sample that represents nearly 40% of his pre-2020 data. Here’s the same chart as above, but with last season and this season combined:
| Year | PA | HR | AVG | OBP | SLG | wOBA | wRC+ | WAR |
|---|---|---|---|---|---|---|---|---|
| 2018-19 | 1088 | 62 | .275 | .338 | .511 | .354 | 123 | 5.6 |
| 2020-21 | 432 | 6 | .242 | .336 | .335 | .304 | 92 | 1.0 |
That isn’t ideal, and it makes one wonder how exactly Torres’ power has fallen off of a cliff and whether or not it can get back to where it once was. To be sure, Torres benefitted greatly from playing in Yankee Stadium. Even when he hit close to 40 regular season round-trippers in 2019, he was one of the players who most outperformed their “expected home run” total, which is tracked by Statcast and probabilistically considers how many batted balls should have left the yard based on their launch angles and exit velocities. Including the postseason, Torres homered 41 times in 2019, but by expected home run, he should have only hit 32.4, a difference of 8.6:
| Player | Team | Actual HR | xHR | HR-xHR |
|---|---|---|---|---|
| Alex Bregman | Astros | 45 | 31.7 | 13.3 |
| Eugenio Suárez | Reds | 49 | 38.1 | 10.9 |
| Kyle Seager | Mariners | 23 | 13.0 | 10.0 |
| DJ LeMahieu | Yankees | 29 | 19.9 | 9.1 |
| Brett Gardner | Yankees | 29 | 20.4 | 8.6 |
| Gleyber Torres | Yankees | 41 | 32.4 | 8.6 |
| Jesse Winker | Reds | 16 | 7.6 | 8.4 |
| Jason Heyward | Cubs | 21 | 13.1 | 7.9 |
| Yuli Gurriel | Astros | 33 | 25.8 | 7.2 |
As you’ll notice, there are three Yankees, two Reds, and two Astros in the top-10 — a lot of that is due to ballpark effects. Yankee Stadium is home run friendly, and though it does seem as if Torres benefitted greatly from his home park, he’d still be quite the power threat with 32 homers rather than 41. Plus, it’s not as if Torres has changed home ballparks since 2019; he still plays for the Yankees. And it’s hard to even consider the changing baseball as the reason why he’s not the same player. This problem started in 2020, when the ball was still very much juiced. Things seem to have changed for Torres himself.
One very interesting point made by Derek Albin at Views from 314 Ft. and then furthered by Al Melchior at The Athletic was that Torres has just been far too late over the last two seasons and not able to catch up to the fastball. Torres is pulling the ball significantly less than he did his first two seasons, particularly on fly balls, and that is likely a main contributor to his bleak power numbers. After pulling the ball roughly 44% of the time from 2018 to ’20, he’s done so just 39% of the time since. The drop-off is more significant among fly balls and line drives: he went pull-side 32% of the time from 2018 to ’19 and just 24% of the time from ’20 since. This has all happened amidst a notable increase in his groundball rate, which ultimately gives us a full set of his troublesome changes:
| Year | GB% | LD% | FB% | Pull% | Pull%, FB/LDs |
|---|---|---|---|---|---|
| 2018-19 | 35.3% | 22.4% | 42.3% | 43.5% | 31.9% |
| 2020-21 | 43.4% | 20.3% | 36.3% | 38.5% | 24.0% |
Why does pulling your line drives and fly balls matter? Melchoir touched on this with a couple of case studies, but I wanted to look at something a bit broader. Using our splits leaderboards, I pulled every player-season from 2017-19 with at least 90 fly balls and line drives. (That was just the auto playing time suggested for the output.) I then compared each of these figures to the player’s isolated power that season. Pulling the ball on line drives and fly balls does have a statistically significant (p-value of 0 for the coefficient) relationship with a player’s power production. Here’s what the association looks like visually:
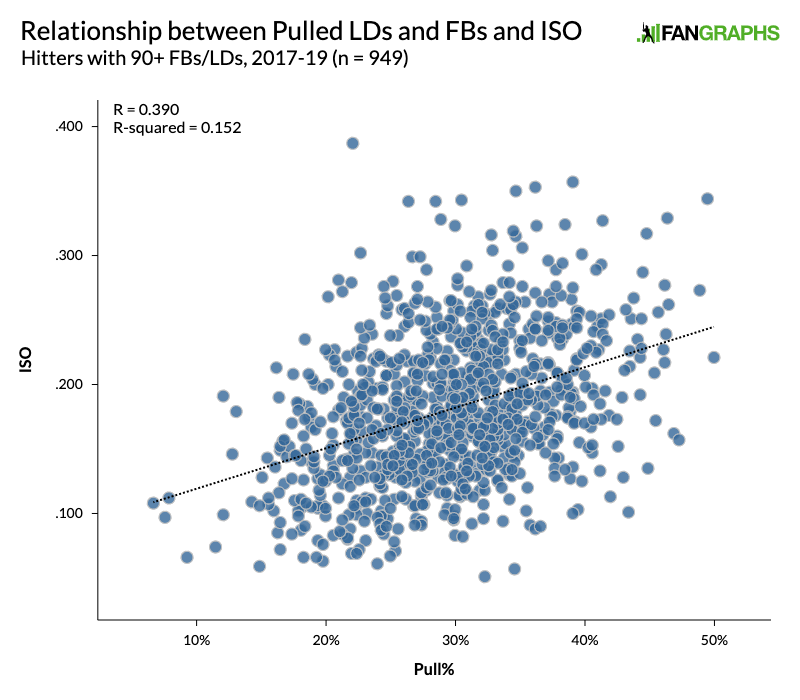
There is definitely something there, which shouldn’t be surprising: The pull side is where hitters typically generate their power. That was certainly true for Torres, who, from 2018-19, posted a 91.2 mph average exit velocity when pulling the ball, good for 67th percentile pull pop. When he went the opposite way, however, he posted just a 85.6 mph average exit velocity, putting him in the 52nd percentile. The 5.6-mph difference didn’t rank near the top of the league, but it was the 65th-largest of the 204 hitters with at least 500 batted balls from 2018-19.
Torres has completely flipped the script, and not in a good way. He’s pulling less, and even when he does, he isn’t making good contact. His exit velocity on opposite field batted balls has actually increased since 2020, up to 88.0 mph, but his exit velocity on pulled balls has dropped all the way down to 86.5 mph. Torres used to have 67th percentile pull-side pop. Now? He’s in the ninth percentile. Among the 145 players with at least 500 batted balls from 2018-19 and at least 200 from 2020-21, Torres’ drop in pull-side exit velocity is the worst in baseball, and it’s especially puzzling given that he is still just 24 years old.
| Name | Pull EV, 2018-19 | Pull EV, 2020-21 | Difference |
|---|---|---|---|
| Gleyber Torres | 91.2 | 86.5 | -4.7 |
| Andrelton Simmons | 89.1 | 84.5 | -4.6 |
| Manuel Margot | 90.3 | 86.3 | -4.0 |
| Corey Dickerson | 89.9 | 86.3 | -3.6 |
| Trevor Story | 93.2 | 89.7 | -3.5 |
| Trey Mancini | 90.4 | 87.0 | -3.4 |
| Jonathan Villar | 89.2 | 86.0 | -3.2 |
| Eugenio Suárez | 92.6 | 89.4 | -3.2 |
| Starling Marte | 89.7 | 86.6 | -3.1 |
| Yoán Moncada | 94.0 | 91.0 | -3.0 |
As others have noted, as a result of this huge drop in power, pitchers are willing to challenge Torres more. Though his discipline has only improved since entering the big leagues, he is not as scary as he once was. He’s getting more fastballs, and he’s not doing any level of damage. He’s hitting just .142 with a .315 slugging percentage on 85 plate appearances ending with a four-seamer, a far cry from his .303 average and .703 (!) slug against the pitch in 2019. Perhaps those who surmise that Torres is just late on everything are right. It would explain why he’s pulling the ball significantly less than he used to, and why he has posted such a low exit velocity on the batted balls he does pull.
Torres is still just 24. He has plenty of time to figure things out, and has a track record of being a productive major leaguer. The Yankees would be wise to continue to give him a long leash to allow him to figure things out. Perhaps it’s mechanical, or perhaps it’s just timing. But it’s obvious that Torres isn’t the power hitter he used to be, and while time is definitely on his side, it seems as if tweaks must be made in order for him to return to being the power threat he once was.
Devan Fink is a Contributor at FanGraphs. You can follow him on Twitter @DevanFink.
Wait when did he hit 41 HR?
2019. 38 in the regular season and another 3 in the postseason.