Going to the Well: Studying Velocity and Leverage
As a matter of self-preservation, I don’t listen to what Curt Schilling says very often. The guy could pitch, however, so when he’s talking about throwing baseballs, not the other stuff, I tune in. When he happened to be on television last year (talking about throwing baseballs), he said something about “going to the well”. Schilling was referring to a starting pitcher getting into trouble — giving up a few hits, walking a batter — and then having to dip into a metaphorical “well” of grit and determination (and most likely velocity) to get out of the inning without further damage.
We know baseball games find themselves at fulcrum points: high leverage situations where the outcome of one at-bat can tip the balance of win expectancy one way or the other. Thinking about Schilling’s “well” comment further, I wondered – how does a starting pitcher’s velocity change in different leverage situations? Does it increase above the pitcher’s usual average when men are on base or when the game hangs in the balance, as we might expect it to?
Does the well really exist?
For a complete background of leverage, check out the FanGraphs glossary entry, but here’s a short rundown of the values of the leverage index:
• Low leverage: <0.85
• Average leverage: 1
• High leverage: >2
Today, we’re just going to approach this question in respect to starting pitching. Relief pitchers naturally find themselves coming into games in high leverage situations (that’s their job), making it a little bit more difficult to establish a low leverage baseline to notice velocity changes; the sample size of pitches is also smaller. That’s perhaps something for another day.
While I have chosen a particular pitcher to highlight (focusing on an individual’s velocity changes proved to be much simpler than trying to align the velocities of a group with the leverage index), I also focused on a larger sample size of pitchers to help me establish overall velocity changes as a game progresses. This sample in question is all the pitches thrown on one day — the Monday of the last week of the 2014 season, September 22nd.
First, there is the issue of pitcher fatigue that we have to get out of the way before properly looking into any trends related to our pitcher. Overall, I’m presenting this as a good thing to keep in mind: in the future I’ll attempt to map both velocity changes due to leverage and velocity degradation due to fatigue at the same time, but for now it’s a simple truth to keep in our heads. Let’s look at the change in fastball velocity between innings for our pitchers in the larger sample:
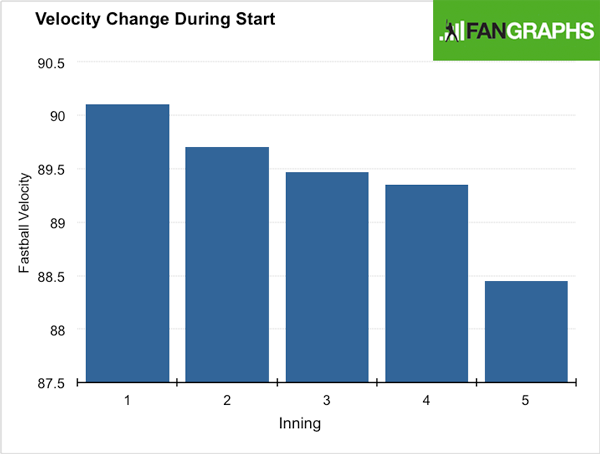
I’ve limited this to five innings, as all of the pitchers in the larger sample were able to go five, and again: this is about starting pitching. As soon as one of the pitchers is removed from the sample (many were taken out of the game in the sixth inning), the velocity data for the group is then skewed toward the pitchers remaining, who may throw harder or softer than the ones who were taken out.
Now onto our pitcher. We’re going to look at Sonny Gray, who has a very good fastball, usually sitting in the lower part of the mid-90’s with great life. He immediately came to mind when I was thinking of pitchers to highlight, mostly because of what he did during the third inning of this game:
Sonny Gray doesn’t really throw 96 mph. He is physically capable of it, as we have just seen, but he doesn’t do it except in a circumstance like facing the middle of a Detroit Tigers lineup in the playoffs when Justin Verlander is the opposing pitcher. However, with that knowledge, we might envision other times when he could throw that fast, or at least increase his velocity to somewhere near that point when needed.
What I’ve done is chart his velocity related to the game leverage index for all fastballs he threw from the end of May to the middle of June, 2014. It’s not the greatest sample size, but I was hesitant to extend it further beyond that time period due to some long term velocity decline that we can witness here, from Brooks Baseball:

I tried to find the sweet spot where his velocity stayed level for five starts, right before that big crater in June. After pulling just the fastballs from those five starts, I mapped it against the leverage index for each pitch:

While there isn’t an eye-popping trend to it, we can see that all of the fastballs Gray threw above a certain leverage (around 1.5) were 95+ mph. A casual baseball fan will surely tell you that pitchers can reach back for more and “bear down” when needed, and given what we’ve seen, there could be merit to those statements. While we can’t concretely say for sure that “the well” exists because of this sample size, it’s going to be something I’ll be revisiting in the coming months.
There are some great questions to be mined with this topic — do offspeed pitches increase in speed or movement with increased leverage? What about spin rates of curveballs? How do we account for differences in pitchers from the windup vs. the stretch? I’ll be answering those soon. Until then, maybe I should ask Curt Schilling.
Owen Watson writes for FanGraphs and The Hardball Times. Follow him on Twitter @ohwatson.
I love you, Sonny. It’s a shame your HS women’s basketball team lacks your competitive spirit.