
How Do Star Hitters Age?
With Prince Fielder and Albert Pujols hitting the free-agent market this offseason, there have been many discussions on how the two of them will age. Lots of work has been done on how an average player ages, but Pujols and Fielder aren’t your average players. Which begs the question: How do stars age, compared to the rest of the league?
One of the hardest aspects when looking at elite players’ aging curves is knowing when to consider them elite. Several hitters who are playing right now appear to be sure-fire hall-of-famers — just as long as their careers don’t do an Andruw Jones nose-dive toward uselessness. To generate a list of players who seem headed toward stardom, I selected players since 1980 who had a total of 20-plus WAR during a three-year span. Also, I took the players who generated WAR of 9.5 or more in a single season.
The most important idea to remember is that these players are excellent. Some of them had single seasons that were more productive than other players’ entire careers. As a result, they had further to decline than an average player. If one of these players is down 1 WAR off their peak, they are still playing at a MVP or at an all-star level.
Another point to remember is that these aging curves are set for a 600 PA season and they look at the player’s skill on the field. Players may have higher WAR in their peak seasons because they play more. As the hitter gets older and begins to break down, the playing time component of WAR begins to compound the decline.
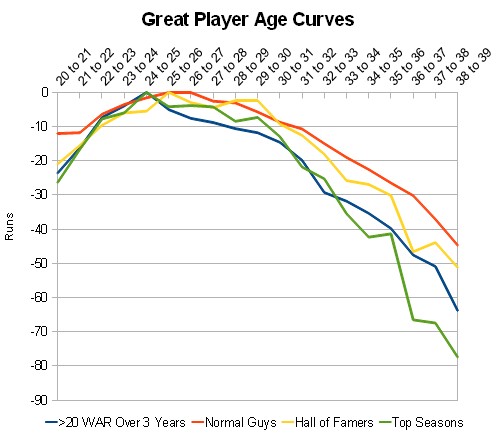
Here is the graph with four curves (average players, one great season, three good seasons and Hall-of-Famers since 1955). The y-axis is in runs and about 10 runs equal one win. All players are weighted to 600 PA (more background information on how the curves are generated):
A few points from the graph:
Better players peak earlier in their careers. While the general population peaks at age 27, the group of good players peak at either 25 or 26 years old.
At 30, great players begin to see a pronounced decline. The one- and three-year groups peak at age 25. Here is the number of runs lost from ages 25 to 30 and from ages 30 to 35
Group: Run Lost from 25 to 30, Runs Lost from 30 to 35
One Great Season: -8 runs, -34 runs
Three Good Seasons: -12 runs, -24 runs
Average Player: -5 runs, -17 runs
From 25 to 30, the two groups lost an average of 10 runs. During the next five years, the run decline was between a 25 to 35. This loss is much more than the average player. (To reiterate: the main reason for the above-average decline is that stars have much further to fall.)
Hall-of-famers don’t usually peak — instead, they plateau. From ages 24 to 30, their production is generally constant. From then on, it drops at a high rate.
There’s no doubt that if Pujols retired today, he would get into the Hall of Fame. Here is his “curve” (adjusted to 600 PA) vs. that of other HoFers:
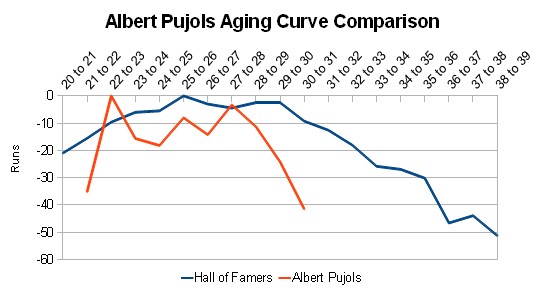
Pujols’ production seems to have peaked and dropped off a little earlier than the average hall-of-famer. I hope this information doesn’t add fire to the rumor that has been floating around.
For a Fielder comparison, I used the three good seasons — which he is closest to accomplishing — and the HoF curve.

It’s not as nice of a match as Pujols’ curve, but Fielder looks to be headed in one of only two ways: He’s either going to maintain his current level for a couple of more seasons — or- 2011 might have been his best season and it’s all downhill from here.
When people say that great players age differently, they’re correct — to some extent. In the cases of Pujols and Fielder, that’s the caveat. And it’s an unfortunate one because teams looking to sign them long-term need to know that their best years are probably behind them.
Jeff, one of the authors of the fantasy baseball guide,The Process, writes for RotoGraphs, The Hardball Times, Rotowire, Baseball America, and BaseballHQ. He has been nominated for two SABR Analytics Research Award for Contemporary Analysis and won it in 2013 in tandem with Bill Petti. He has won four FSWA Awards including on for his Mining the News series. He's won Tout Wars three times, LABR twice, and got his first NFBC Main Event win in 2021. Follow him on Twitter @jeffwzimmerman.
Raises the question.
Wow, I’m turning into that guy.
Good. No one ever points that mistake out.
“Begs the question” = “Makes the question moot.”
begs the question = using your conclusion as an assumption
Its actually somewhat difficult to do in a sentence or two without looking like a complete moron.
I thought hitters peak years started at age 27, and Fielder is 28.
Wasn’t there a post around here a month or two or three ago, showing that heavier players (like Fielder) age differently? If you add that into the mix here, how would alter the projected Prince Fielder aging curve that you got here? I’d be very interested in a follow-up on this.
Yes:
http://www.fangraphs.com/blogs/index.php/how-will-prince-fielder-age/
This article was sort of a response to comments on how good players age vs big boned players.
If you look at the history of baseball and the age HOF’s were essentially done and out of baseball that age is 36.55 years old. I understand that medical science was not the same in 1920 as it is today, but these numbers hold true for recent HOF’s. A team that gives Pujols nine years is going to have a very expensive pinch hitter at some point soon.
First off, shouldn’t you scale the Pujols and Fielder graphs proportionally? Fielder’s scale goes from 0-70 runs while Pujol’s scale goes from 0-60. Also, Fielder’s scale is vertically longer.
Anyways, if a season where he is -40 runs from his peak season means .299/.366/..541? Pujols can be my first baseman anyday
but you wouldn’t want to pay for the peak performance and get 4 WAR less than that, would you? (real question not rhetorical)
Your comment made me check the value of Pujols in his 2003 peak season (10.1 WAR) and dollar-wise, he was only worth $28.4 million. What everyone (me included) forgot to account for was the mlb decline in offense since the steroid era. Relative to the rest of the league in each respective season, Pujols’ most valuable season was 2008 (9.1 WAR) when he dollar value for that season was $40.9 million. The value of WAR has appreciated. Pujols will probably get $25-30 million a season. The current market value for $25-30 million is 5.6-6.7 WAR. Pujols’ average WAR over his first 11 seasons was 8. Barring injuries and an Andrew Jones-like decline, I fully expect Pujols to average at least 5 WAR over the rest of his career. Considering that teams usually “overpay” in free agency, signing Pujols for $25 million per year is a win-win because he will either be worth more than he is paid (5.6+ WAR) or be worth approximately what he is paid.
Do better players peak earlier (age 25/26) than regular players (age 27) because the better players get to MLB at a sooner age? Would it be better to say nth season instead of age? I doubt it changes too much, but I’m just curious.
I had the same question.
I may look into it, but many people are stuck on age and really don’t care about season. Let me see if there is an easy way to query nth season.
I’d love to see Pujols/Fielder’s careers projected out based on what comp groups we think they’re part of so we can get an idea of the actual value we could expect from them going forward (instead of just the relative change).
How do you see Miguel Cabrera playing out?
I think in a couple of years he will need to make a better effort to take and Keep some weight off.
not really gonna matter how fat he is when he makes the hall with about 90% of the vote in his first eligible year
He won’t get in first year – 90% that is for sure.
The graph makes it look like “normal guys” decline slower or less, but I think a big part of what we’re seeing here is that they only get to keep playing as long as they don’t significantly decline, while star players are much more likely to keep getting playing time even after they do (for reasons of performance, perceived capability, and sentiment).
The main cause is there is less for them to drop. Average player is a 2 WAR/season. Some of these players are at 3 to 5 times that amount.
There’s less for them to drop AND there’s a survival bias in the data. Old guys are not ‘normal guys’. I don’t see why you anchored the graphs to peak seasons; Pujols ‘declining earlier’ doesn’t look like what’s being described, I’m willing to be it’s a hell of a lot harder to maintain 10 WAR seasons, and there’s a lot more variability there.
Good work! I’m amazed at the early peak and rapid decline. It makes me think no team should sign star players (at least not at market value).
I appreciate the update and extension of the Fielder analysis. I thought separating the wheat from the chaff would be important to understand.
I understand the reason for presenting decline curves, but it makes it appear that an average players is better over the course of his career than a hall of famer. One of the commenters here assigned a WAR value to a hypothetical player at a given age, but that’s just not possible. For clarity, can you run it with actual WAR values instead of the relative scale on the y?
i was going to suggest the same thing. i understand this article is about the decline of these players (hence the minus-runs on the vertical axis), but it would be useful to see that even when these stars are declining, they are still putting up x amount of more war/runs/whatever than a replacement-level guy.
UZR is included in the WAR of these players and I would argue for the purposes of this study it would be more prudent to use hitting WAR only simply because of the variability/accuracy of UZR and how that might affect results.
This is especially true of players that have high peaks because of their UZR – something that may not be reliable, and would drop off quickly if the player slows down at all, since they’d probably move positions and lose the positional adjustment as well as lose something like 20 runs in their UZR alone in a matter of years.
A player moving positions is very relevant though. If all of a sudden someone like Chase Utley has to be moved off 2nd to a less taxing position it makes him a less valuable player. Why would you have us not adjust for that?
I agree both with the complaint about UZR and Nik’s response. Will just point out, however, that it is pretty widely held that UZR is laughably unreliable for first basemen. This is really apart from the general issues with UZR that some of us have. I can think of a lot of older star players moving over to 1B, whereas an average player is usually going to stick around because of ability with the glove, and would more likely stick at a position where they are getting positional credit when they are barely a contributor with the bat.
I disagree with your comment about the “variability/accuracy of UZR” but do think it would probably be better to use hitting WAR b/c UZR isn’t available for Hall of Famers prior to 2002 or something. It seems difficult to compare Pujols and Fielder to average Hall of Famers in terms of WAR if their WAR includes UZR and Ruth’s, Aaron’s, Mays’s, et al do not.
Isn’t there an easier way of showing this? Those graphs are very difficult to read and aren’t necessarily useful for any conversation other than, well, “how fast do star players devolve into non-star players?” I feel there is room for another graph with a different y-axis that simply shows WAR. You’d accomplish just as much and it’d be a lot easier to compare “average” players to hall of famers, etc.
It’s effective at showing rapidity of decline. I would also like to see another chart with WAR, but for purposes of being able to graph the decline I suspect this method is better. As Jeff mentioned in the article, the actual WAR values for star players is quite a bit higher than average guys, so there will be a ton of space between the two curves and not present well.
Nice touch using almost all of the Miami Marlins’ new colors in the graphs. Looks like they might go buy an aging player of their own soon.
Re-signing Mike Cameron?
To be fair, it’s tough to use any color for anything and have it not be one of the new Marlins’ colors.
One of if not the greatest difference between elite and normal hitters is bat speed, which is highly dependent on superior physical ability. Higher bat speed not only means more energy transferred from the bat to the ball, but more importantly, it allows the elite hitter to wait that extra millisecond to decide whether to swing or not, and more time to see the pitches true velocity and break. For normal players with normal bat speed, The production decline is likely shallower because bat speed was less of a factor in their hittting ability, as they developed their other hitting skills to reach the major league level. For elite players, a more steep decline in bat speed brought about by aging means a greater adjustment, i.e. swinging much earlier, than when compared to their peak period, which would likely make their decline more steep.
Performance enhancing drugs are a mitigating factor. No reasonable person could conclude that Barry Bond’s performance (and a very good number of his peers) where affected by their access to illegal substances. This analysis needs to focus on this issue front and center in order to be useful. Pujol’s age being in question and his probable history of steroid use (how does one explain his slipping past scouts so easily) must be considered when discussing his future projections.
Father time wins no matter what. Has to be hard…training so hard for years and then no matter what you do you can’t keep up. No wonder these guys can’t fathom the fall off. It happens so fast.