How Predictive Is Expected Home Run Rate?
Last week, I dug up an old concept: expected home run rate. The idea is deceptively simple: assign some probability of a home run to each ball a batter hits in the air, then add them up. It tells you some obvious things — Fernando Tatis Jr. hits a lot of baseballs very hard — and some less obvious things — before getting injured, Aaron Judge had lost some pop.
One question that many readers raised — reasonably so! — is whether this expected home run rate actually means anything. The list of over-performing hitters was full of sluggers. How good is this statistic if it tells you that good home run hitters are, in fact, not as good as their home runs? Sounds like a bunch of nonsense to me.
In search of truth — and, let’s be honest, article topics — I decided to do a little digging. Specifically, I wanted to test three things. First, how stable is expected home run rate? In other words, if a player has a high expected home run rate in a given sample, should we expect them to keep doing it? If the statistic isn’t stable, what’s the point?
Second, how does it do at predicting future home runs? In other words, does an expected home run rate in, say, July predict what will happen the rest of the year? It’s also useful here to see if expected home run rate (from here on in, I’ll be calling this xHR% for brevity) outperforms actual home run rate as a predictor. If xHR% doesn’t do a better job of explaining future home runs than actual home runs, what use is it?
Finally, I wanted to check whether players who outperformed their xHR% in one period tended to continue outperforming it. In other words, is the statistic missing something systematic that could lead a player to continually put up more home runs than a naive exit velocity distribution would expect? A player who is adept at back-spinning the ball, someone who consistently hits balls at only the exact perfect angle for carry, or a batter who consistently hits balls down the line. That’s not a death knell for the model if it happens occasionally — by definition, when you use a subset of statistics to predict an outcome dependent on more things, you’ll miss some things. If it’s consistently missing, though — if a player who outperforms their expectations by 6% in one sample continues to outperform them by 6% in subsequent samples — it’s bad.
Time for some methodology. I started by taking the 2017-2019 seasons and splitting them in half at the midway point. In each year, I calculated xHR% for each first half based on every batted ball hit in the air for that half, with no information from prior or future years. I then took every batter with 50 air balls in both the first and second half and used that to create my sample population.
Of course, using first-half batted ball data in comparison to second-half production carries an obvious problem: the air. More specifically, how warm the air is in the two halves, on average. The second half is simply warmer than the first half, and that means more carry and more home runs. Using first-half rates for home runs to predict second-half outcomes doesn’t make that much sense.
An “easy” thing to do would be to simply calculate expected home run rates based on second-half batted ball results and re-cast the first half rates using those new rates. That’s a poor solution, though. Why? If we’re interested in using xHR% today to predict future home run rates, we obviously can’t use this method. It would be using future data! It’s a lot easier to predict how many home runs someone will hit tomorrow if you have information about how many home runs will be hit tomorrow, more or less.
Instead, I used an approach that sticks to data available without peering into the future. First, I calculated 2016 first-half data — I didn’t use it in my sample set for reasons that will become obvious. I excluded all batted balls from Coors Field, a crude stadium adjustment. Then, I used first-half 2016 data to predict the number of second-half home runs based on the exit velocity of each air ball. Predictably, the estimate was too low — by 10.5%, to be precise. In other words, if every batted ball were 10.5% more likely to become a home run, the prediction would have hit exactly. This means a ball with a 1% chance of becoming a homer in the first half would have a 1.105% chance in the second half, a ball with a 20% chance of getting out would have a 22.1% chance in the second half, and so on.
I then applied those adjustments to 2017. In other words, when using first-half 2017 data to “predict” second-half data, I actually used first-half batted balls and home run probabilities, then added 10.5% to each batted ball’s chance of becoming a homer. In 2018, I used the aggregated data from 2016 and 2017. In 2019, I used the past three years’ data. In this way, I never used data that wasn’t yet available.
Why, you might wonder, did I skip 2015? There’s good evidence that the baseball changed mid-year in 2015. There has been, to my knowledge, no similar in-season change in aerodynamics in the years since. Thus, 2016 became my base year for first-half second-half equalization, and the sample period starts in 2017.
Let’s look at a quick example, because all of this sounds like gibberish. In 2019, Ozzie Albies put 98 balls into the air in the first half of the year. Based on their exit velocity and the frequency of home runs overall in 2019, he ran an xHR% of 12.4%. That lined up well with his actual home run rate of 13.3% on those balls. Based on the temperature adjustment, that’s equivalent to a second-half xHR% of 14.4%. In the second half, Albies cooled off. He ran an xHR% of only 12.7% (despite the hotter conditions making homers more likely league-wide) and an actual home run rate of only 9.2% on his 120 balls in the air.
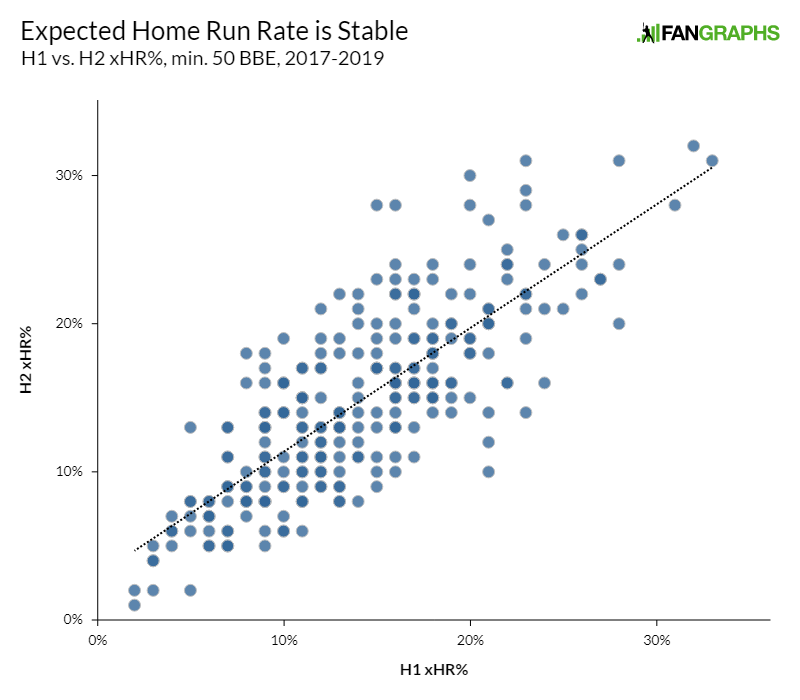
There were 275 player-seasons that fit my criteria: 50 balls in the air in both the first and second halves. First, I tested reliability. There’s good news on that front: after adjusting for temperature, xHR% in the first half correlates extremely well with xHR% in the second half. More specifically, I found a .642 r-squared between the two. That’s comparable to something like strikeout rate or walk rate, two of the bedrock batter skills. Want it in graph form? It looks like this:
Of course, that’s only step one. xHR% is stable — but does it say anything predictive? Does a high xHR% in the first half mean anything for home run rate in the second half? Great news — it does! There’s an r-squared of .465 between first-half xHR% and second-half HR%, which means that 46.5% of the variation in second-half home run rate can be explained by variation in first-half xHR%. That’s not as strong as the metric’s reliability, but it’s no joke in a sport with so many moving parts. For example, first-half home run rate only checks in at .421.
Does this mean that xHR% is a more useful metric, when it comes to prediction, than actual home runs? I’ll level with you — I wasn’t exactly sure what the right statistical test was here, so I settled for some descriptive terms. Any statisticians, please feel free to weigh in — this is absolutely not my strong suit. For now, I’m going to say that it is. A higher r-squared isn’t the end-all be-all, but it means a lot, and I’ll leave it at that for now.
One last question: is it missing something in terms of serial outperformance? In other words, did players who outperformed their xHR% in the first half continue that outperformance, and vice versa? The answer, as is true of so many things, is “somewhat.” First-half error (HR% – xHR%) is only slightly correlated to second-half error. The r-squared checks in at a mere .08, and it’s not a matter of some batters in the middle skewing the sample, though it does appear we’re missing some signal.
The top 25 player-seasons had an average first-half outperformance of 7% — in other words, their actual home run rate was seven percentage points higher than their xHR%. In the second half, those same players outperformed their xHR by three percentage points. They still outperformed expectations, but by a far lower rate.
On the other side of the coin, the 25 seasons that showed the most underperformance clocked in at minus six percentage points. In the second half, they came in at -2.5. Again, there’s a signal, but it’s small.
What’s the point of all of this? There’s still more research to do, but there appears to be value in approximating home run rates based on exit velocity distribution alone. It won’t solve the puzzle of which hitters will do what, but it provides extra clues, and it can point to players who are likely to have a little bit better — or a little bit worse — home run luck moving forward.
Ben is a writer at FanGraphs. He can be found on Bluesky @benclemens.
Using my own half-baked methodology for predicting home runs with PA, BIP, FB, and HR/FB rates (I’m a big fan of “good enough”), I’ve found that it’s basically 2 per week for top power hitters, distributed lumpily. Of course, you can also get there the easy way by just taking year-end home run totals and dividing by weeks of the season (usually 26). My method doesn’t account for injuries (it doesn’t seem like yours does either) so I expect the players collectively to modestly underperform the projection.
Like you, I’m not a first-rate statistician, but I would expect any sensible model to outperform actual 1st half HR as a predictor.